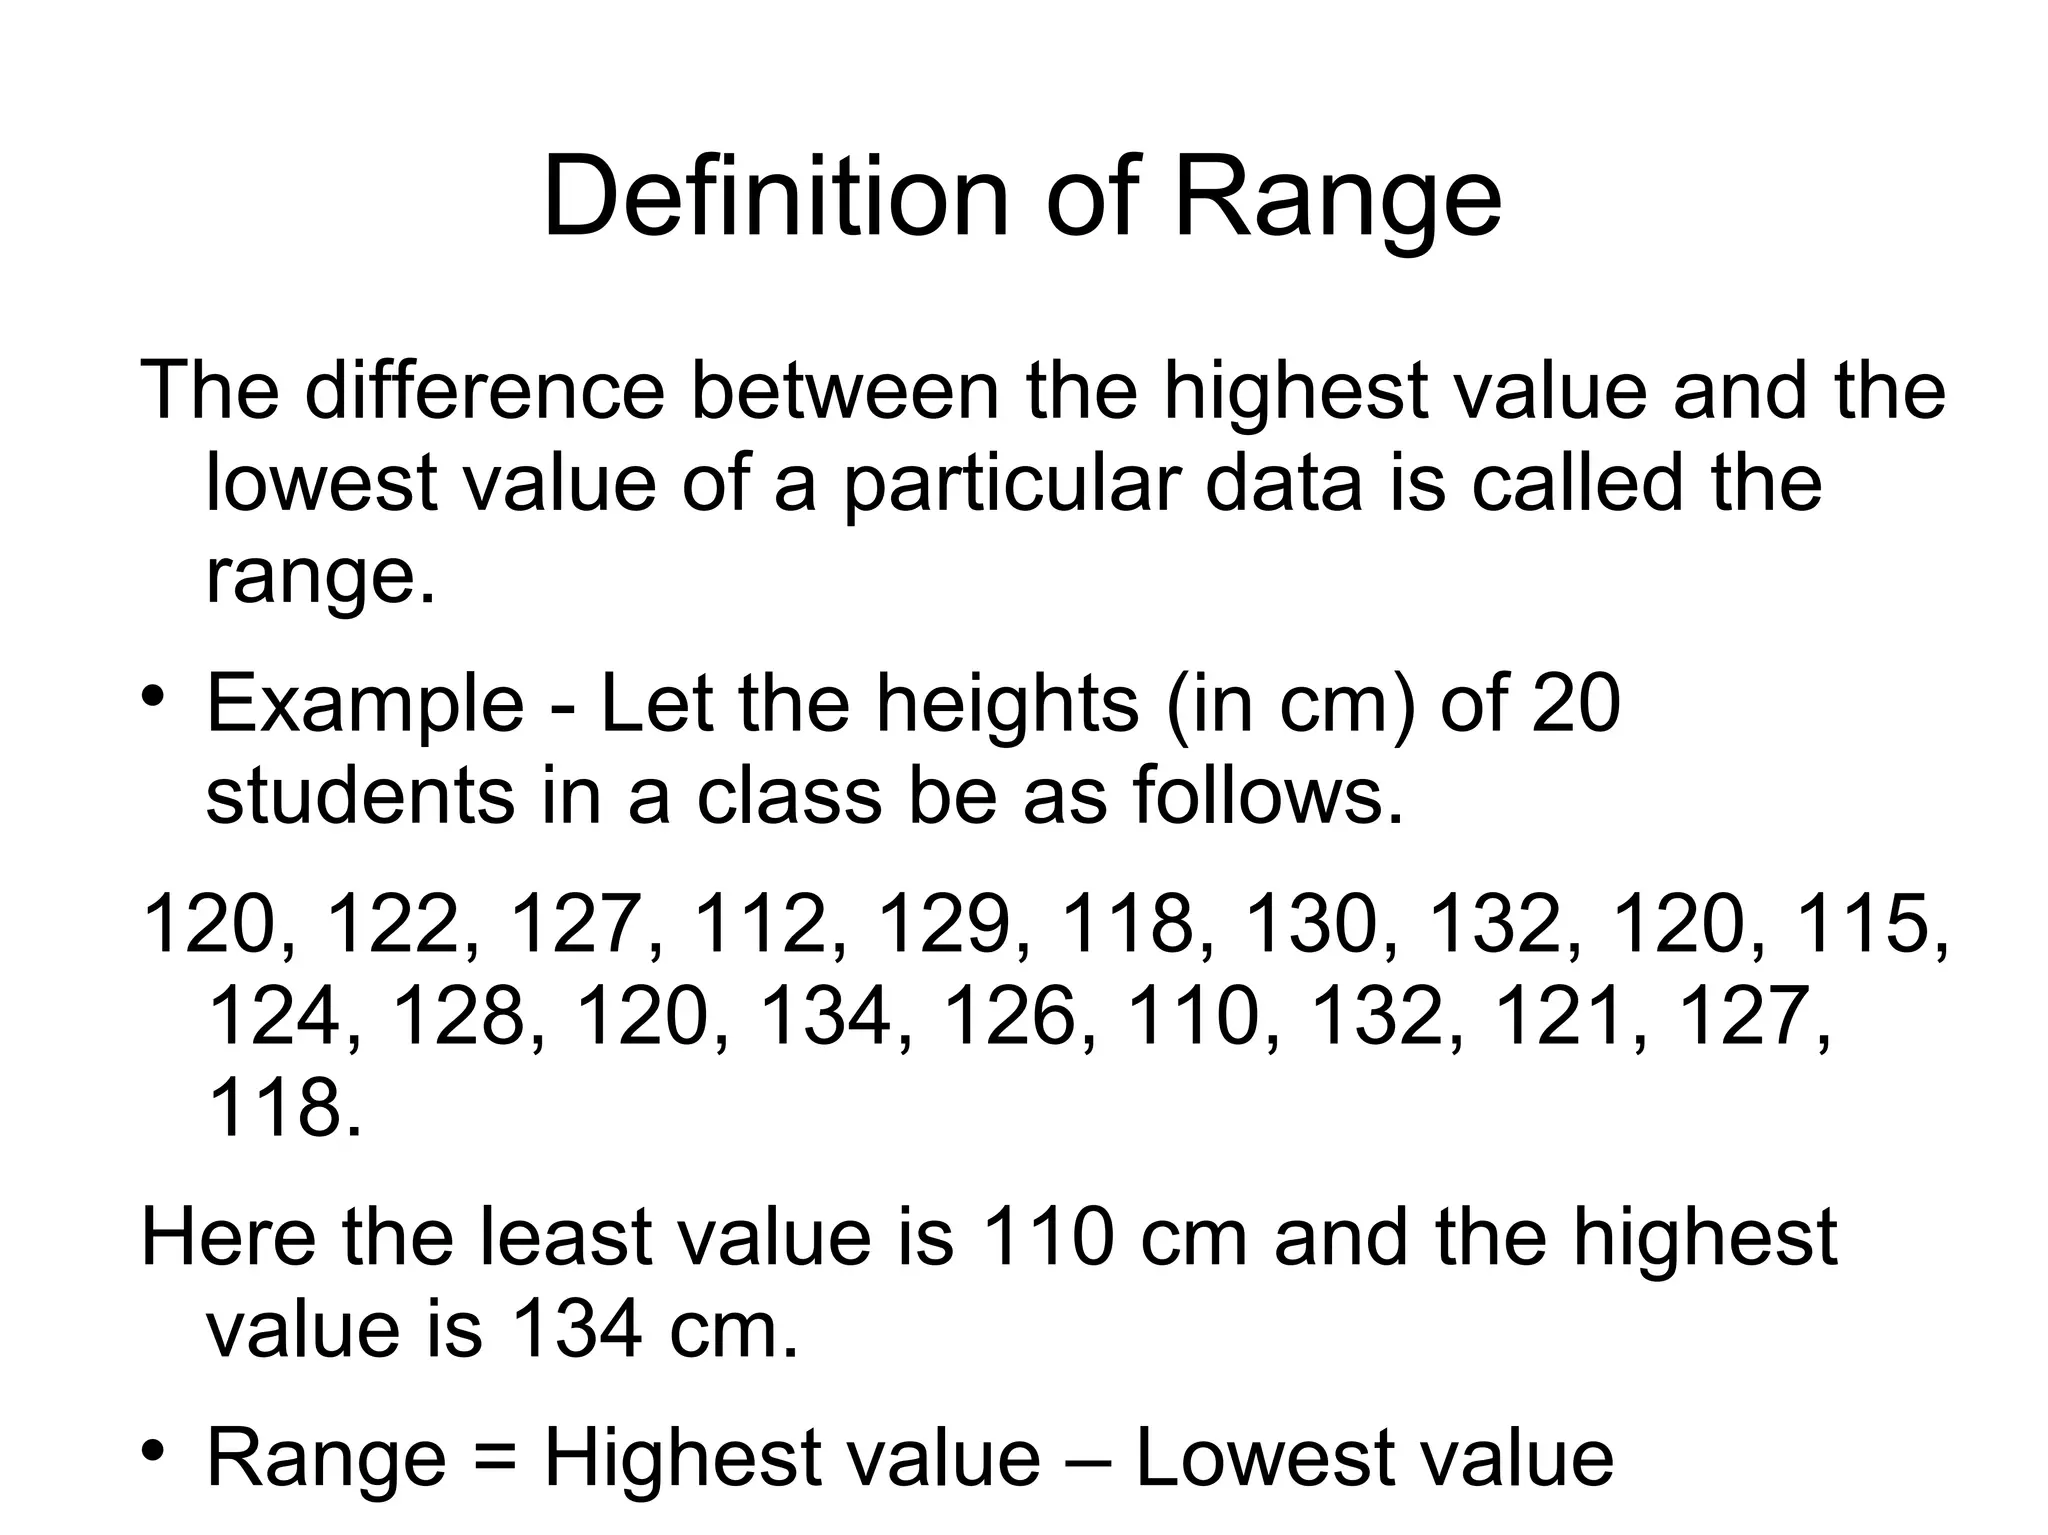
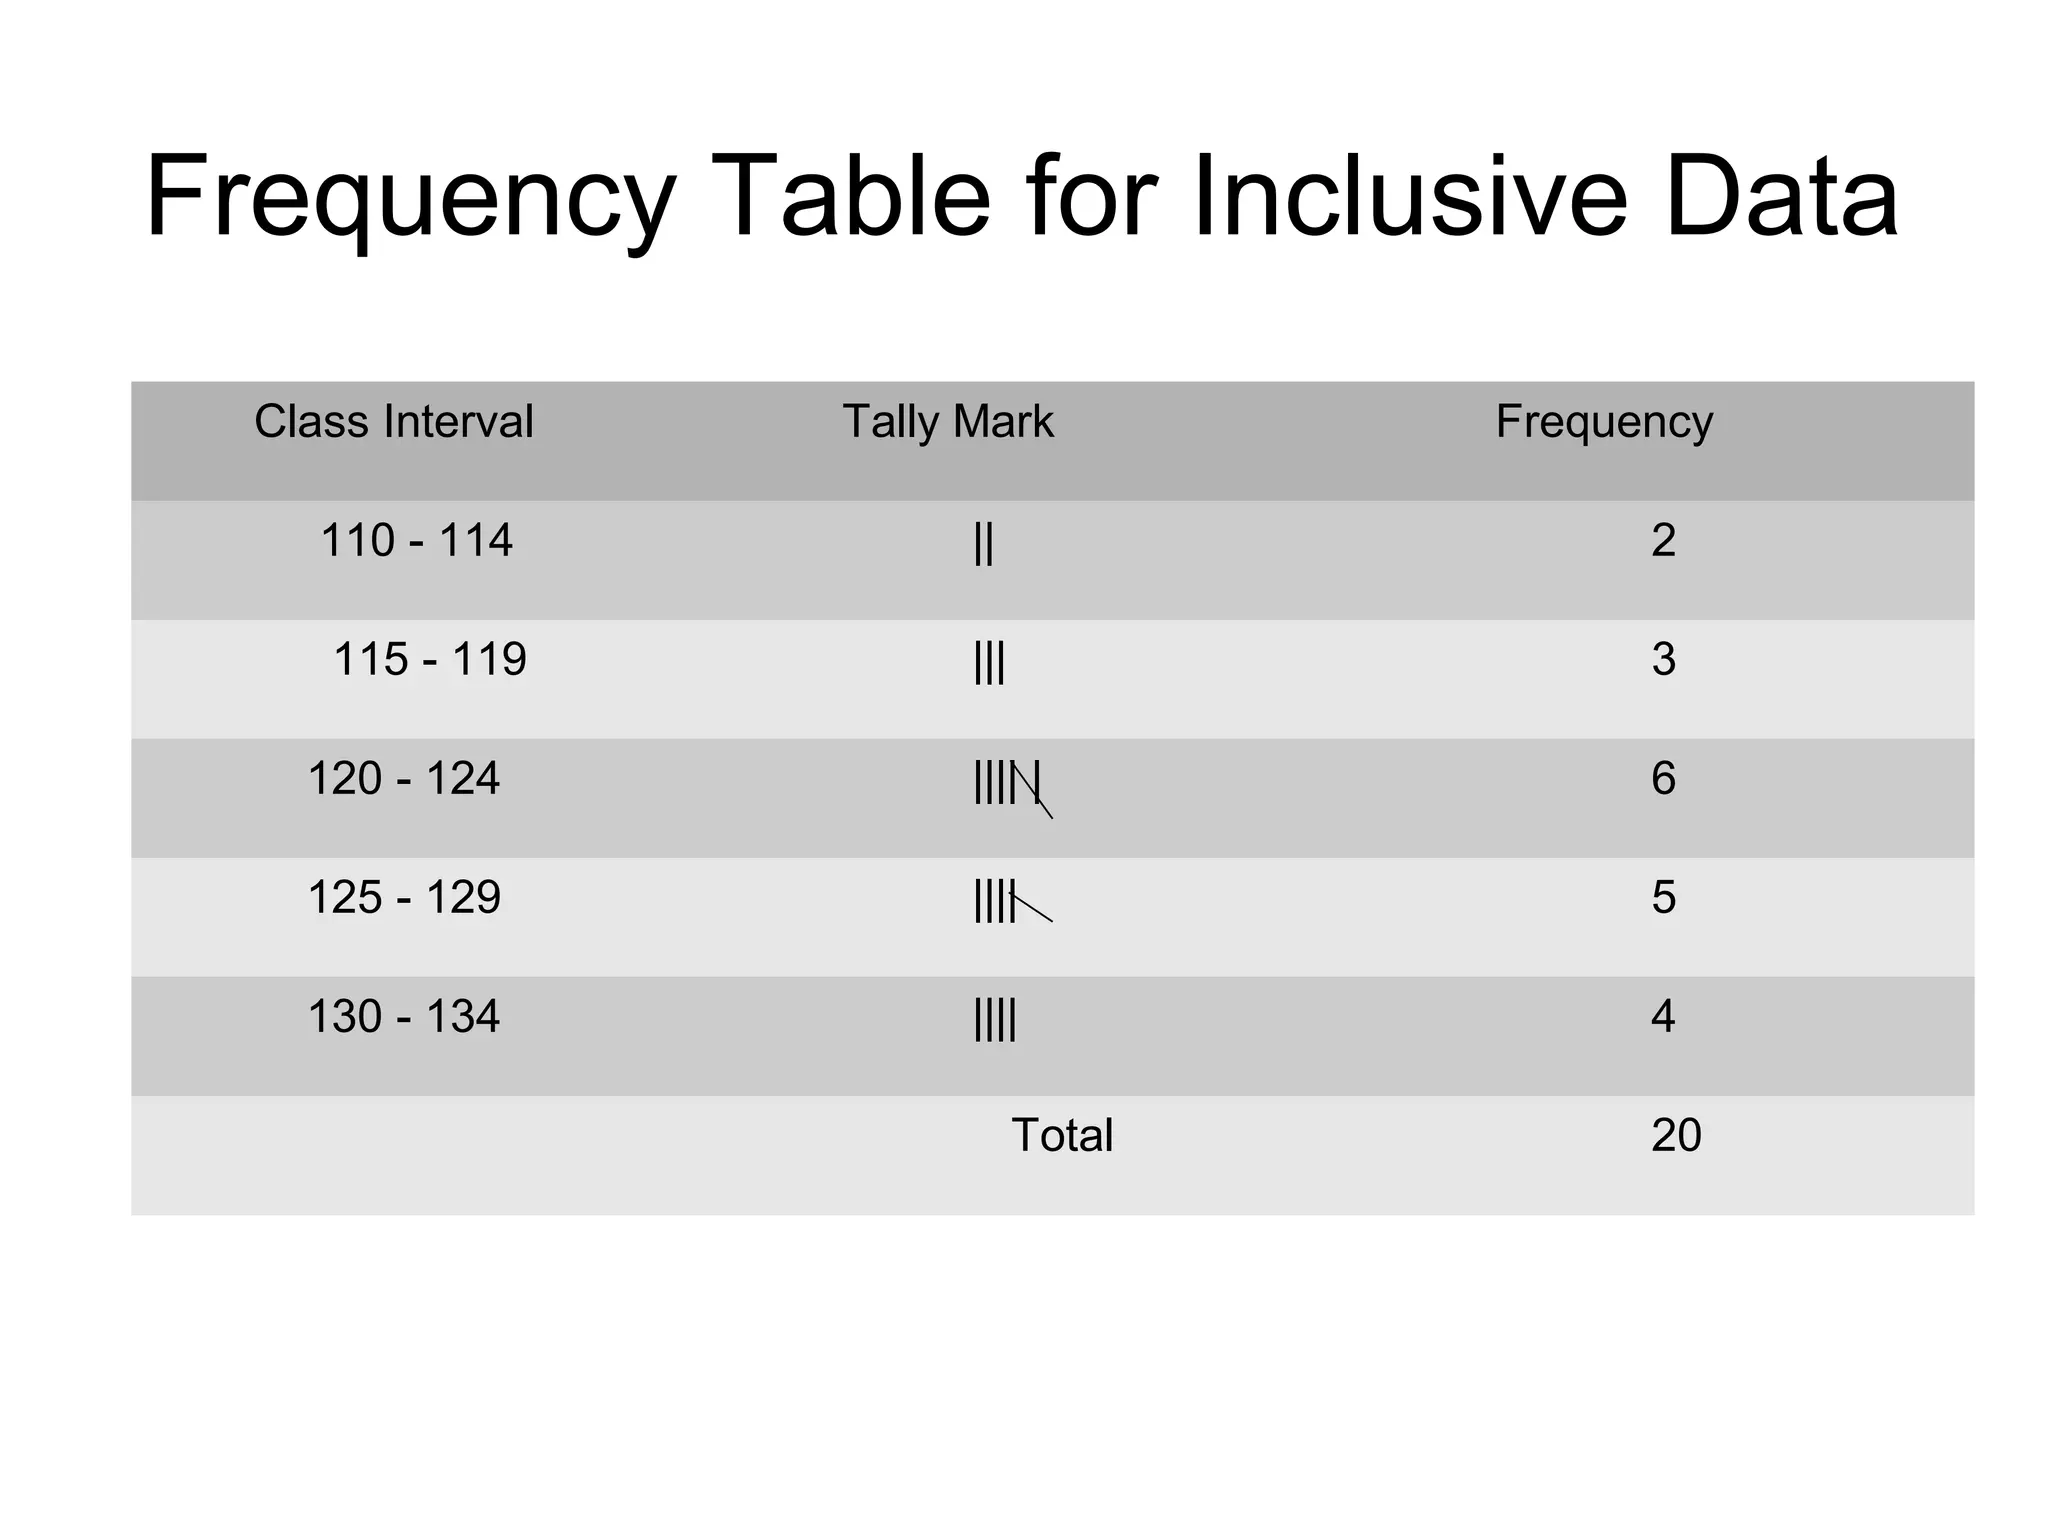
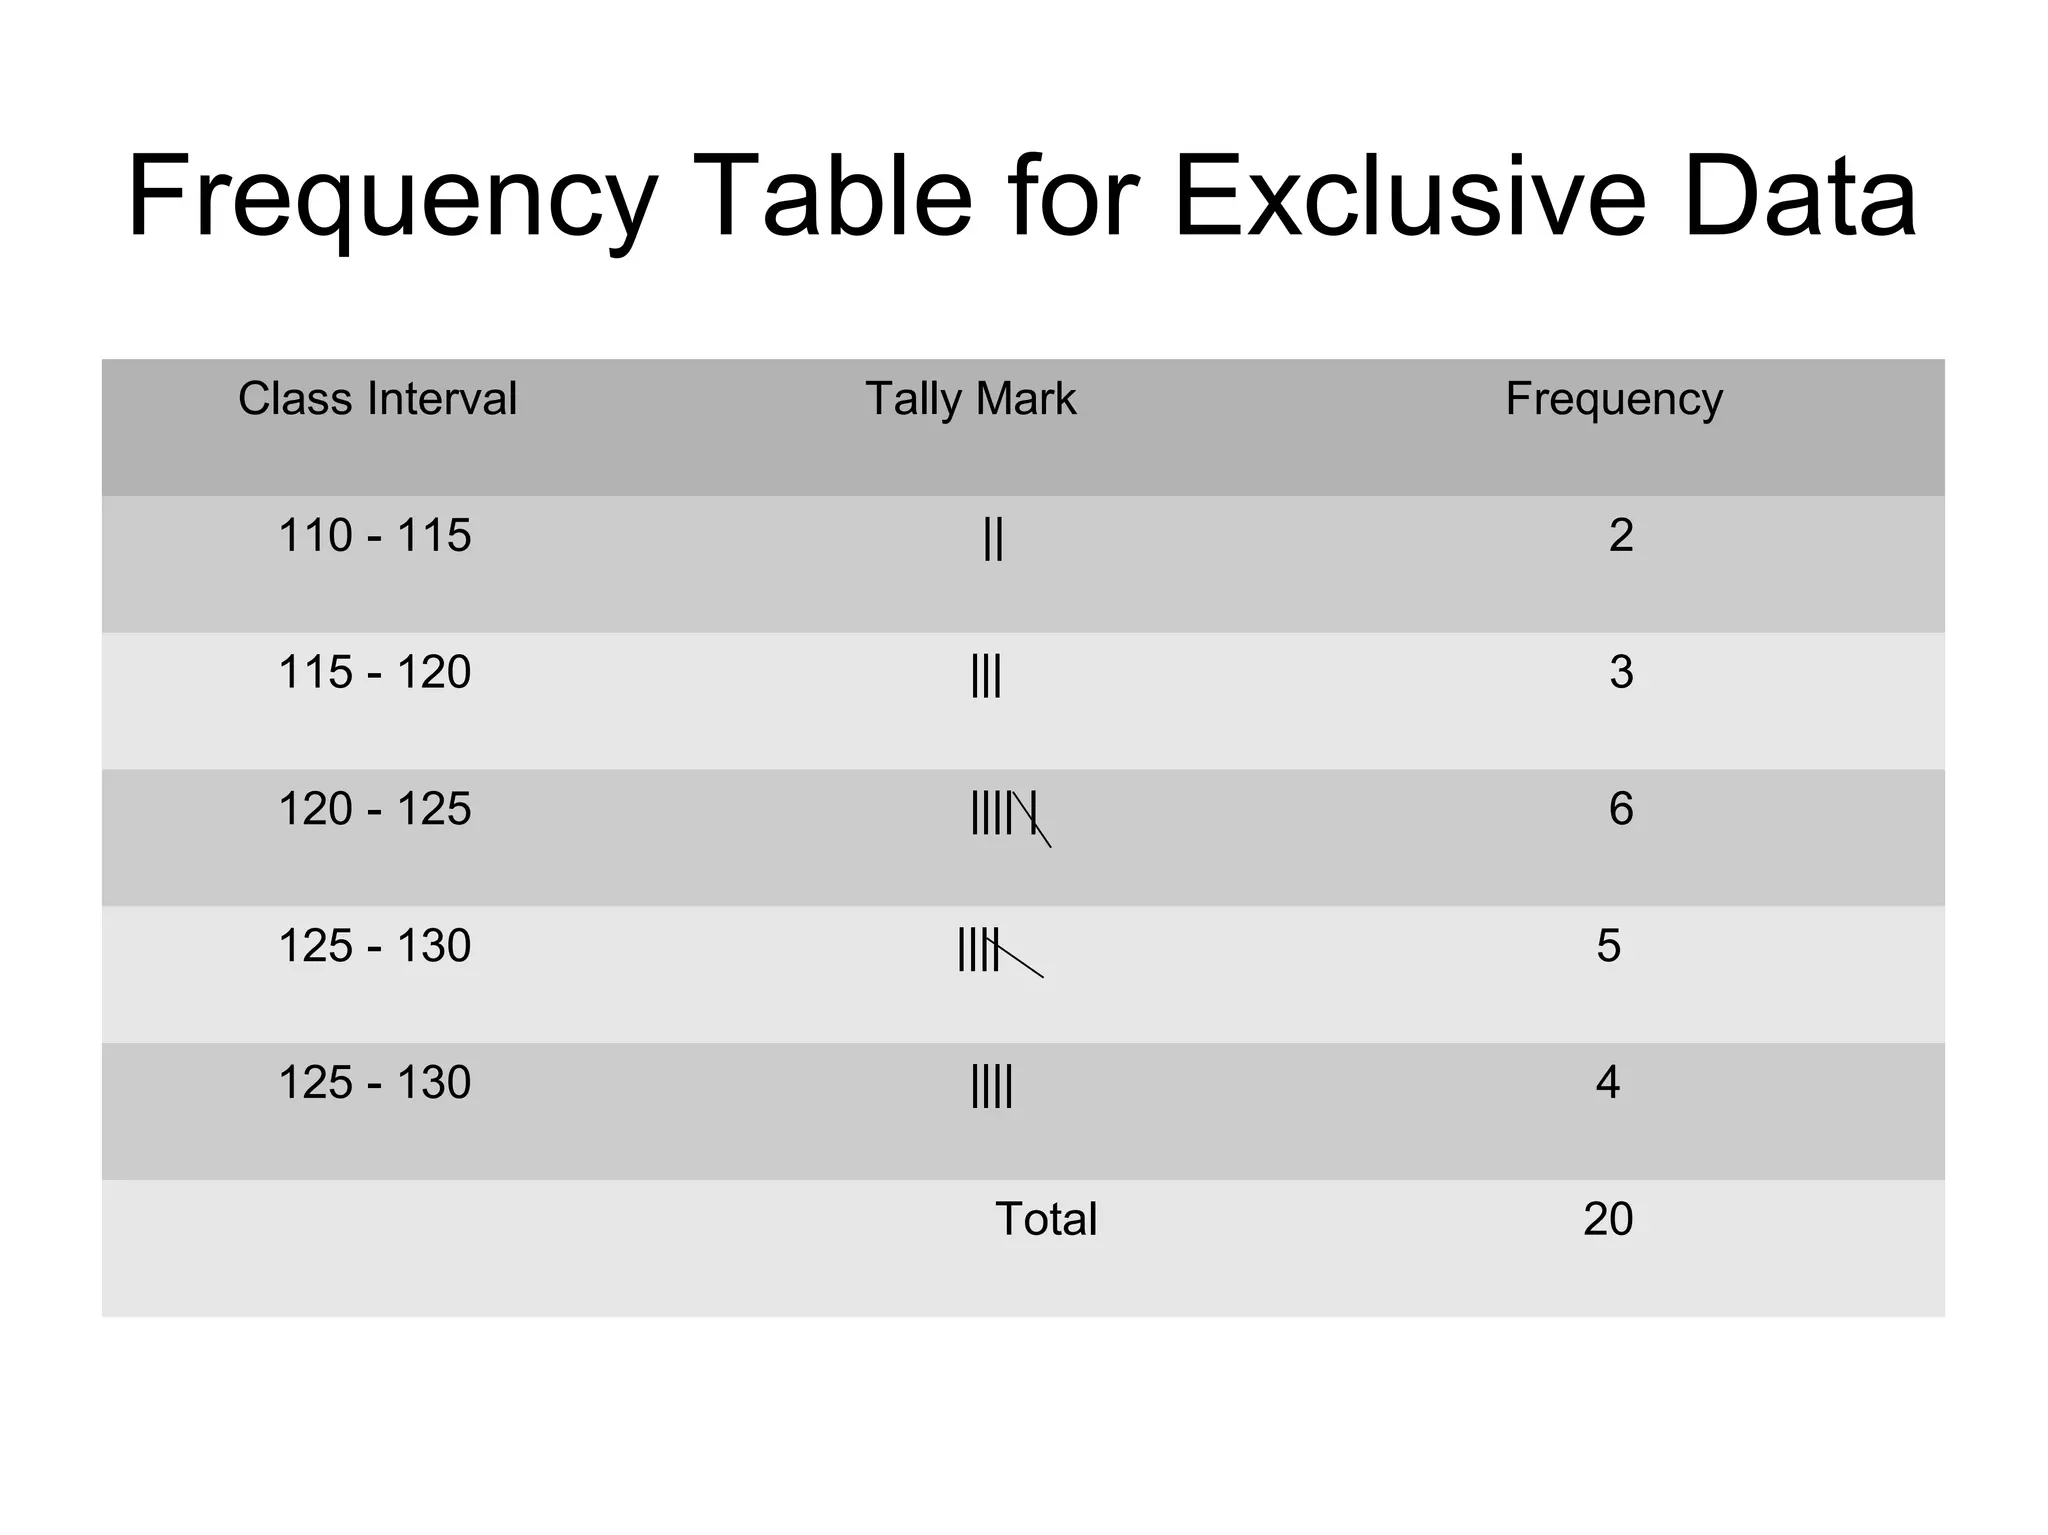
Data Handling
Data Handling is a part of statistics.
Statistics is also a science of numbers.
Statistics deals with the methods of collection,
classification, analysis and interpretation of such
data.
Any collection of information in the form of
numerical figures giving the required information
is called data.
Two types of Data
Depending on the type of data

Raw data

Grouped Data
Depending on the method of collection

Primary Data

Secondary Data
Definition of Variable
As far as statistics is concerned the word variable
means a measurable quantity which takes any
numerical value within certain limits.
Few etxamples are

(i) age,

(ii) income,

(iii) height and

(iv) weight.
Definition of Frequency
Suppose we measure the height of students in a
school. It is possible that a particular value of
height say 140 cm gets repeated. We then
count the number of times the value occurs.
This number is called the frequency of 140 cm.
The number of times a particular value repeats
itself is called its frequency.
Definition of Range
The difference between the highest value and the
lowest value of a particular data is called the
range.

Example - Let the heights (in cm) of 20
students in a class be as follows.
120, 122, 127, 112, 129, 118, 130, 132, 120, 115,
124, 128, 120, 134, 126, 110, 132, 121, 127,
118.
Here the least value is 110 cm and the highest
value is 134 cm.

Range = Highest value – Lowest value
Class

In the above example if we take 5 classes say
110 - 115, 115 - 120, 120 – 125, 125 - 130, 130
- 135 then each class is known as class
interval. The class interval must be of equal
size. The number of classes is neither too big
nor too small.

Optimum number of classes is between 5 and
10.

In class 110 - 115, 110 is called the lower limit
of the class and 115 is the upper limit of the
class.
Class Interval
There are two types of class intervals. They are

Inclusive form - The lower limit as well as
upper limit will be included in that class interval.
For example in first class interval 110 - 114,
the heights 110 as well as 114 are included.

Exclusive form - the first class interval 110 -
115, 110 cm is included and 115 cm is
excluded. In the second class interval 115 is
included and 120 is excluded and so on. Since
the two class intervals contain 115 cm, it is
customary to include 115 cm in the class
interval 115 – 120.
Tally Marks

The height 110 cm, 112 cm belongs to the
class interval 110 - 115. We enter | | tally
marks. Count the tally marks and enter 2 as the
frequency in the frequency column.

If five tally marks are to be made we mark four
tally marks first and the fifth one is marked
across, so that
| | | | represents a cluster of five tally marks.

To represent seven, we use a cluster of five
tally marks and then add two more tally marks
as shown |||| ||.
Frequency Table
A table which represents the data in the form of
three columns, first column showing the
variable (Number) and the second column
showing the values of the variable (Tally mark)
and the third column showing their frequencies
is called a frequency table
Frequency Table
If the values of the variable are given using
different classes and the frequencies are
marked against the respective classes, we get
a frequency distribution.

Tabulation of Data - All the frequencies are
added and the number is written as the total
frequency for the entire intervals. This must
match the total number of data given. This
process of forming a frequency table is called
tabulation of data.
Frequency Table for Inclusive Data
Class Interval Tally Mark Frequency
110 - 114 || 2
115 - 119 ||| 3
120 - 124 |||| | 6
125 - 129 |||| 5
130 - 134 |||| 4
Total 20
Frequency Table for Exclusive Data
Class Interval Tally Mark Frequency
110 - 115 || 2
115 - 120 ||| 3
120 - 125 |||| | 6
125 - 130 |||| 5
125 - 130 |||| 4
Total 20

Data handling

  • 1.
    Data Handling Data Handlingis a part of statistics. Statistics is also a science of numbers. Statistics deals with the methods of collection, classification, analysis and interpretation of such data. Any collection of information in the form of numerical figures giving the required information is called data.
  • 2.
    Two types ofData Depending on the type of data  Raw data  Grouped Data Depending on the method of collection  Primary Data  Secondary Data
  • 3.
    Definition of Variable Asfar as statistics is concerned the word variable means a measurable quantity which takes any numerical value within certain limits. Few etxamples are  (i) age,  (ii) income,  (iii) height and  (iv) weight.
  • 4.
    Definition of Frequency Supposewe measure the height of students in a school. It is possible that a particular value of height say 140 cm gets repeated. We then count the number of times the value occurs. This number is called the frequency of 140 cm. The number of times a particular value repeats itself is called its frequency.
  • 5.
    Definition of Range Thedifference between the highest value and the lowest value of a particular data is called the range.  Example - Let the heights (in cm) of 20 students in a class be as follows. 120, 122, 127, 112, 129, 118, 130, 132, 120, 115, 124, 128, 120, 134, 126, 110, 132, 121, 127, 118. Here the least value is 110 cm and the highest value is 134 cm.  Range = Highest value – Lowest value
  • 6.
    Class  In the aboveexample if we take 5 classes say 110 - 115, 115 - 120, 120 – 125, 125 - 130, 130 - 135 then each class is known as class interval. The class interval must be of equal size. The number of classes is neither too big nor too small.  Optimum number of classes is between 5 and 10.  In class 110 - 115, 110 is called the lower limit of the class and 115 is the upper limit of the class.
  • 7.
    Class Interval There aretwo types of class intervals. They are  Inclusive form - The lower limit as well as upper limit will be included in that class interval. For example in first class interval 110 - 114, the heights 110 as well as 114 are included.  Exclusive form - the first class interval 110 - 115, 110 cm is included and 115 cm is excluded. In the second class interval 115 is included and 120 is excluded and so on. Since the two class intervals contain 115 cm, it is customary to include 115 cm in the class interval 115 – 120.
  • 8.
    Tally Marks  The height110 cm, 112 cm belongs to the class interval 110 - 115. We enter | | tally marks. Count the tally marks and enter 2 as the frequency in the frequency column.  If five tally marks are to be made we mark four tally marks first and the fifth one is marked across, so that | | | | represents a cluster of five tally marks.  To represent seven, we use a cluster of five tally marks and then add two more tally marks as shown |||| ||.
  • 9.
    Frequency Table A tablewhich represents the data in the form of three columns, first column showing the variable (Number) and the second column showing the values of the variable (Tally mark) and the third column showing their frequencies is called a frequency table
  • 10.
    Frequency Table If thevalues of the variable are given using different classes and the frequencies are marked against the respective classes, we get a frequency distribution.  Tabulation of Data - All the frequencies are added and the number is written as the total frequency for the entire intervals. This must match the total number of data given. This process of forming a frequency table is called tabulation of data.
  • 11.
    Frequency Table forInclusive Data Class Interval Tally Mark Frequency 110 - 114 || 2 115 - 119 ||| 3 120 - 124 |||| | 6 125 - 129 |||| 5 130 - 134 |||| 4 Total 20
  • 12.
    Frequency Table forExclusive Data Class Interval Tally Mark Frequency 110 - 115 || 2 115 - 120 ||| 3 120 - 125 |||| | 6 125 - 130 |||| 5 125 - 130 |||| 4 Total 20