Download to read offline


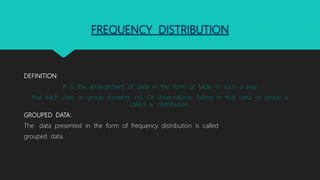

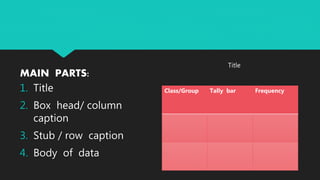
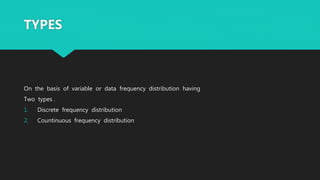
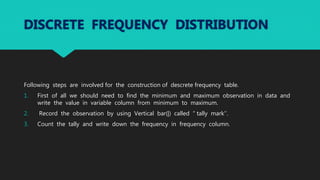
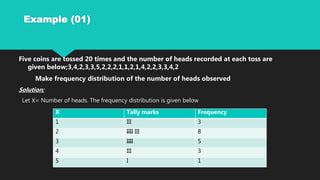
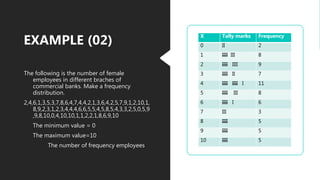
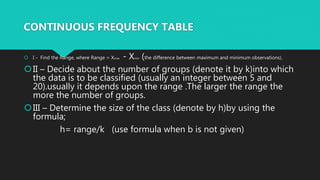
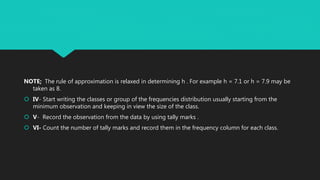
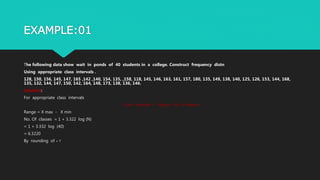
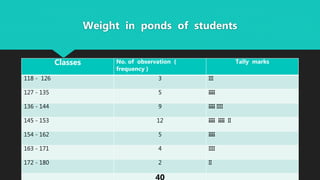
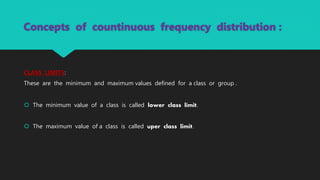
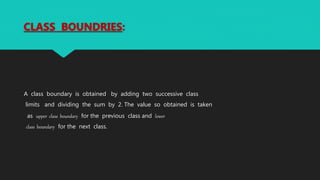
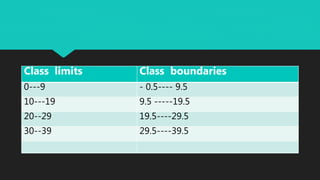
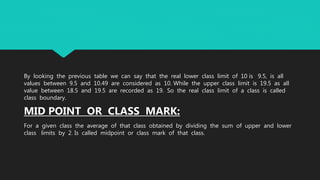
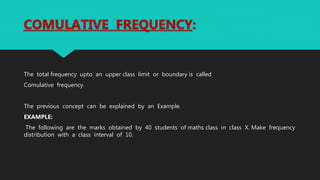
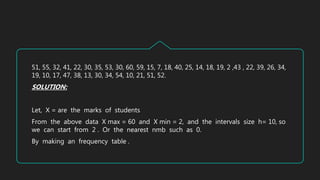
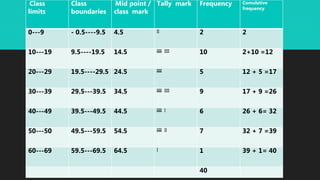

The document defines basic statistics and discusses frequency distribution and types of frequency distributions. It provides steps to construct discrete and continuous frequency distributions, including determining class limits and boundaries. Examples are given to demonstrate creating frequency tables from raw data for discrete and continuous variables. Key concepts discussed include tally marks, frequencies, class intervals, midpoints, and cumulative frequencies.