
Recommended
More Related Content
What's hot
What's hot (20)
Similar to Currency high lights 06.01.17
Similar to Currency high lights 06.01.17 (20)
Recently uploaded
Recently uploaded (20)
Currency high lights 06.01.17
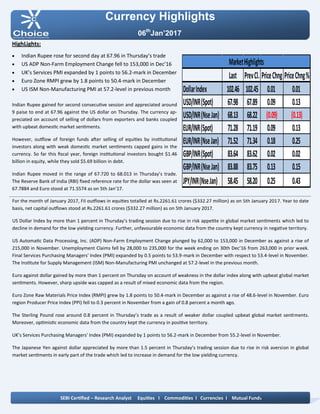
- 1. Currency Highlights 06th Jan’2017 HighLights: Indian Rupee rose for second day at 67.96 in Thursday’s trade US ADP Non-Farm Employment Change fell to 153,000 in Dec’16 UK’s Services PMI expanded by 1 points to 56.2-mark in December Euro Zone RMPI grew by 1.8 points to 50.4-mark in December US ISM Non-Manufacturing PMI at 57.2-level in previous month Indian Rupee gained for second consecutive session and appreciated around 9 paise to end at 67.96 against the US dollar on Thursday. The currency ap- preciated on account of selling of dollars from exporters and banks coupled with upbeat domestic market sentiments. However, outflow of foreign funds after selling of equities by institutional investors along with weak domestic market sentiments capped gains in the currency. So far this fiscal year, foreign institutional investors bought $1.46 billion in equity, while they sold $5.69 billion in debt. Indian Rupee moved in the range of 67.720 to 68.013 in Thursday’s trade. The Reserve Bank of India (RBI) fixed reference rate for the dollar was seen at 67.7884 and Euro stood at 71.5574 as on 5th Jan’17. For the month of January 2017, FII outflows in equities totalled at Rs.2261.61 crores ($332.27 million) as on 5th January 2017. Year to date basis, net capital outflows stood at Rs.2261.61 crores ($332.27 million) as on 5th January 2017. US Dollar Index by more than 1 percent in Thursday’s trading session due to rise in risk appetite in global market sentiments which led to decline in demand for the low yielding currency. Further, unfavourable economic data from the country kept currency in negative territory. US Automatic Data Processing, Inc. (ADP) Non-Farm Employment Change plunged by 62,000 to 153,000 in December as against a rise of 215,000 in November. Unemployment Claims fell by 28,000 to 235,000 for the week ending on 30th Dec’16 from 263,000 in prior week. Final Services Purchasing Managers' Index (PMI) expanded by 0.5 points to 53.9-mark in December with respect to 53.4-level in November. The Institute for Supply Management (ISM) Non-Manufacturing PMI unchanged at 57.2-level in the previous month. Euro against dollar gained by more than 1 percent on Thursday on account of weakness in the dollar index along with upbeat global market sentiments. However, sharp upside was capped as a result of mixed economic data from the region. Euro Zone Raw Materials Price Index (RMPI) grew by 1.8 points to 50.4-mark in December as against a rise of 48.6-level in November. Euro region Producer Price Index (PPI) fell to 0.3 percent in November from a gain of 0.8 percent a month ago. The Sterling Pound rose around 0.8 percent in Thursday’s trade as a result of weaker dollar coupled upbeat global market sentiments. Moreover, optimistic economic data from the country kept the currency in positive territory. UK’s Services Purchasing Managers' Index (PMI) expanded by 1 points to 56.2-mark in December from 55.2-level in November. The Japanese Yen against dollar appreciated by more than 1.5 percent in Thursday’s trading session due to rise in risk aversion in global market sentiments in early part of the trade which led to increase in demand for the low yielding currency. SEBI Certified – Research Analyst Equities I Commodities I Currencies I Mutual Funds Last PrevCl. PriceChng PriceChng% DollarIndex 102.46 102.45 0.01 0.01 USD/INR(Spot) 67.98 67.89 0.09 0.13 USD/INR(NseJan) 68.13 68.22 (0.09) (0.13) EUR/INR(Spot) 71.28 71.19 0.09 0.13 EUR/INR(NseJan) 71.52 71.34 0.18 0.25 GBP/INR(Spot) 83.64 83.62 0.02 0.02 GBP/INR(NseJan) 83.88 83.75 0.13 0.15 JPY/INR(NseJan) 58.45 58.20 0.25 0.43 MarketHighlights
- 2. Technical View: On daily chart, it has been observed that the JPYINR has completed a Bullish Bat harmonic pattern at 57.55 levels the coordinates of which are as follows: Technical Parameter: XA of the leg from 56 to 67.90,AB of the leg completed at 63.30 (i.e.38.20% of XA leg.), BC of the leg completed at 67.50 (i.e. near 88.60% of AB leg) and CD of the leg completed at 57.55 level. (i.e. 88% of XA and 224% of BC leg). On daily chart momentum indicator RSI is trading in oversold zone which indicates up side momentum can be seen in the prices. In addition, momentum indicator MACD has shown posi- tive crossover which suggest possibilities of rebound in the prices on daily chart. So for trading perspective, one could JPYINR buy in the range of 58.30 with SL of 58 for target of 58.90 levels. Pivot levels for the Day Technical View: The pair has shown breakout of its horizontal channel at 67.50 levels on daily chart and price has retested its breakout trend line at 67.40 levels. On daily chart price has taken support of its 61.80% Fib- onacci retracement levels. Moreover, prices have been trading above its 50 DEMA which gives the sign of bullishness in the prices. A momentum indicator RSI has been trading above 40 levels, which suggest further positive momentum can be seen in the prices. In addition, momentum indicator MACD has shown positive crossover on hourly chart. So for trading perspective, one could buy USDINR in range 67.95 with SL of 67.75 for target of 68.50. Currency Highlights 06th Jan’2017 USDINR JPYINR SEBI Certified – Research Analyst Equities I Commodities I Currencies I Mutual Funds S3 S2 S1 Pivot R1 R2 R3 USDINR 67.40 67.73 67.92 68.06 68.25 68.39 68.72 JPYINR 57.76 58.16 58.32 58.56 58.72 58.96 59.36
- 3. Pivot levels for the Day Currency Highlights 06th Jan’2017 GBPINR EURINR Technical View: The price has taken support of its horizontal trend line at 70.60 levels on daily chart. The EURINR pair has also taken support of its falling trend line at 70.70 levels on daily chart. The pair has been trading above its 15 HEMA on hourly chart, which suggest further bullishness can be seen in the prices. On daily chart momentum oscillator RSI has moved up form its oversold zone, which suggest bullishness in the prices. A momentum indicator MACD has shown positive cross- over on 4 hourly chart, which support our bullish view to the prices. For now we can expect prices should move higher to- wards 72.30 levels in the coming trading session. Technical View: The price has shown breakdown of its rising channel pattern at 85 levels on daily chart. The pair has been facing resistance of its falling trend line at 86.10 levels on daily chart. The prices have been facing resistance of its horizontal line at 86 levels. Moreover, prices have been trading below 50 DEMA, which suggest short term trend looks negative. Moreover, momentum indicator MACD has given nega- tive cross over on daily chart, which gives the sign of bearishness in the prices. The momentum indictor RSI has been trading below 60 levels on daily chart, which suggest the possibilities of further weakness in the prices. For now we expect prices should move lower towards 83.10 levels coming trading sessions. SEBI Certified – Research Analyst Equities I Commodities I Currencies I Mutual Funds S3 S2 S1 Pivot R1 R2 R3 GBPINR 82.90 83.37 83.63 83.84 84.10 84.31 84.78 EURINR 70.94 71.29 71.41 71.64 71.76 71.99 72.34
- 4. Currency Highlights SEBI Certified – Research Analyst Equities I Commodities I Currencies I Mutual Funds 06th Jan’2017 Economic Indicators Date Time Data Prior Expected Impact 06.01.17 07:00 PM Average Hourly Earnings m/m -0.1% 0.3% Actual > Forecast = Good for currency; USDINR 06.01.17 07:00 PM Non-Farm Employment Change 178K 175K Actual > Forecast = Good for currency; USDINR 06.01.17 07:00 PM Unemployment Rate 4.6% 4.7% Actual < Forecast = Good for currency; USDINR
- 5. Currency Highlights 06th Jan’2017 SEBI Certified – Research Analyst Equities I Commodities I Currencies I Mutual Funds Anish Vyas Digitally signed by Anish Vyas DN: cn=Anish Vyas, o=Choice Merchandise Broking Pvt. Ltd, ou=Sr. Research Associate, email=anish.vyas@choiceindia.com, c=IN Date: 2017.01.06 08:48:49 +05'30'