Downloaded 1,123 times


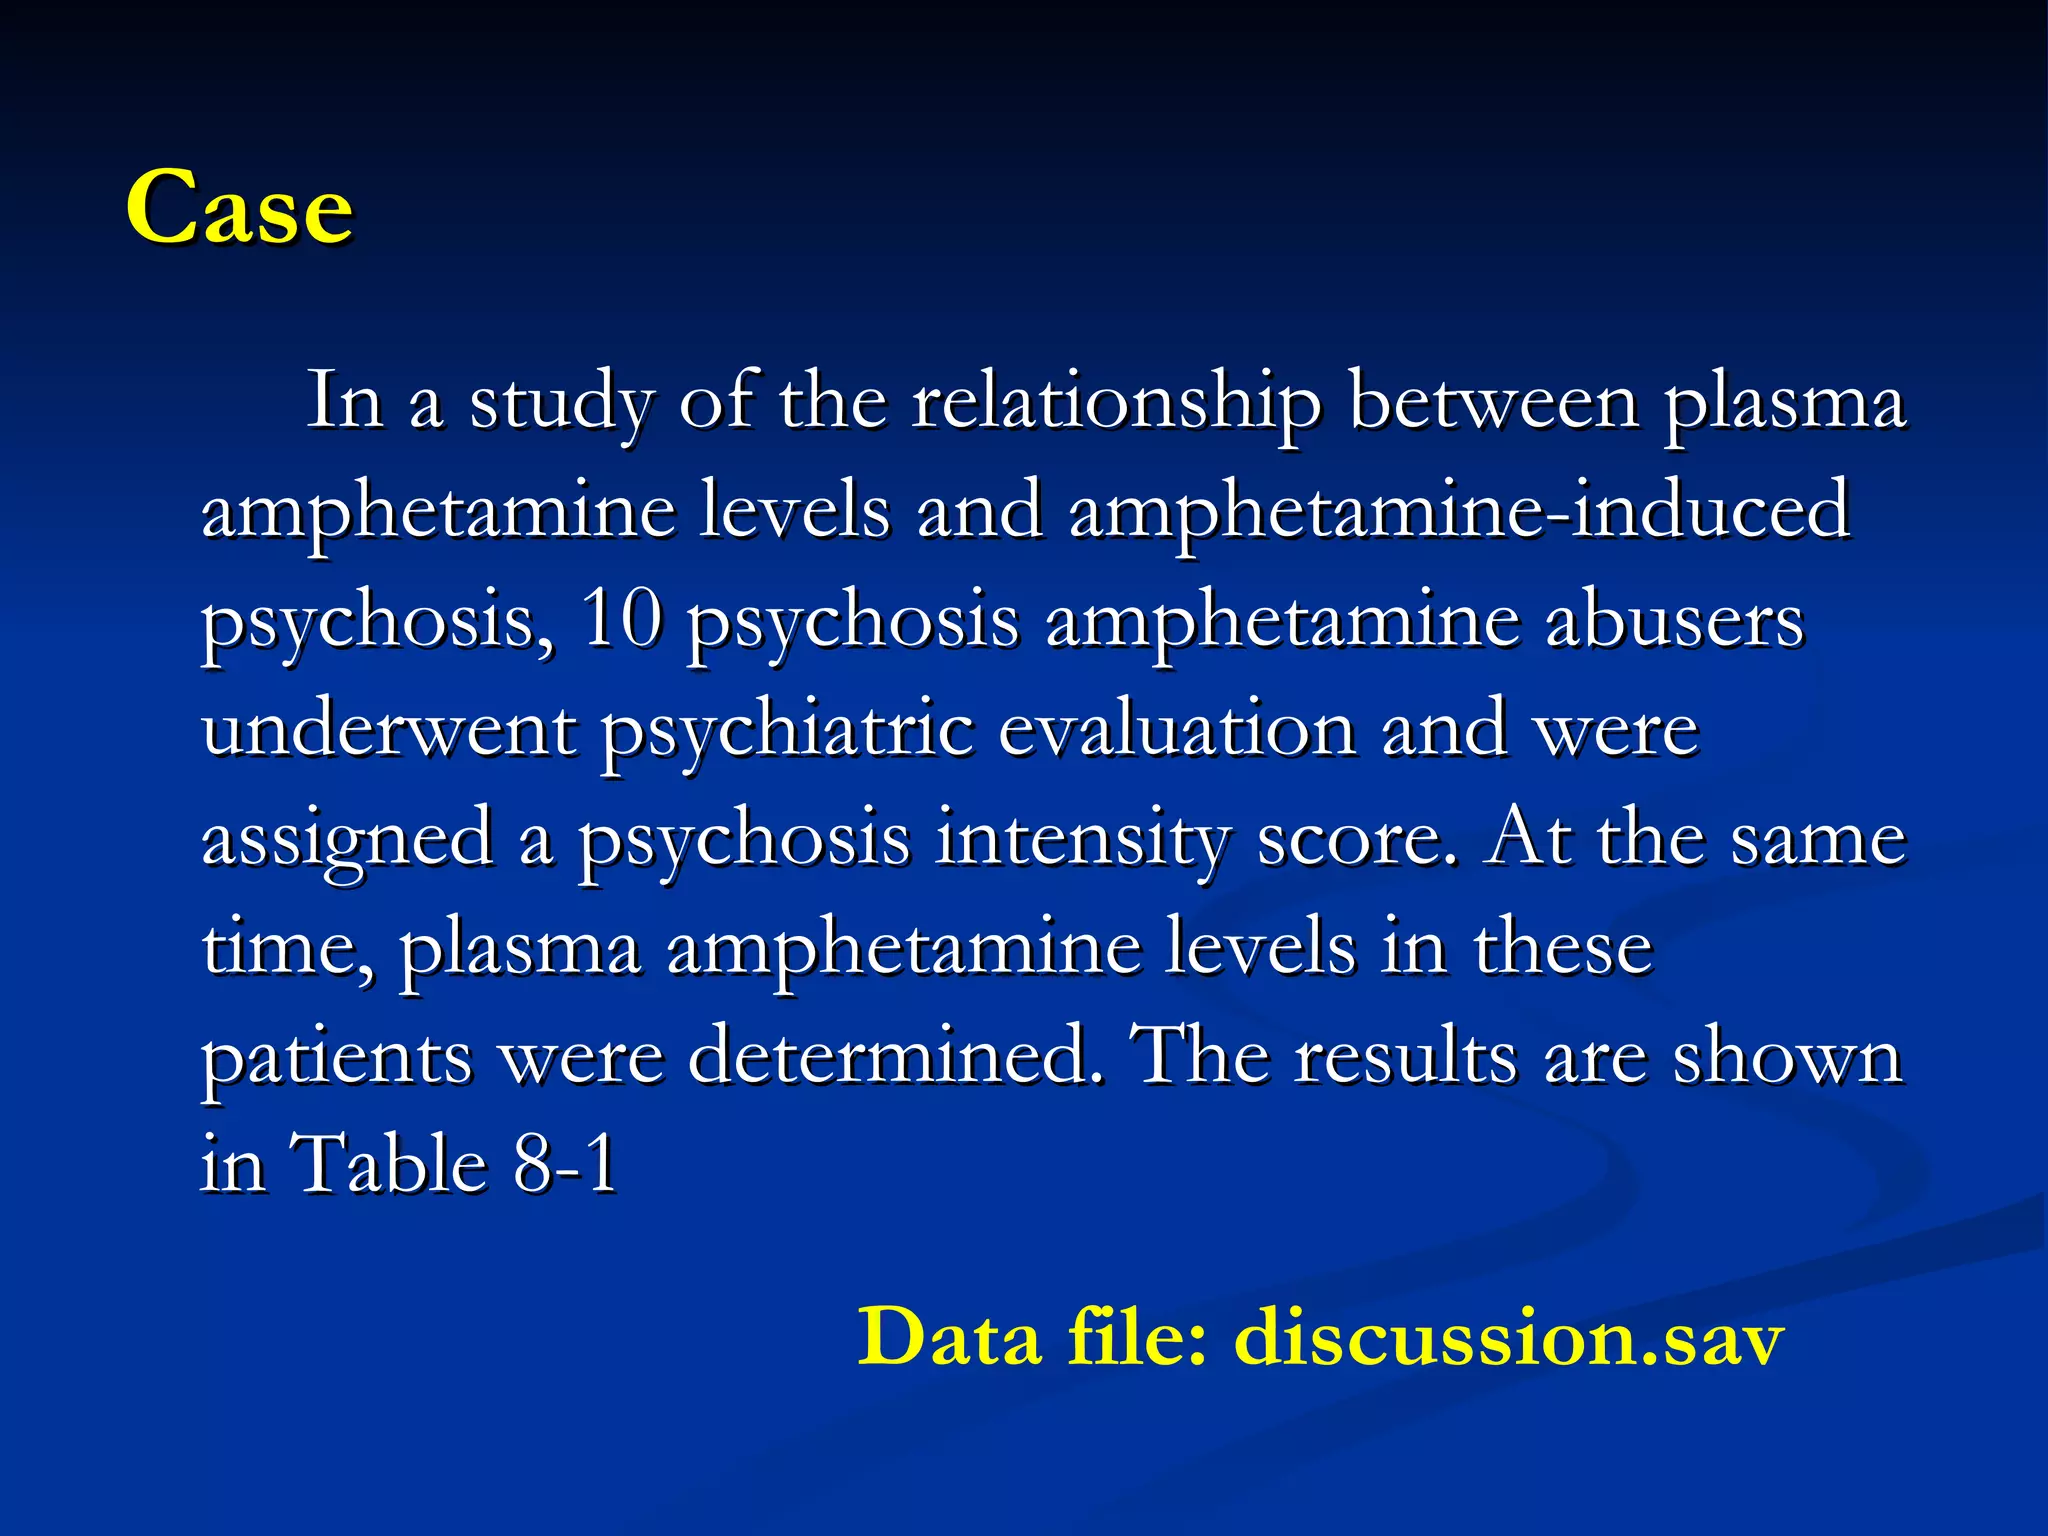
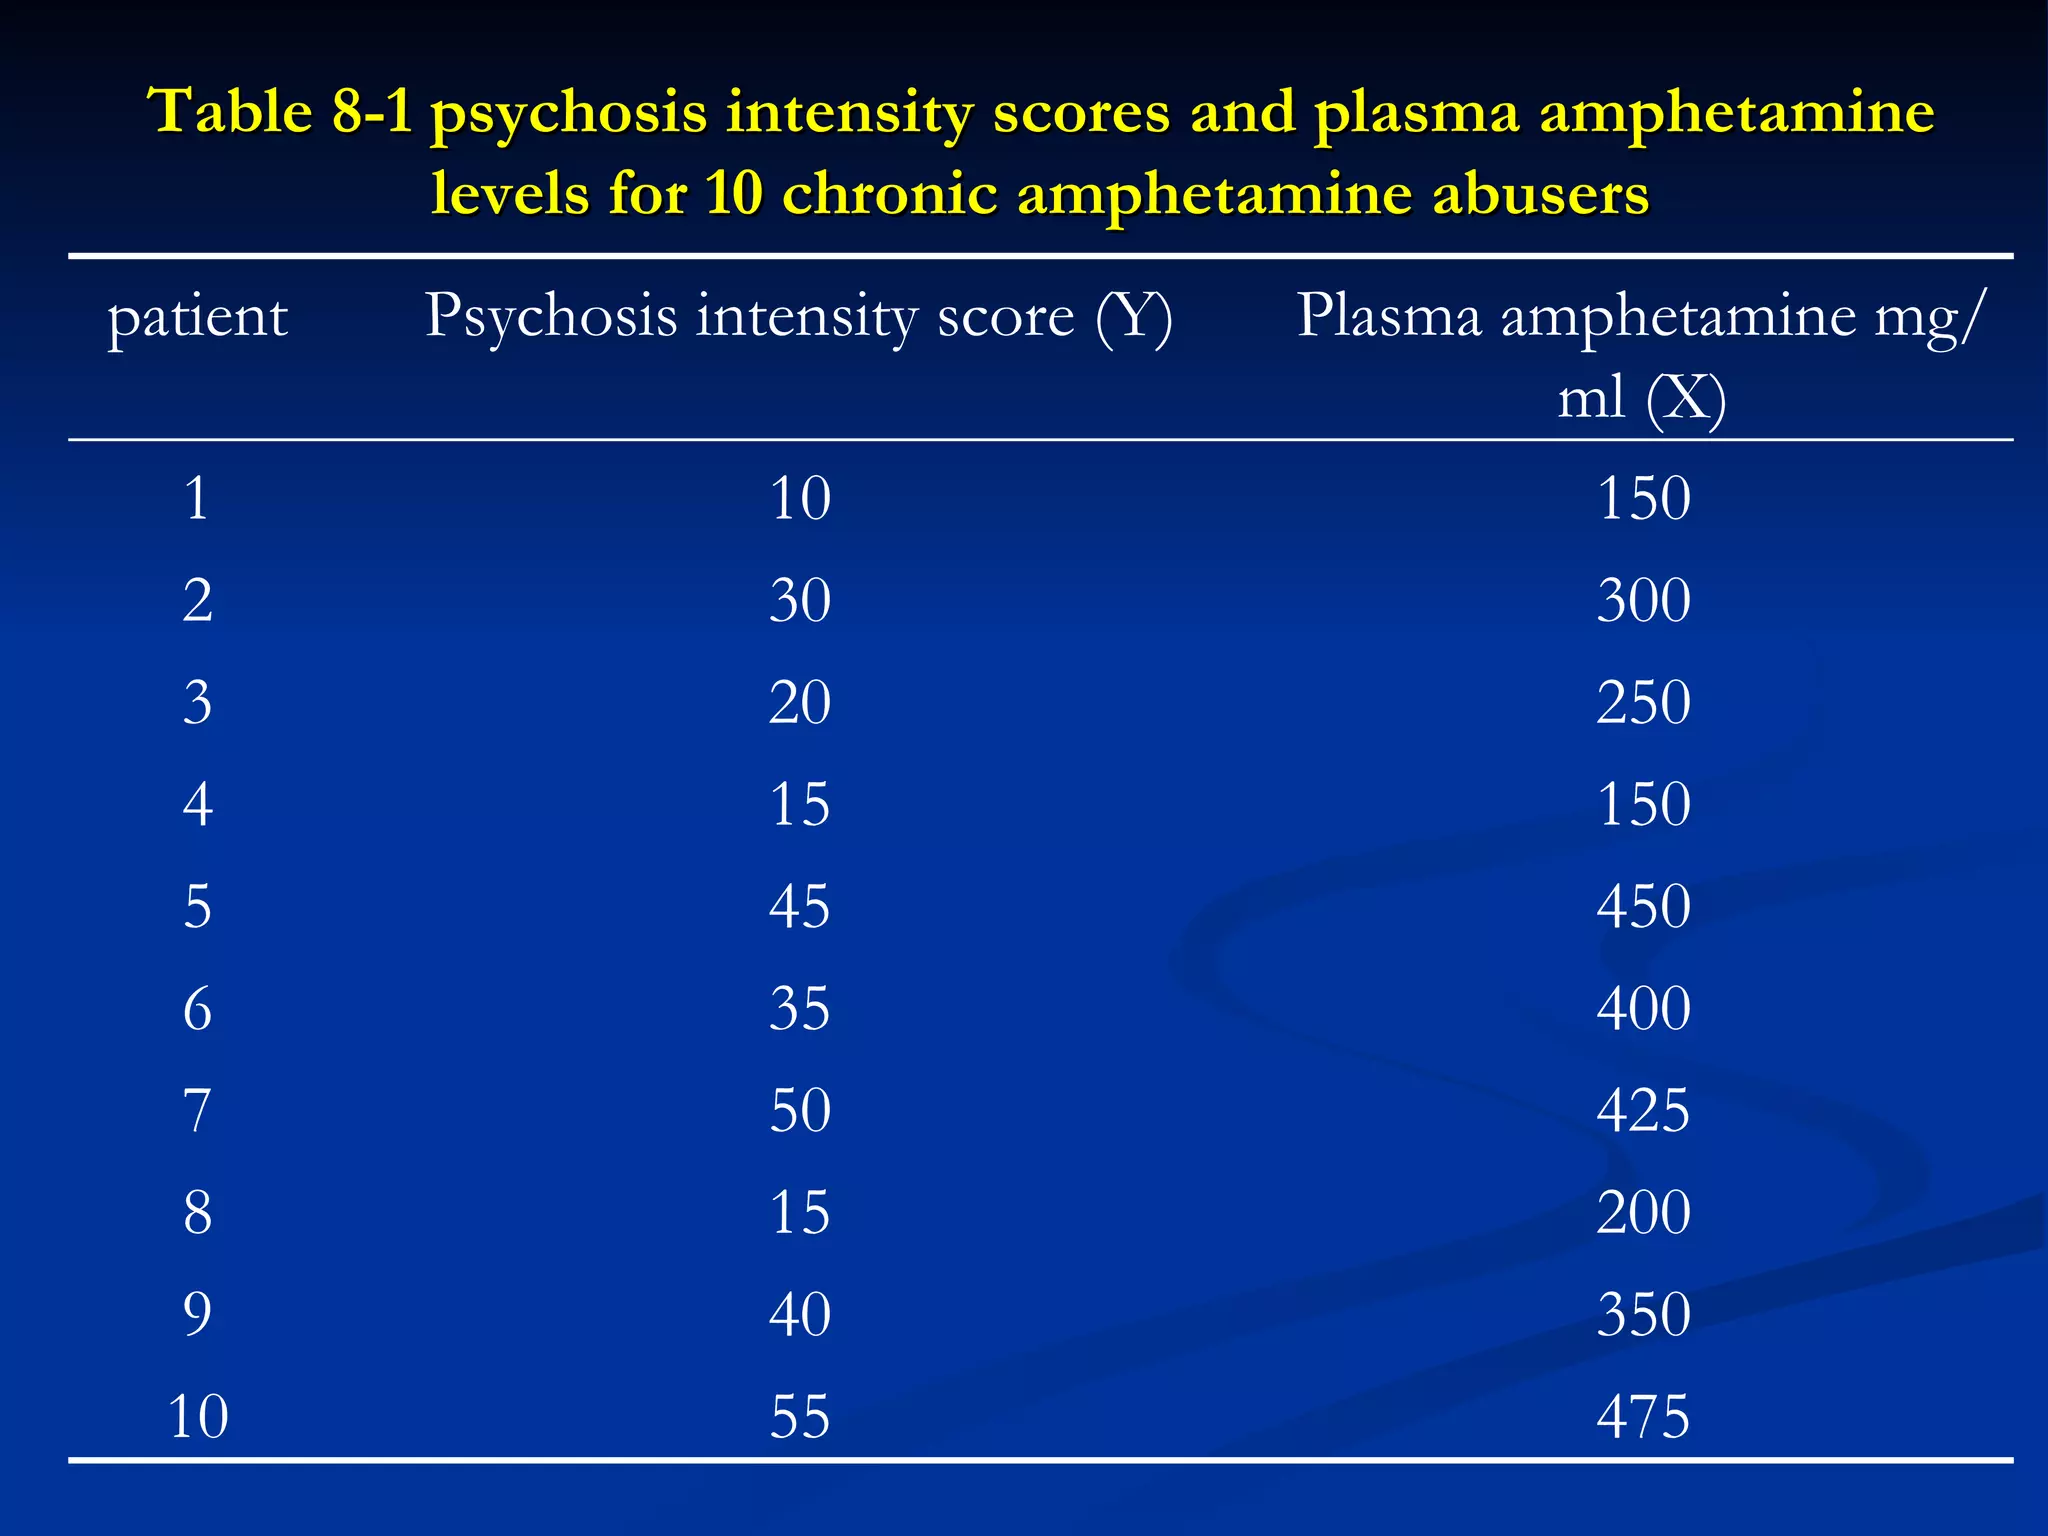
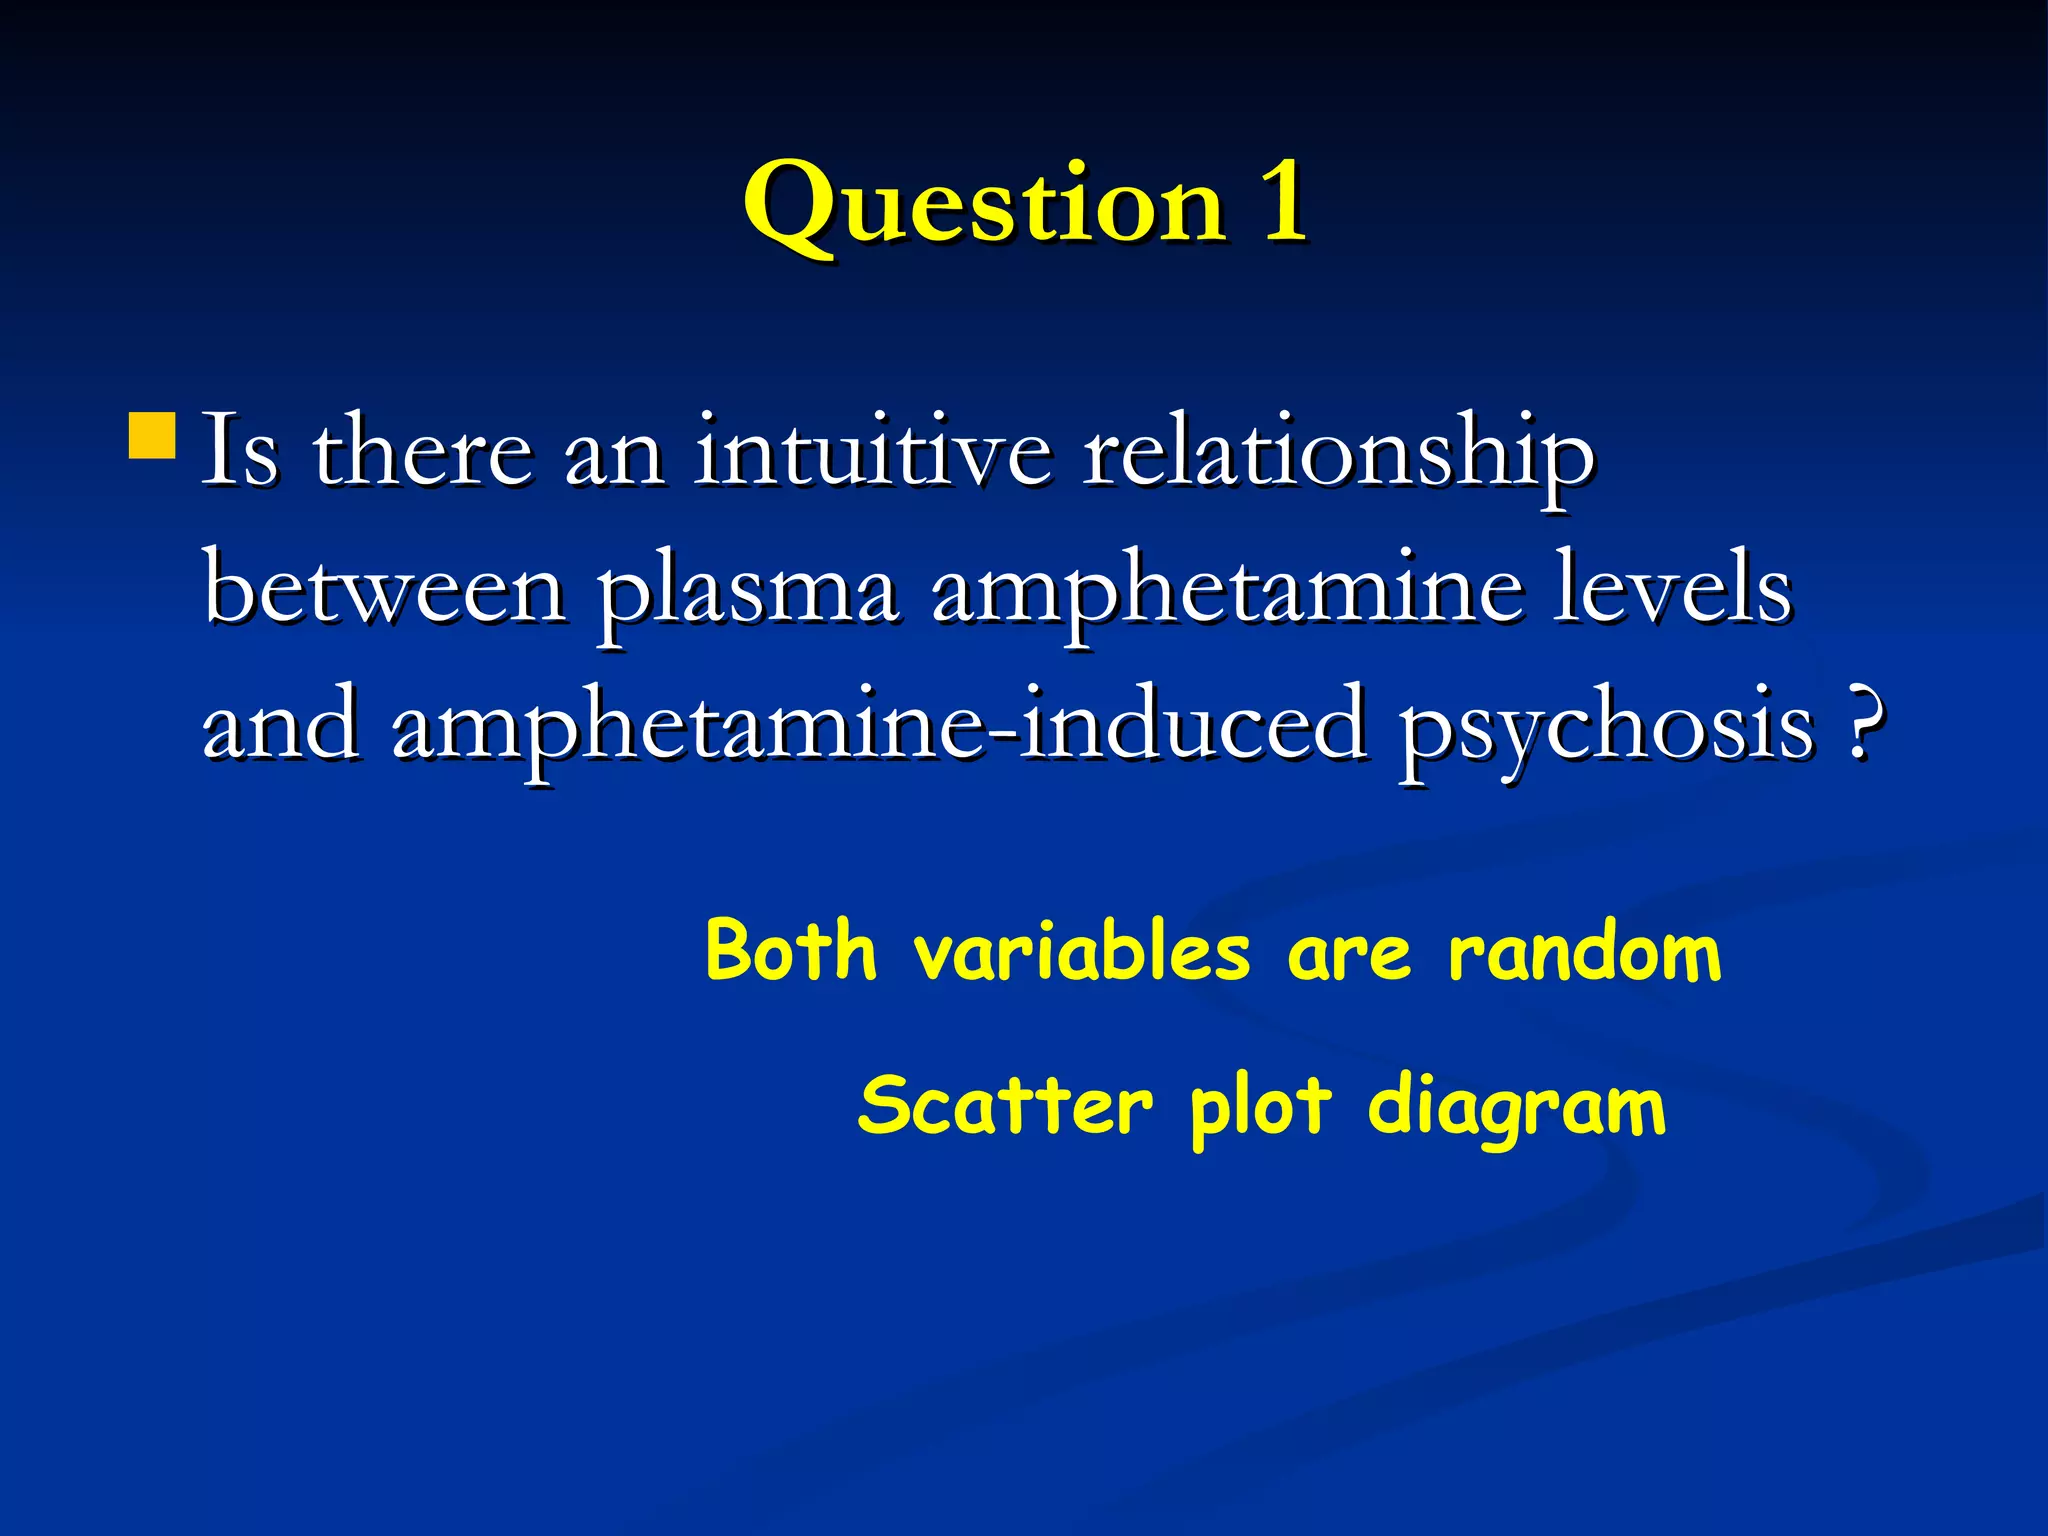
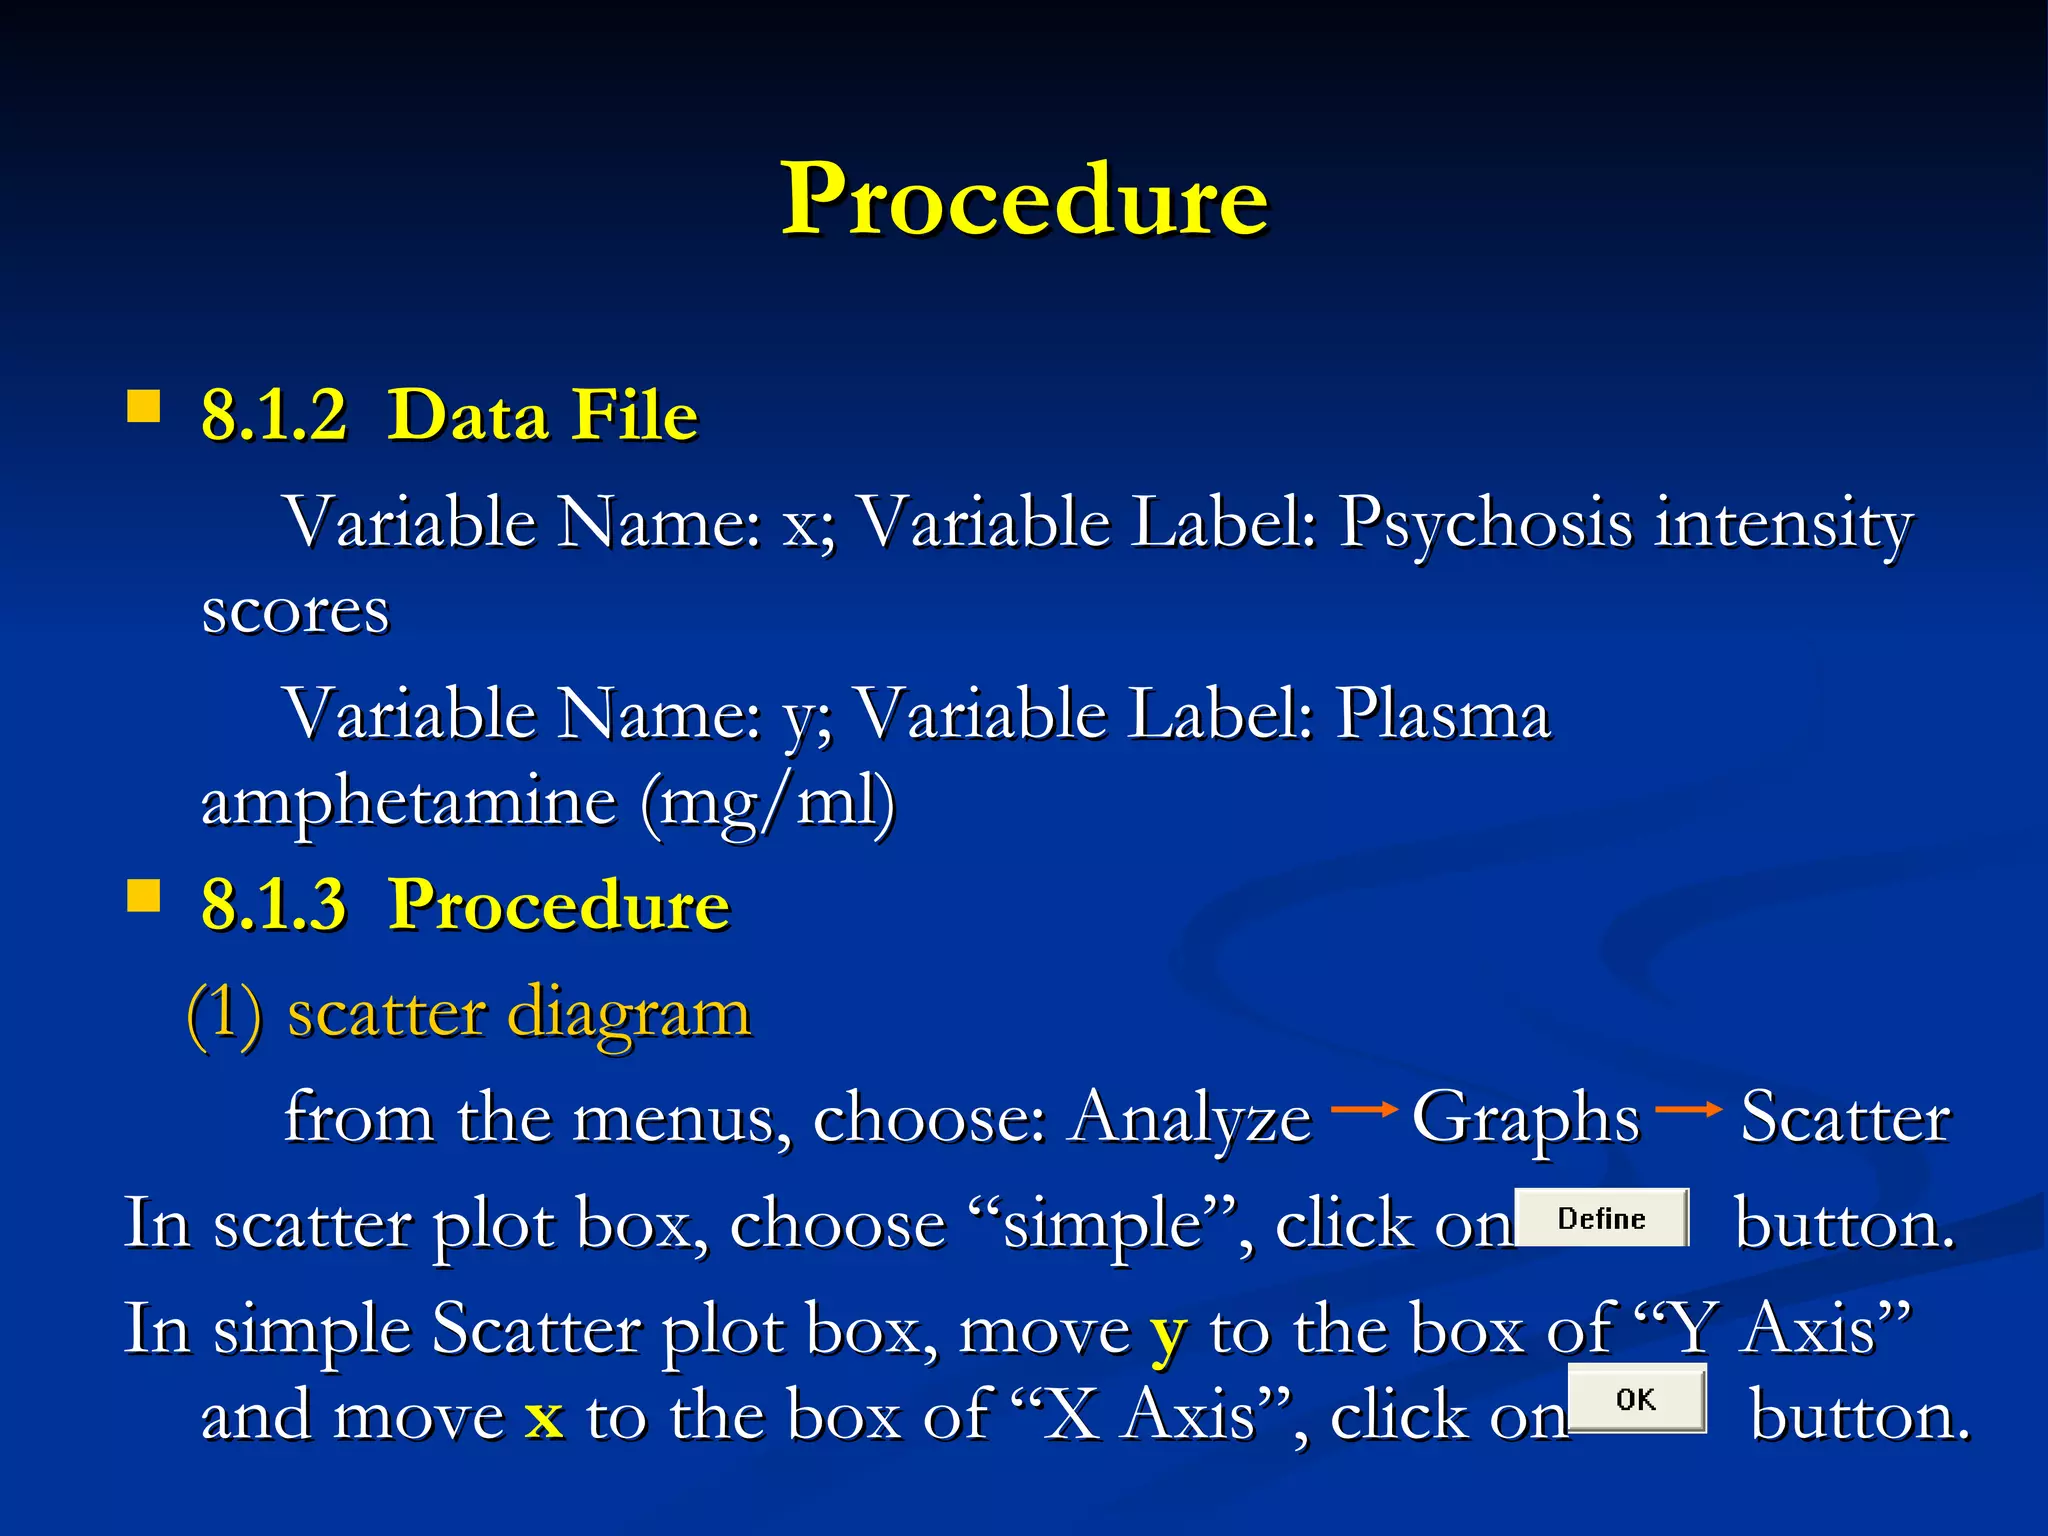
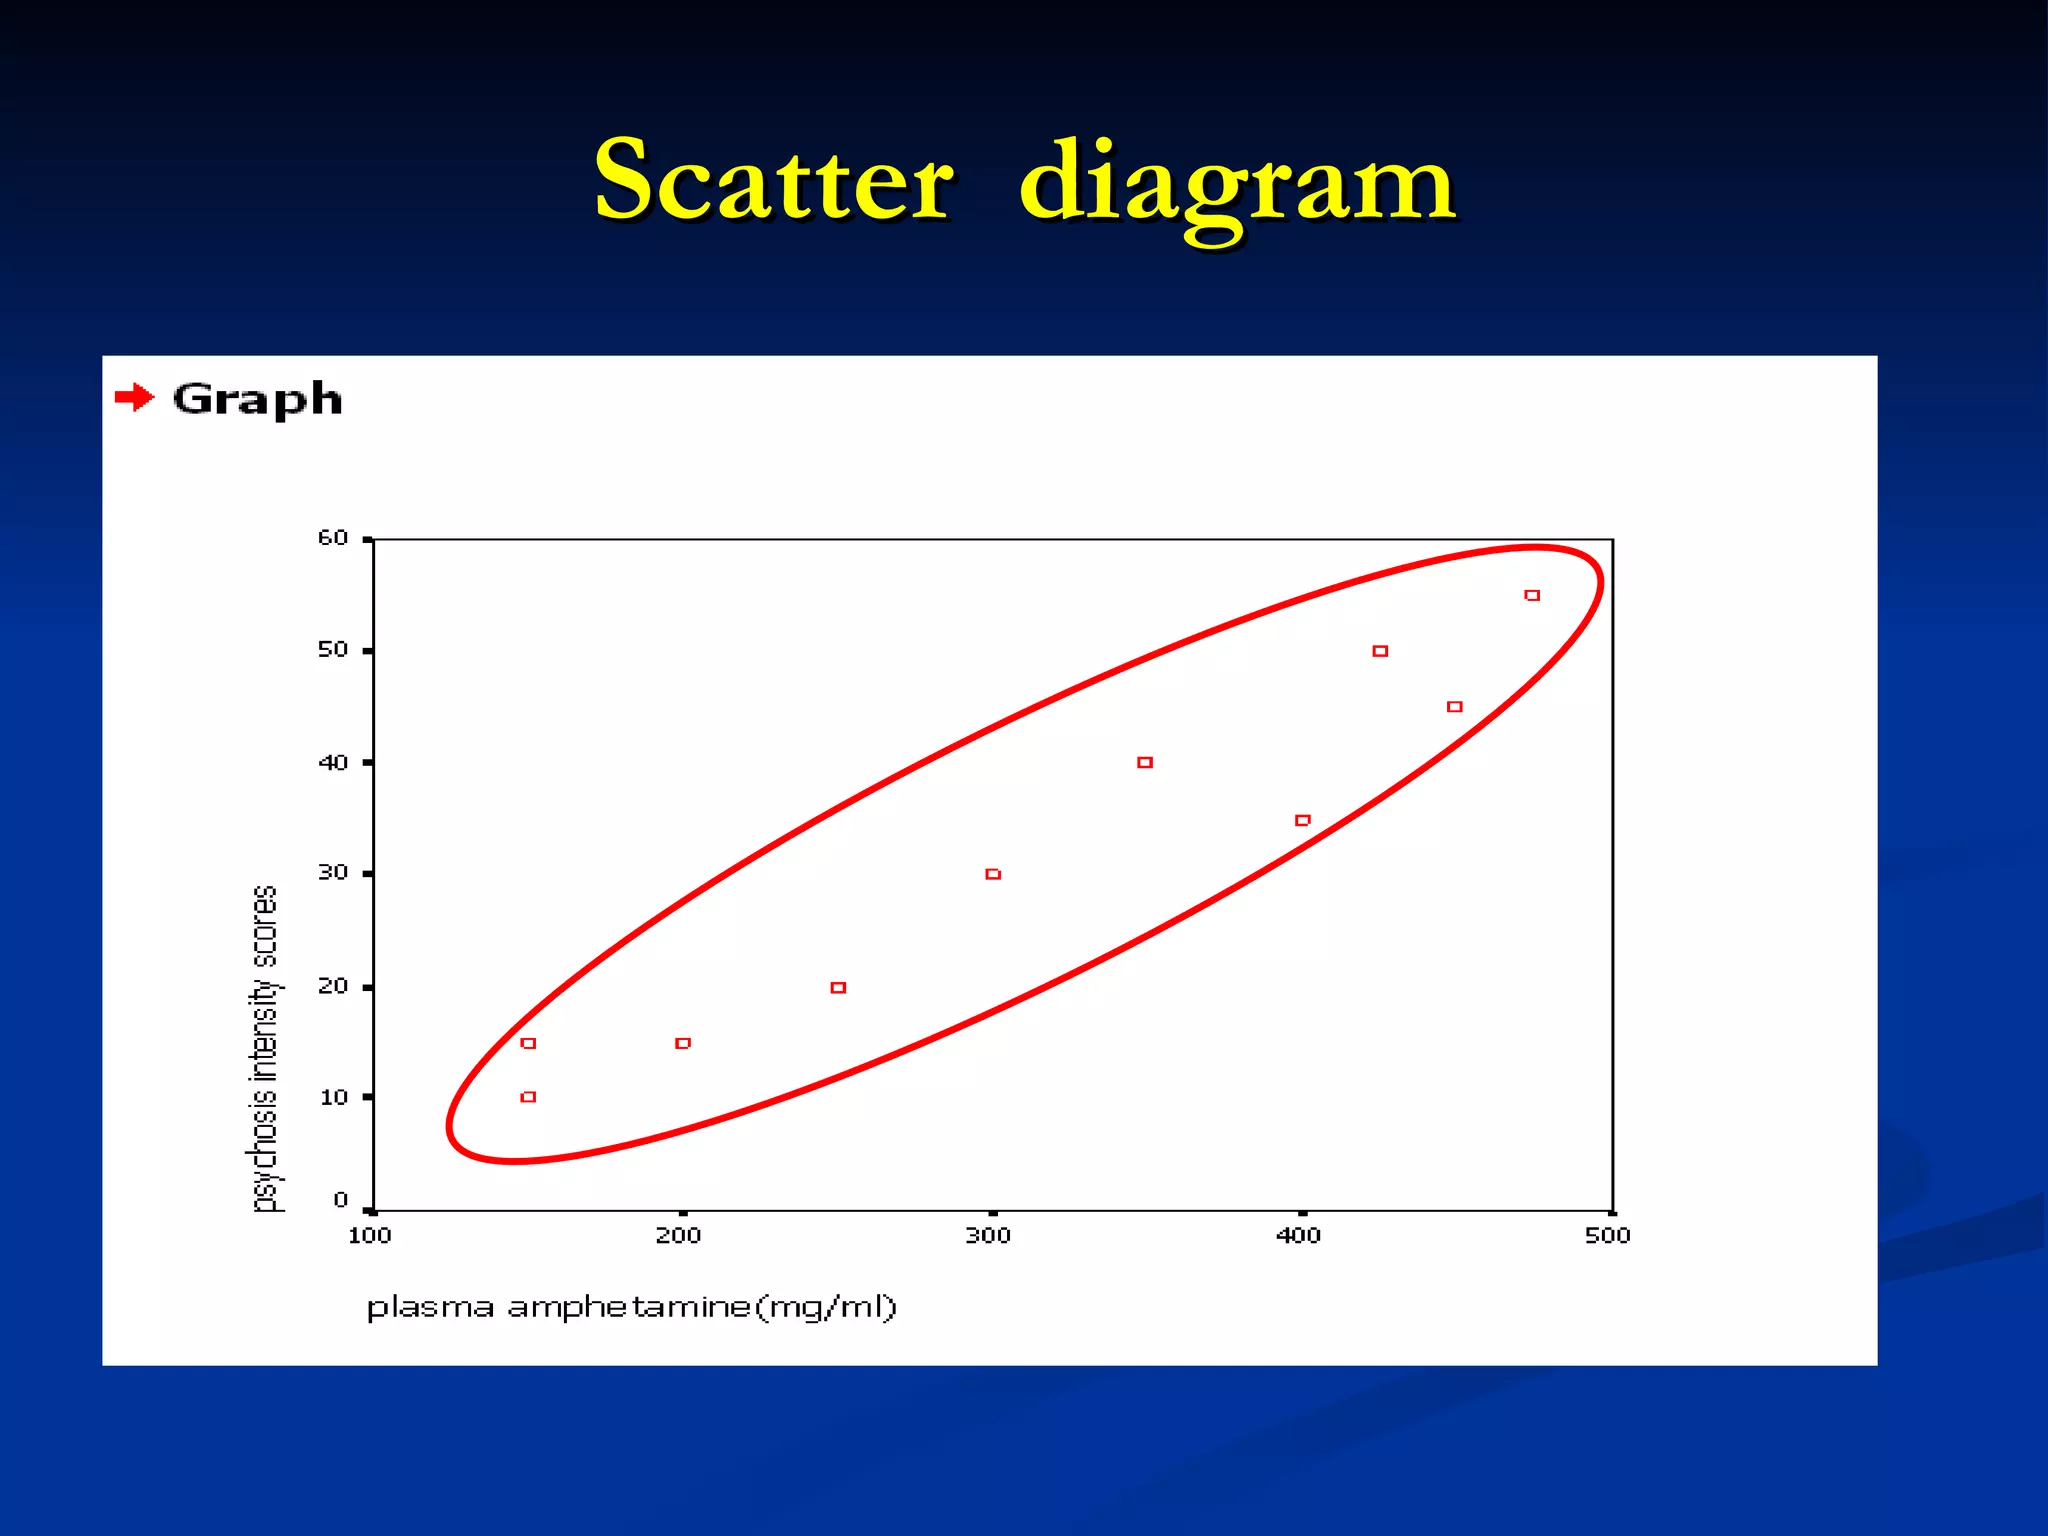
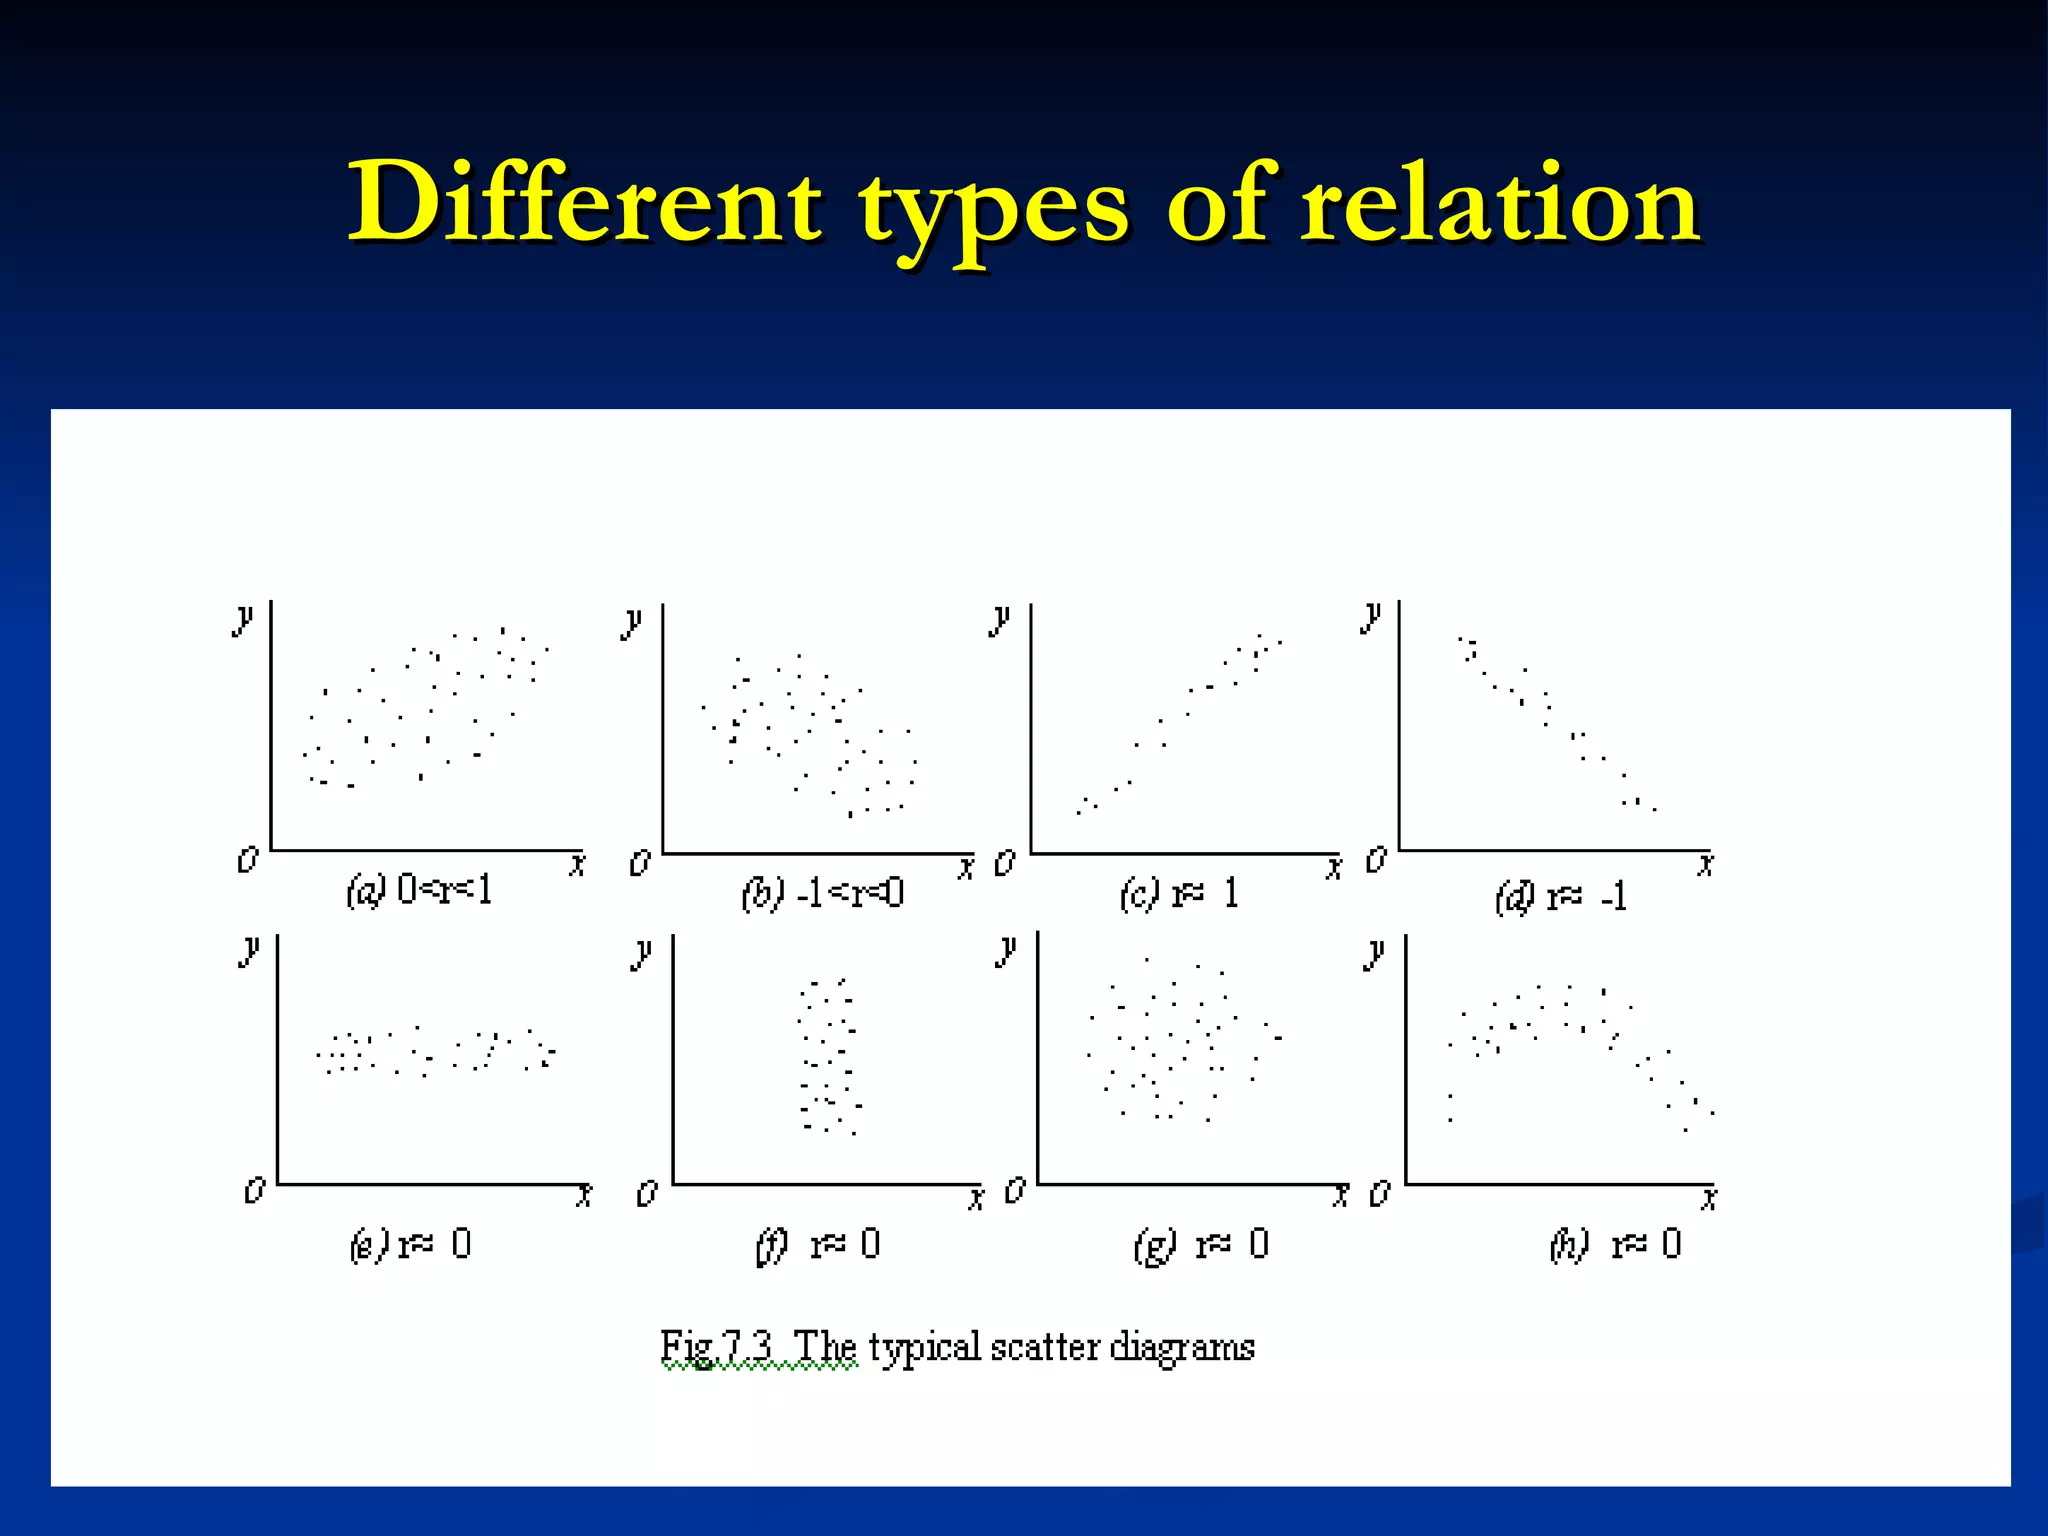
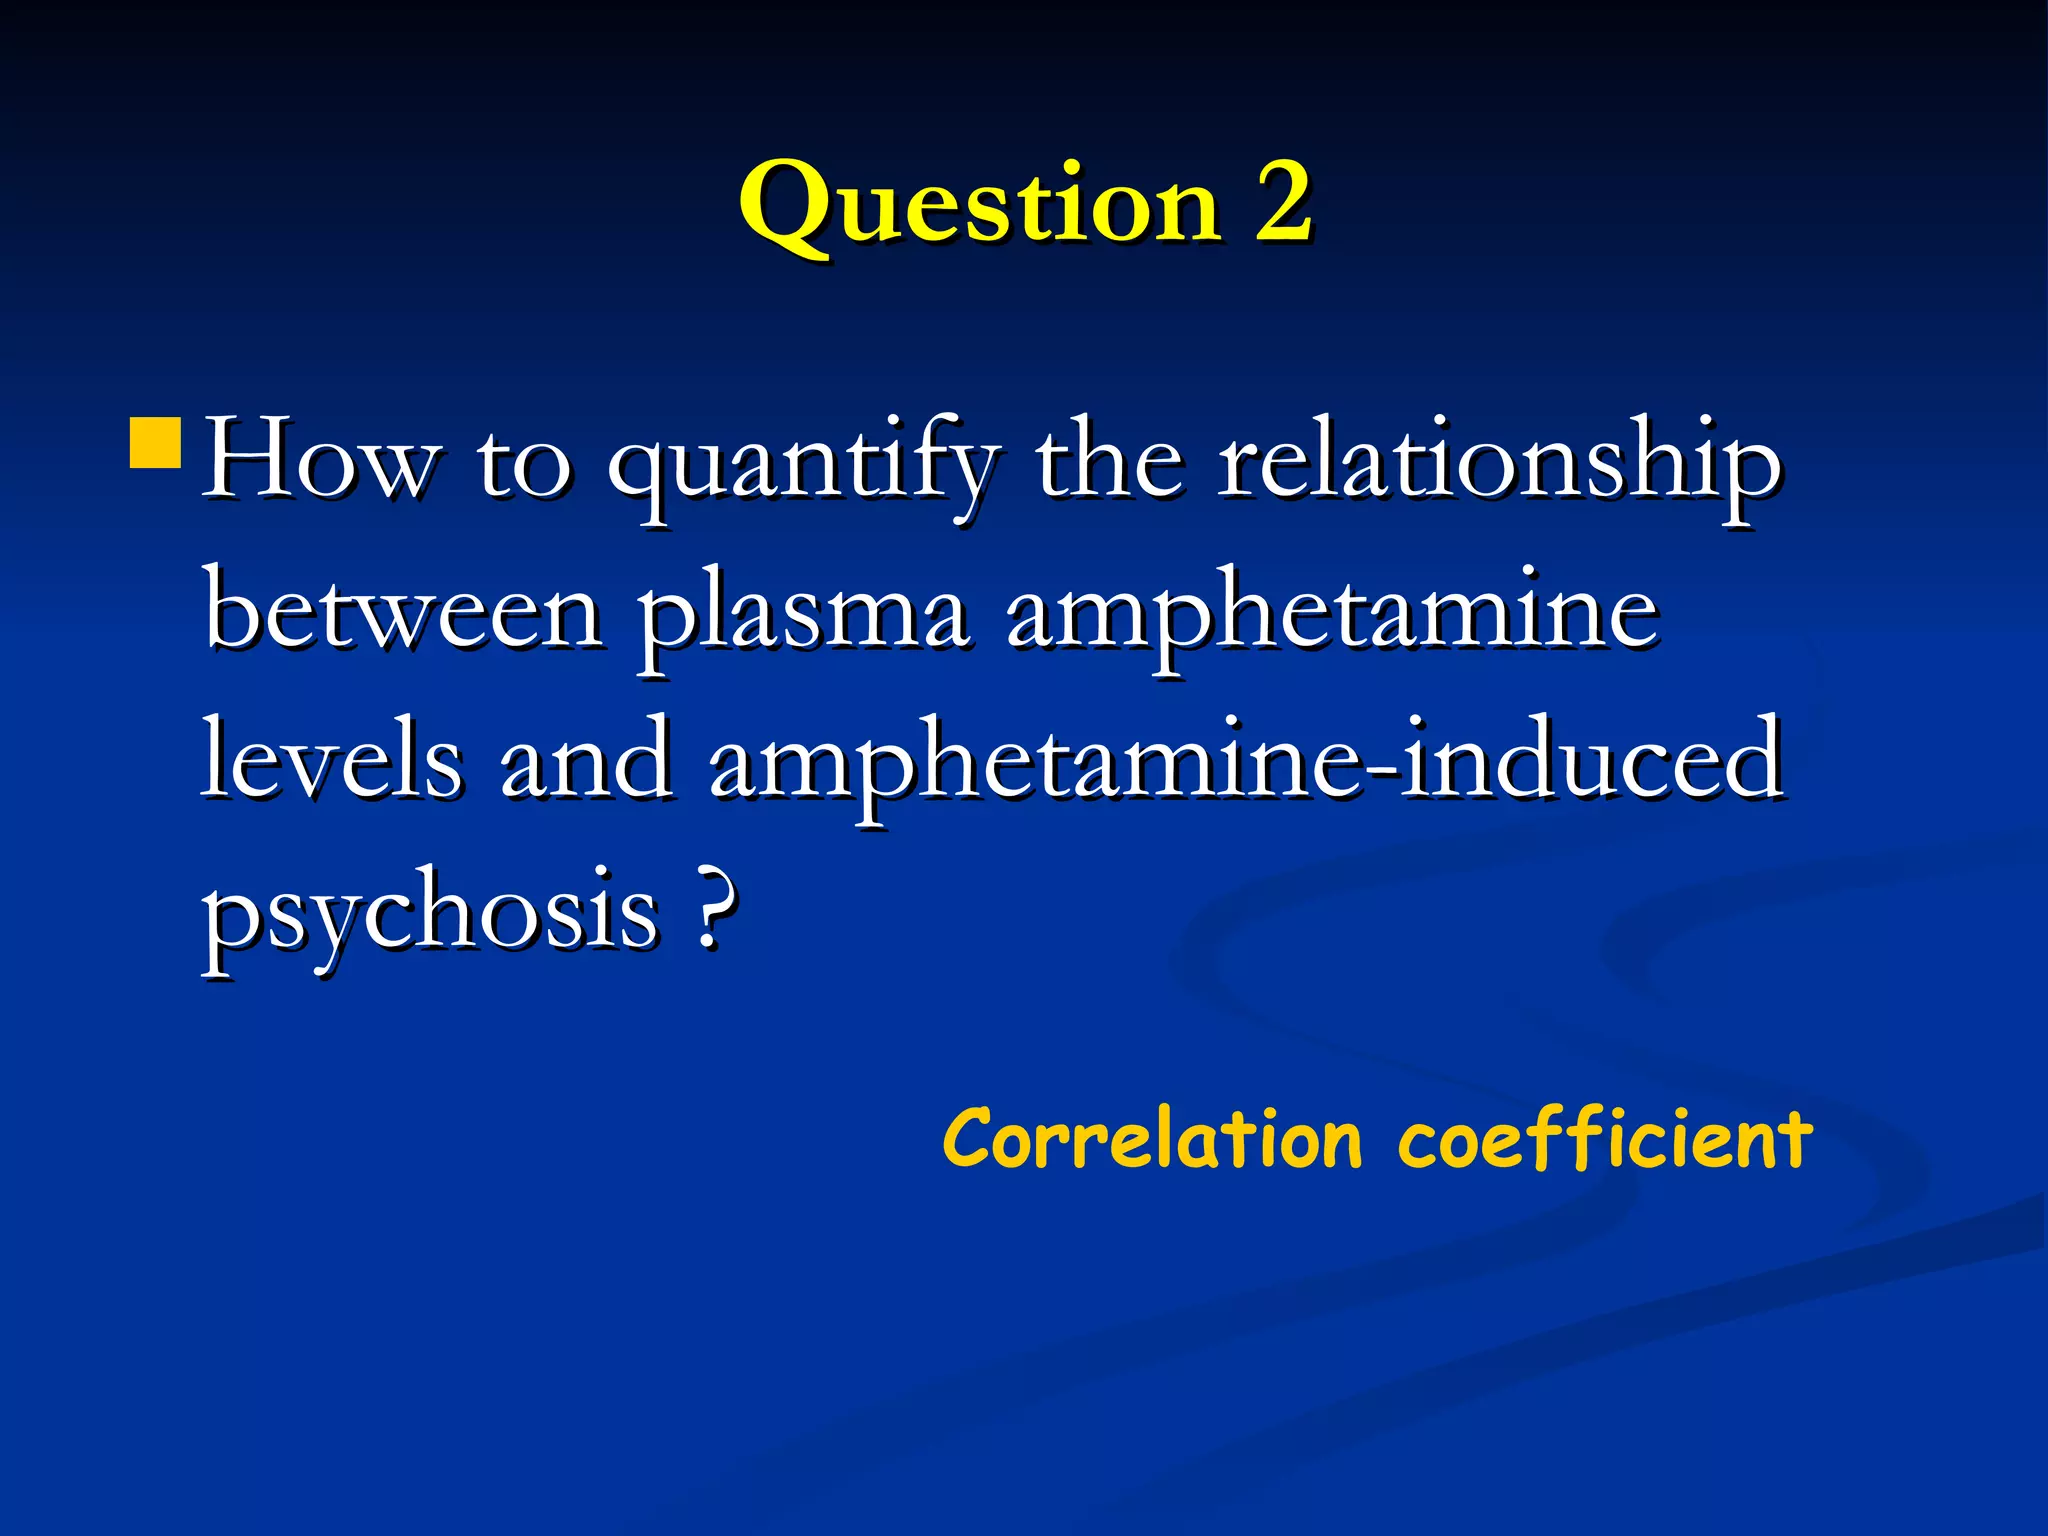
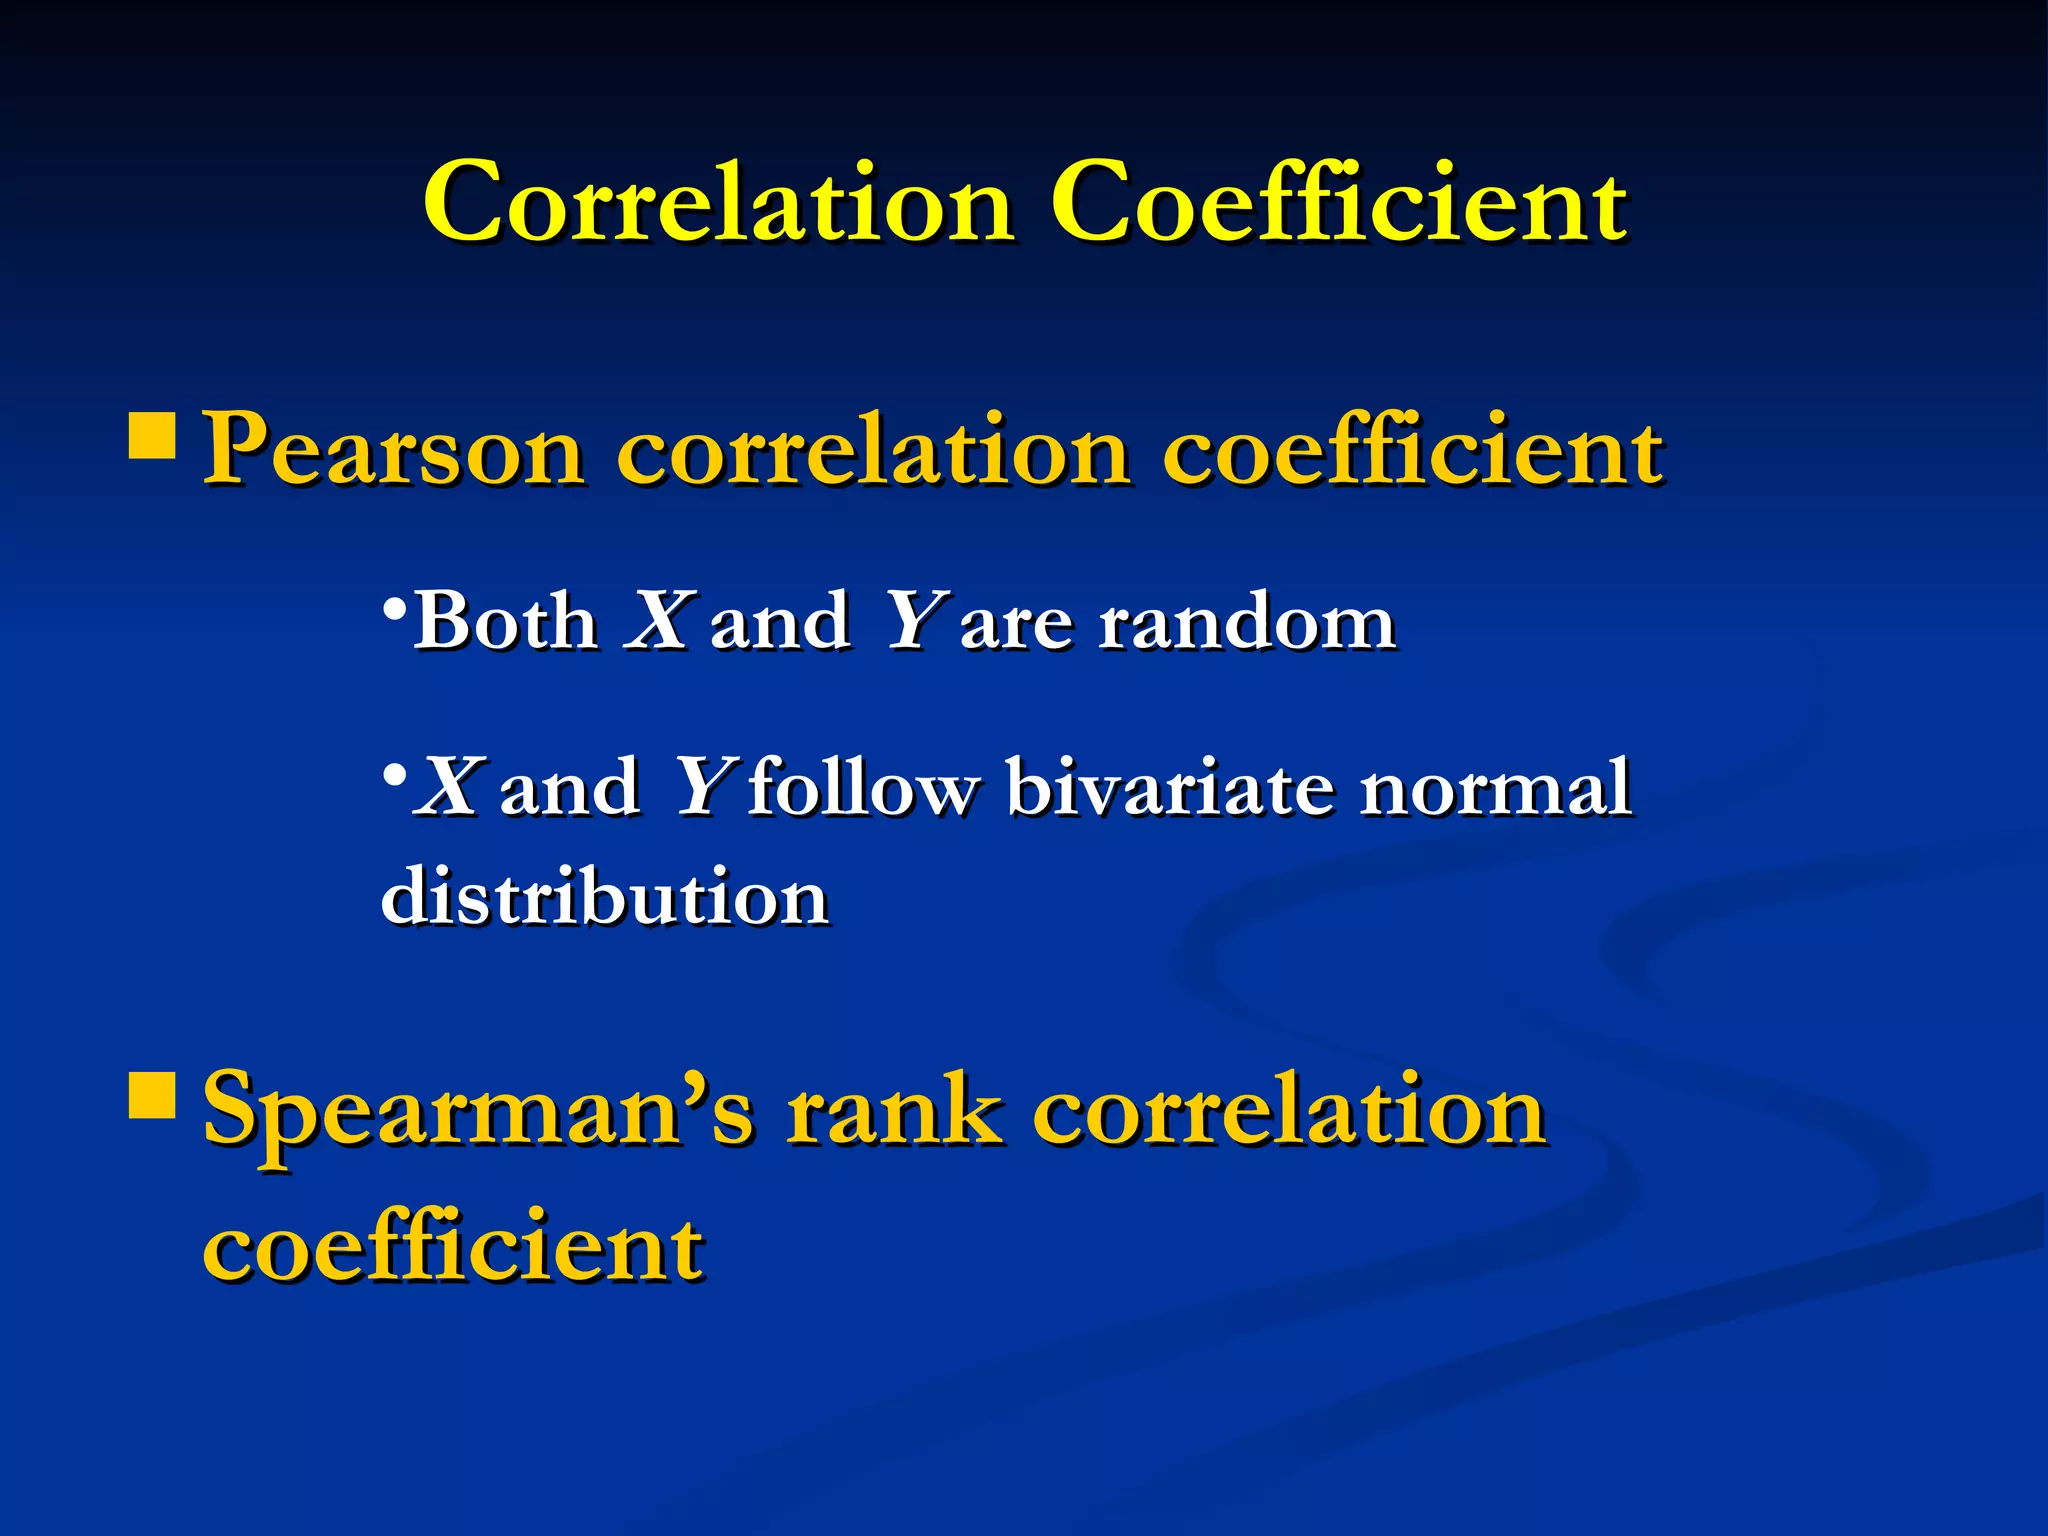
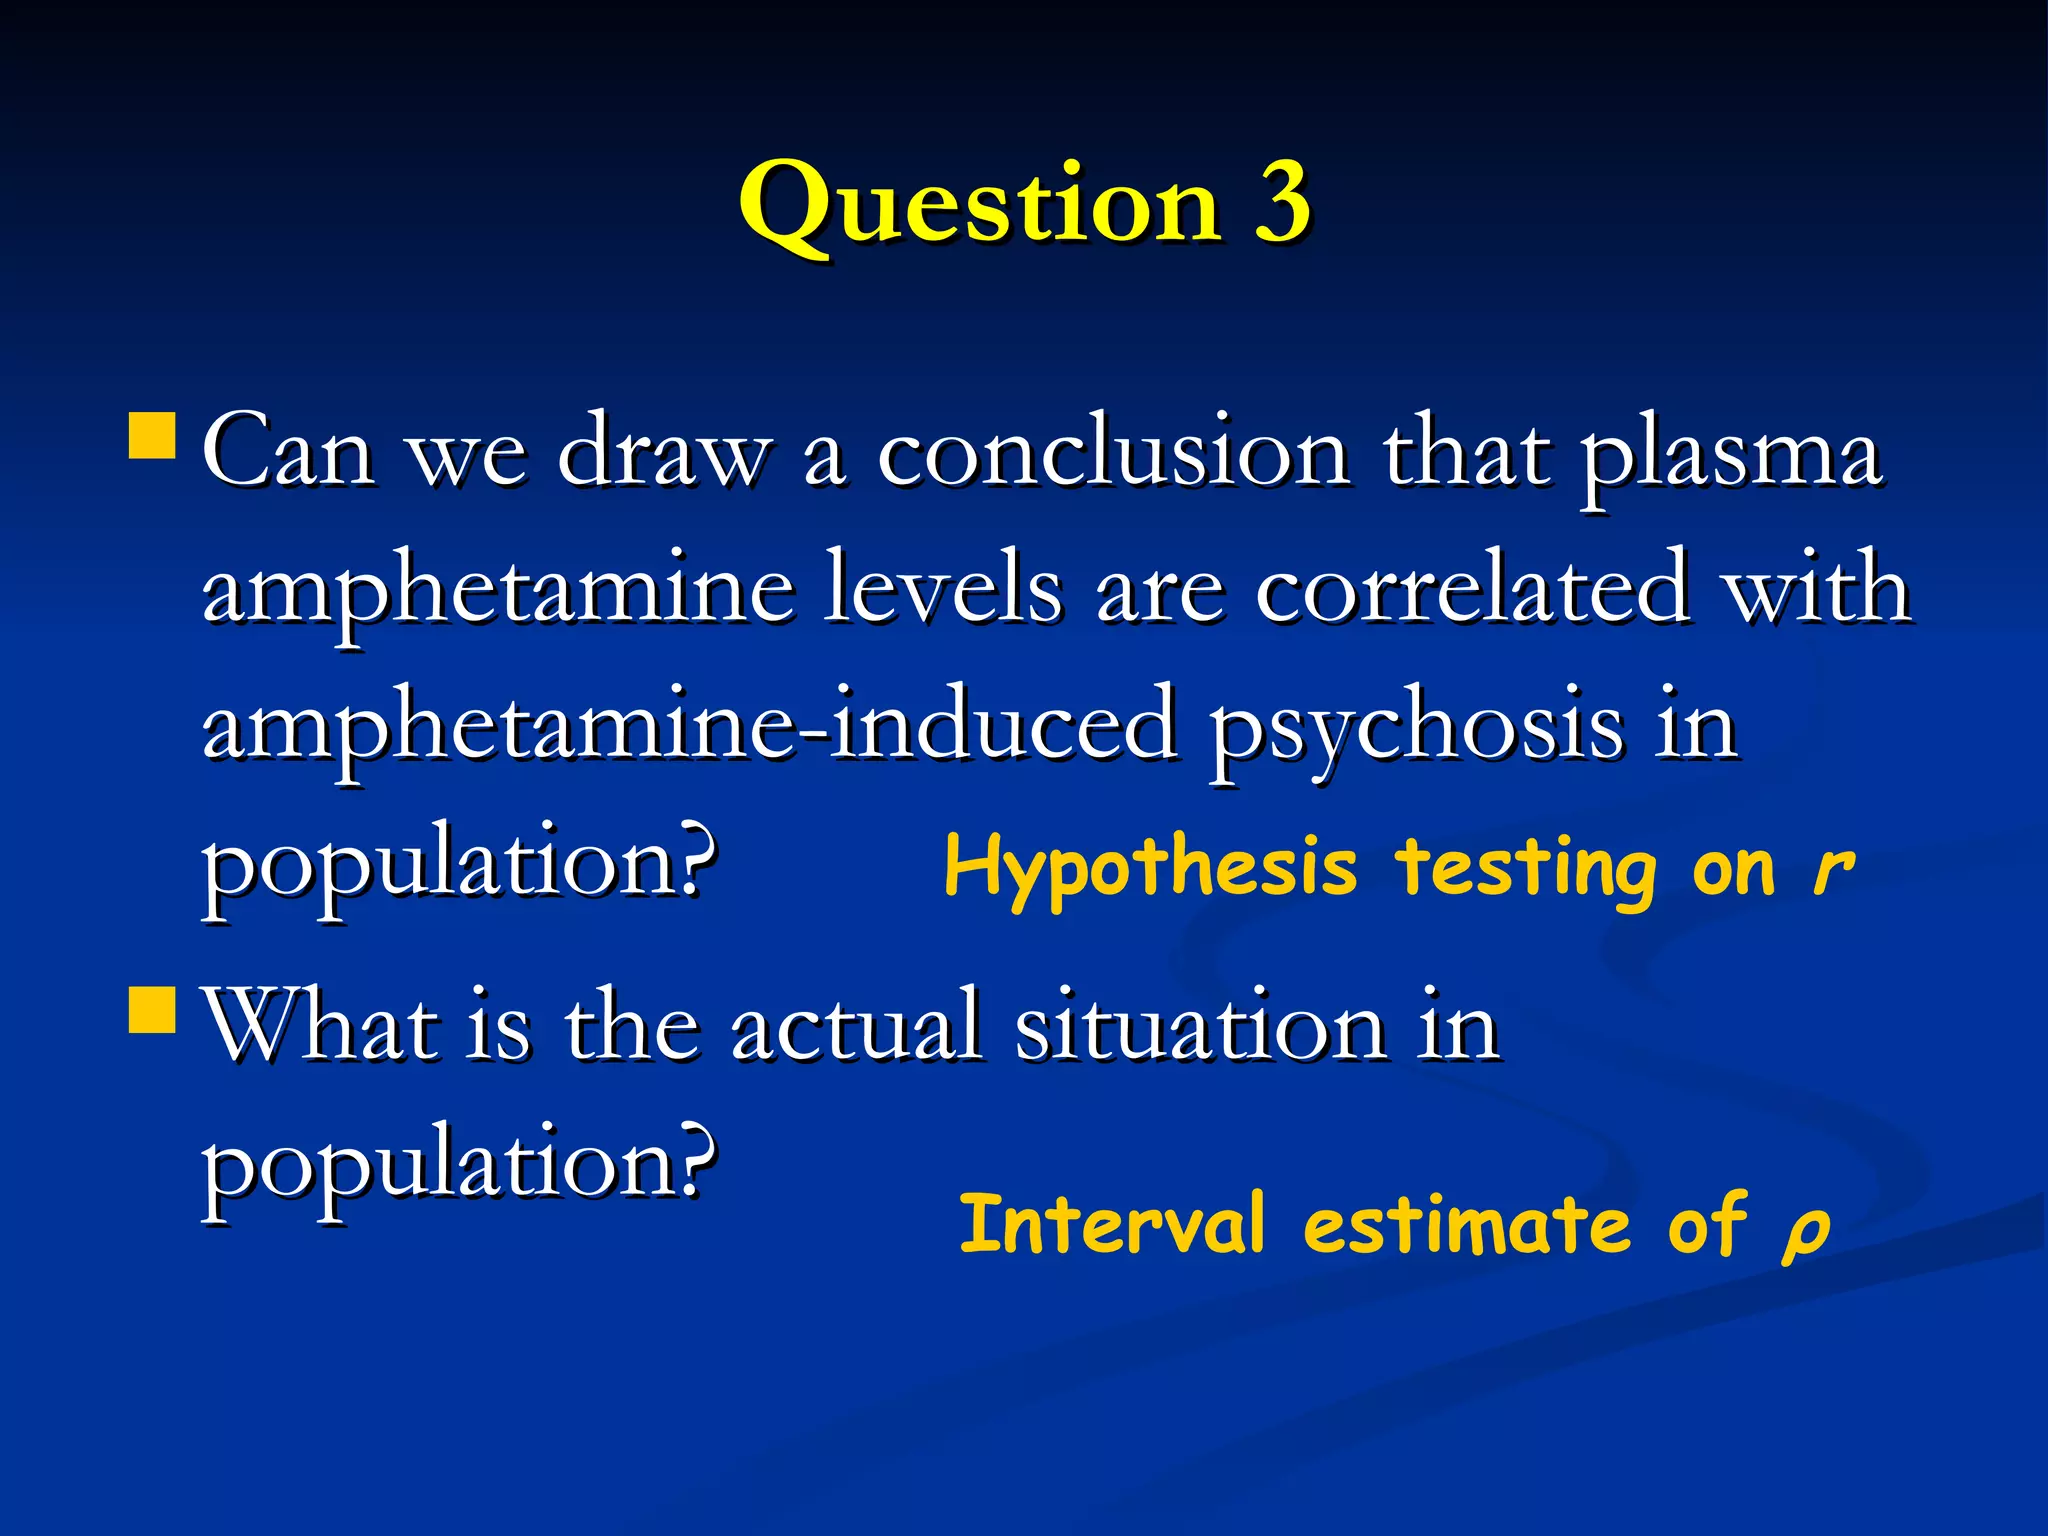
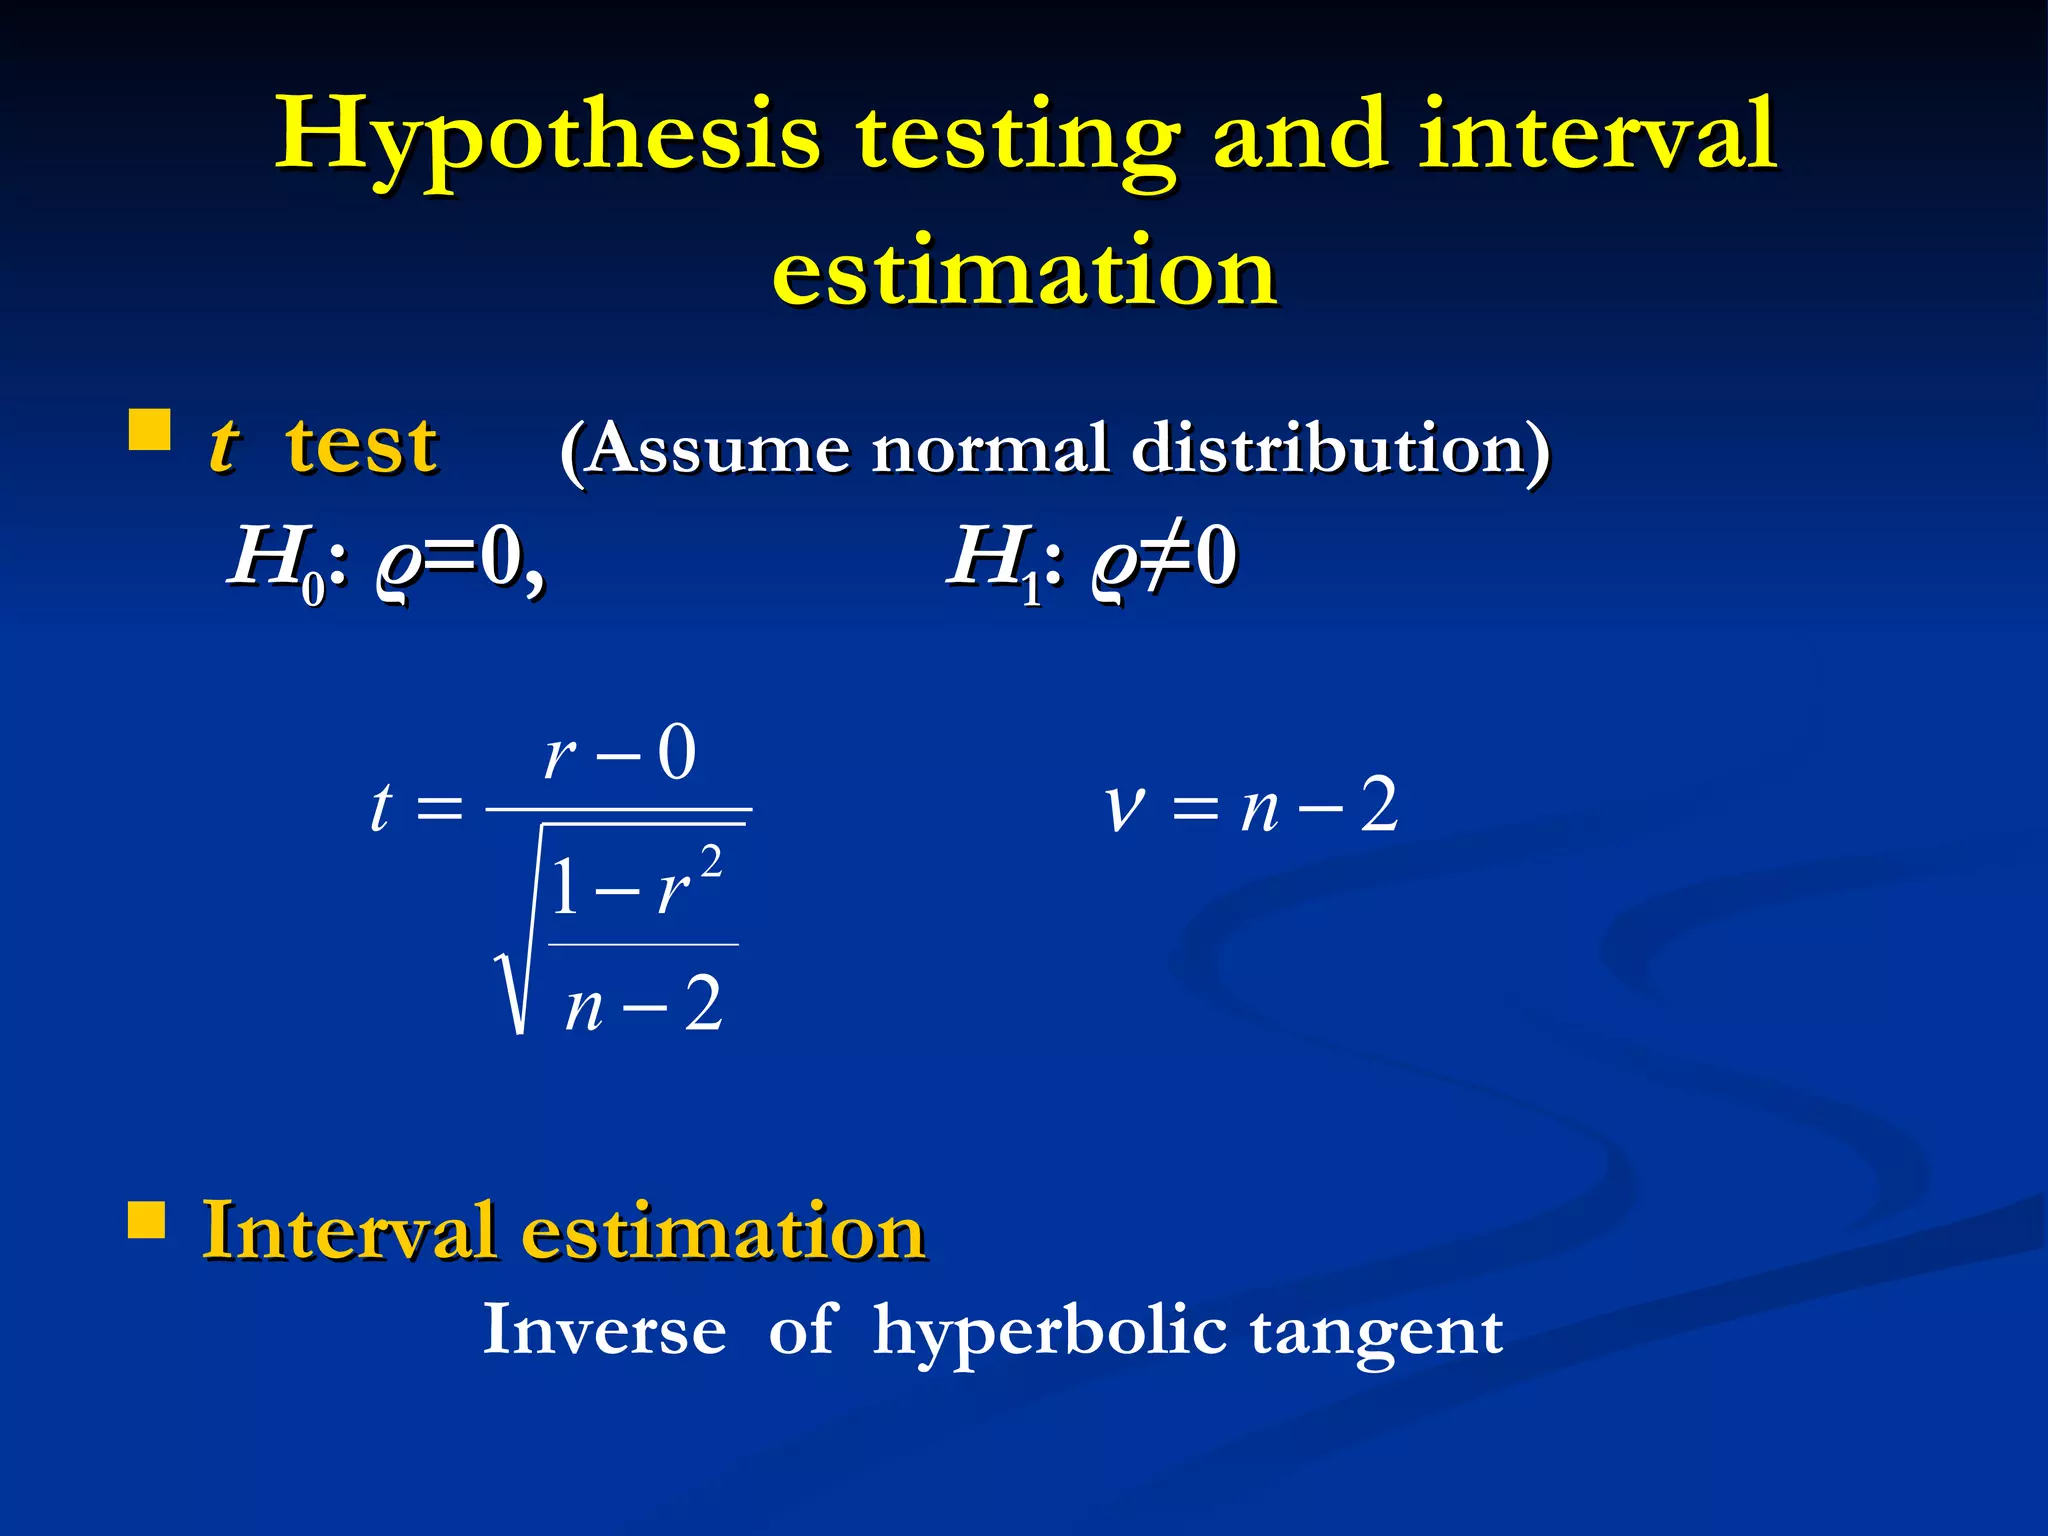
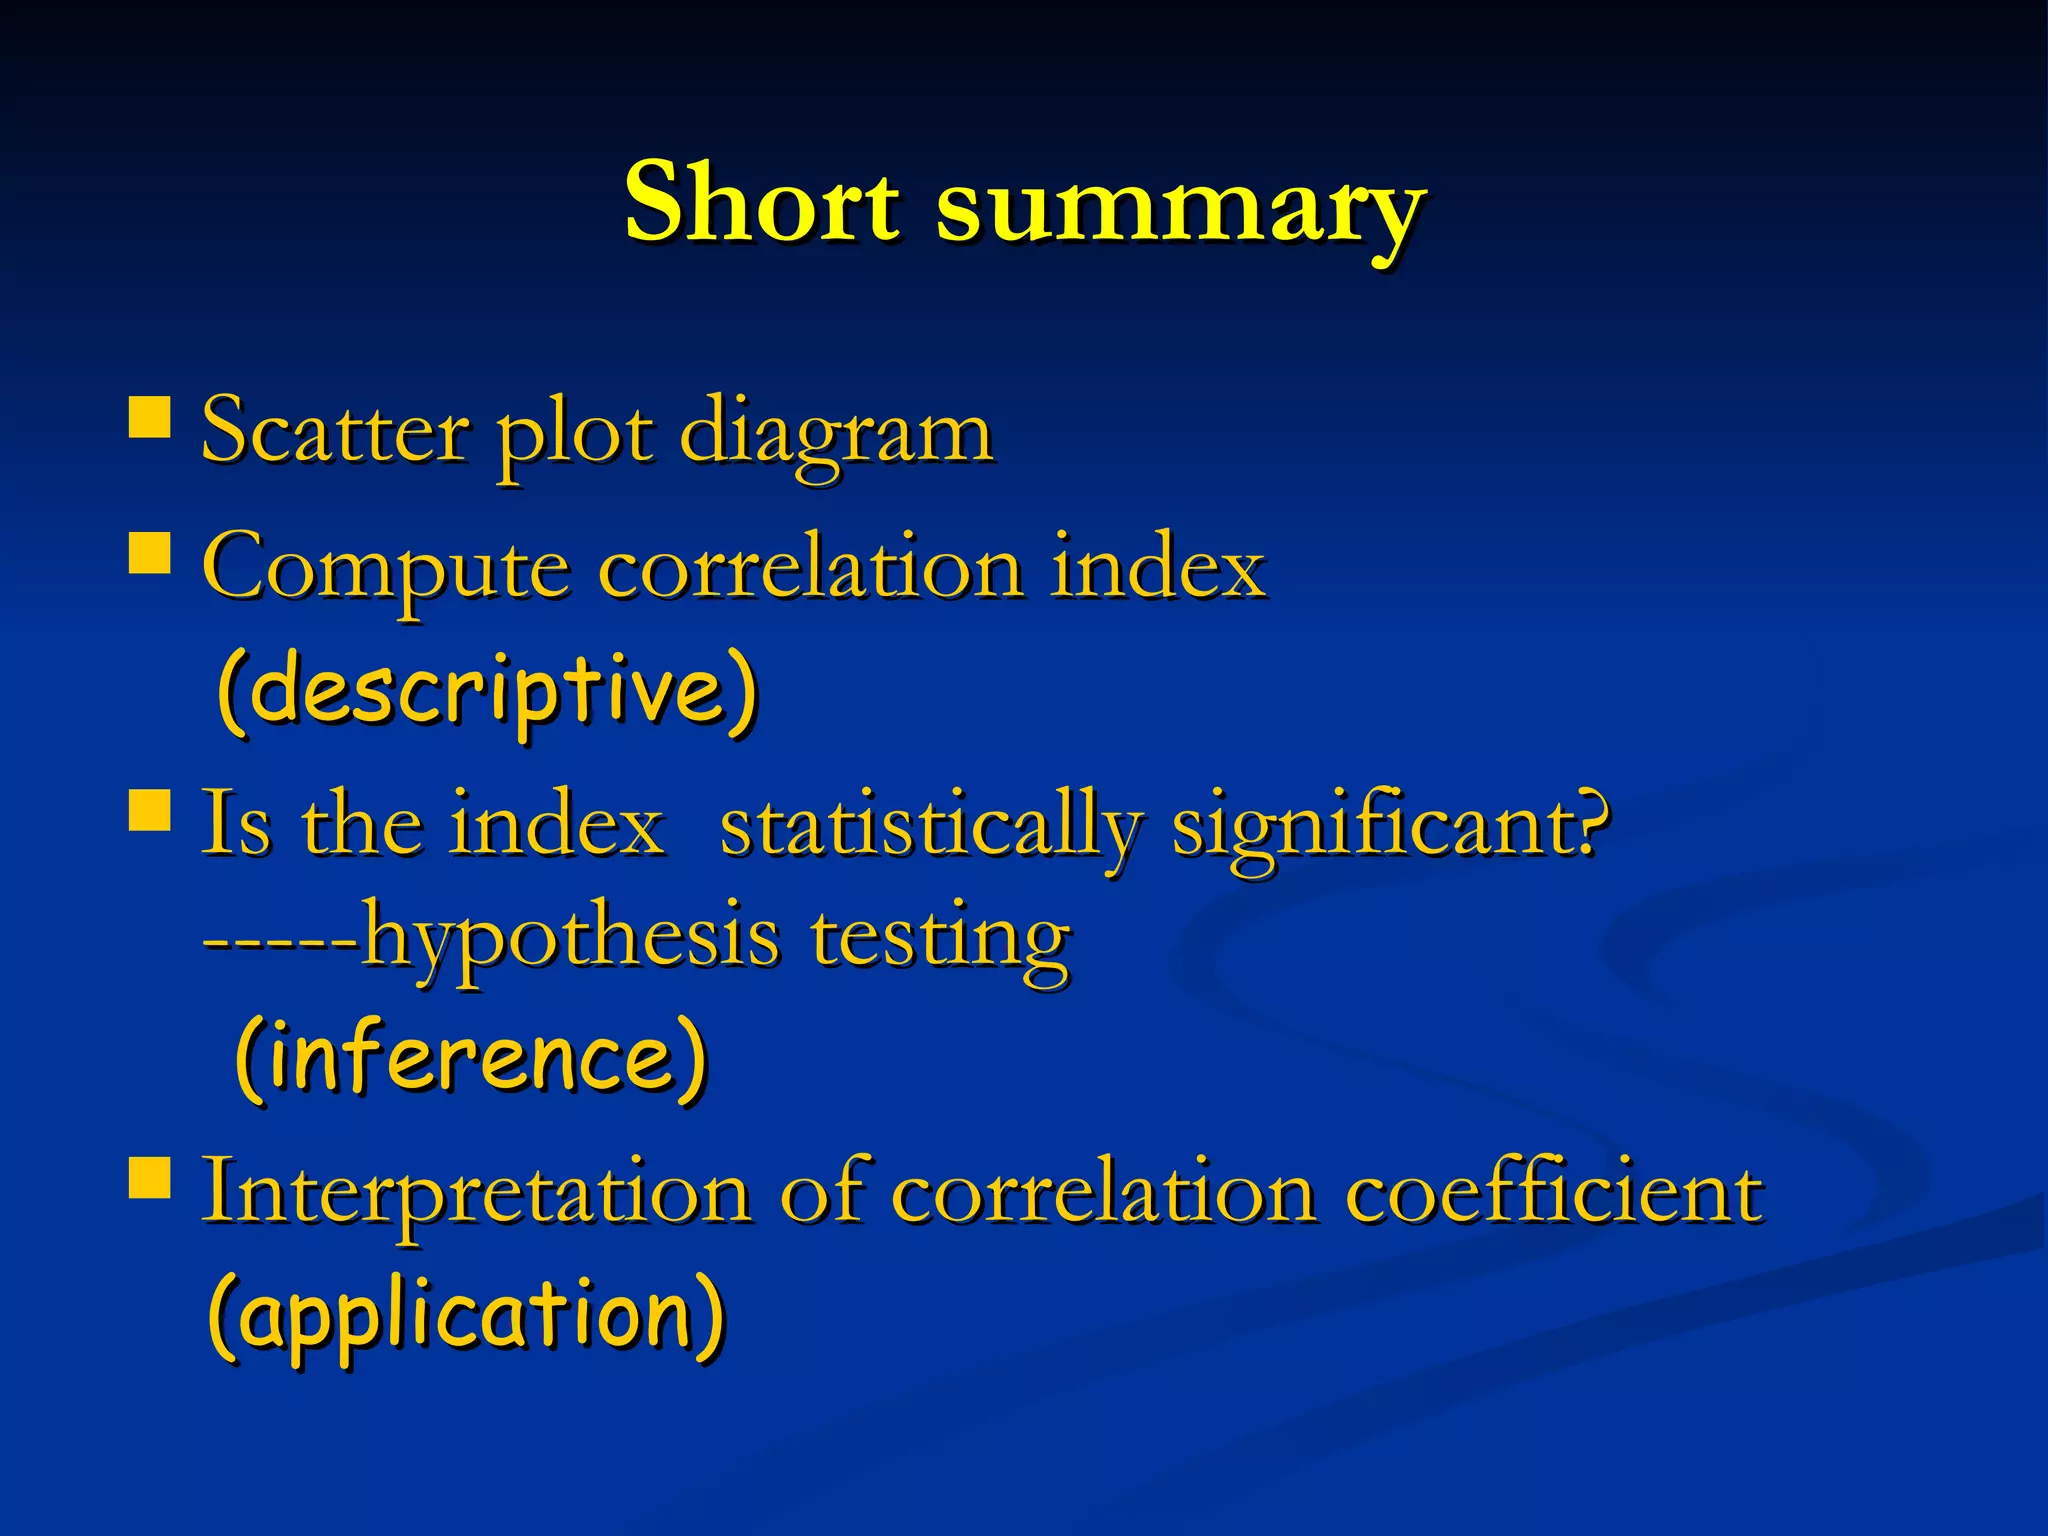
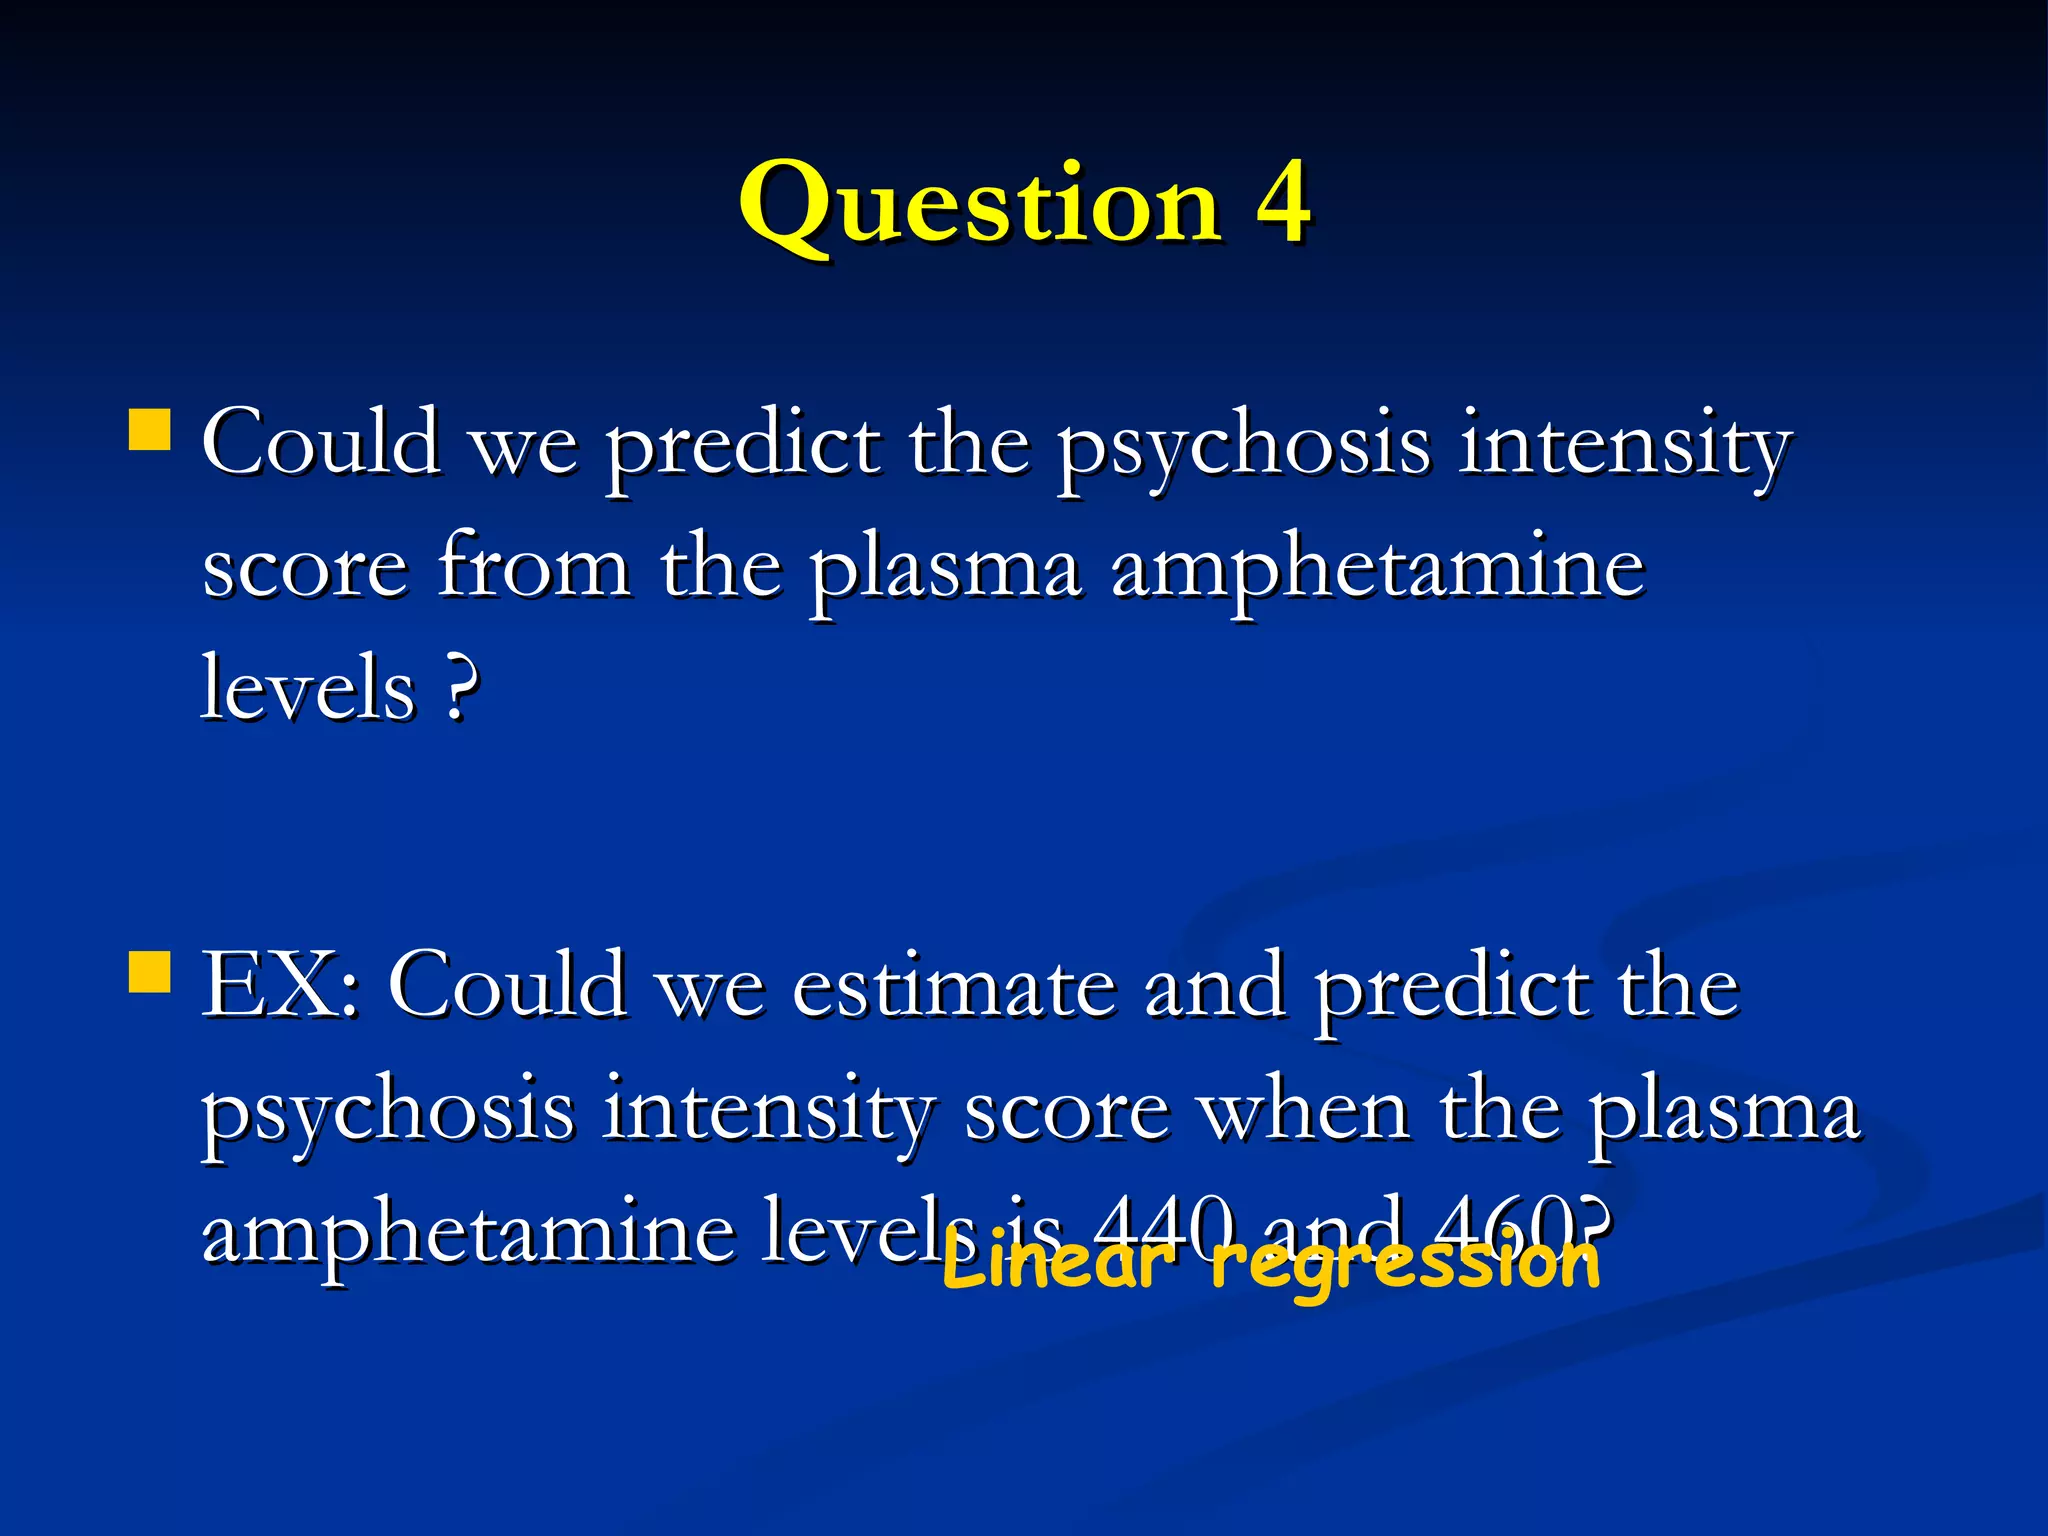
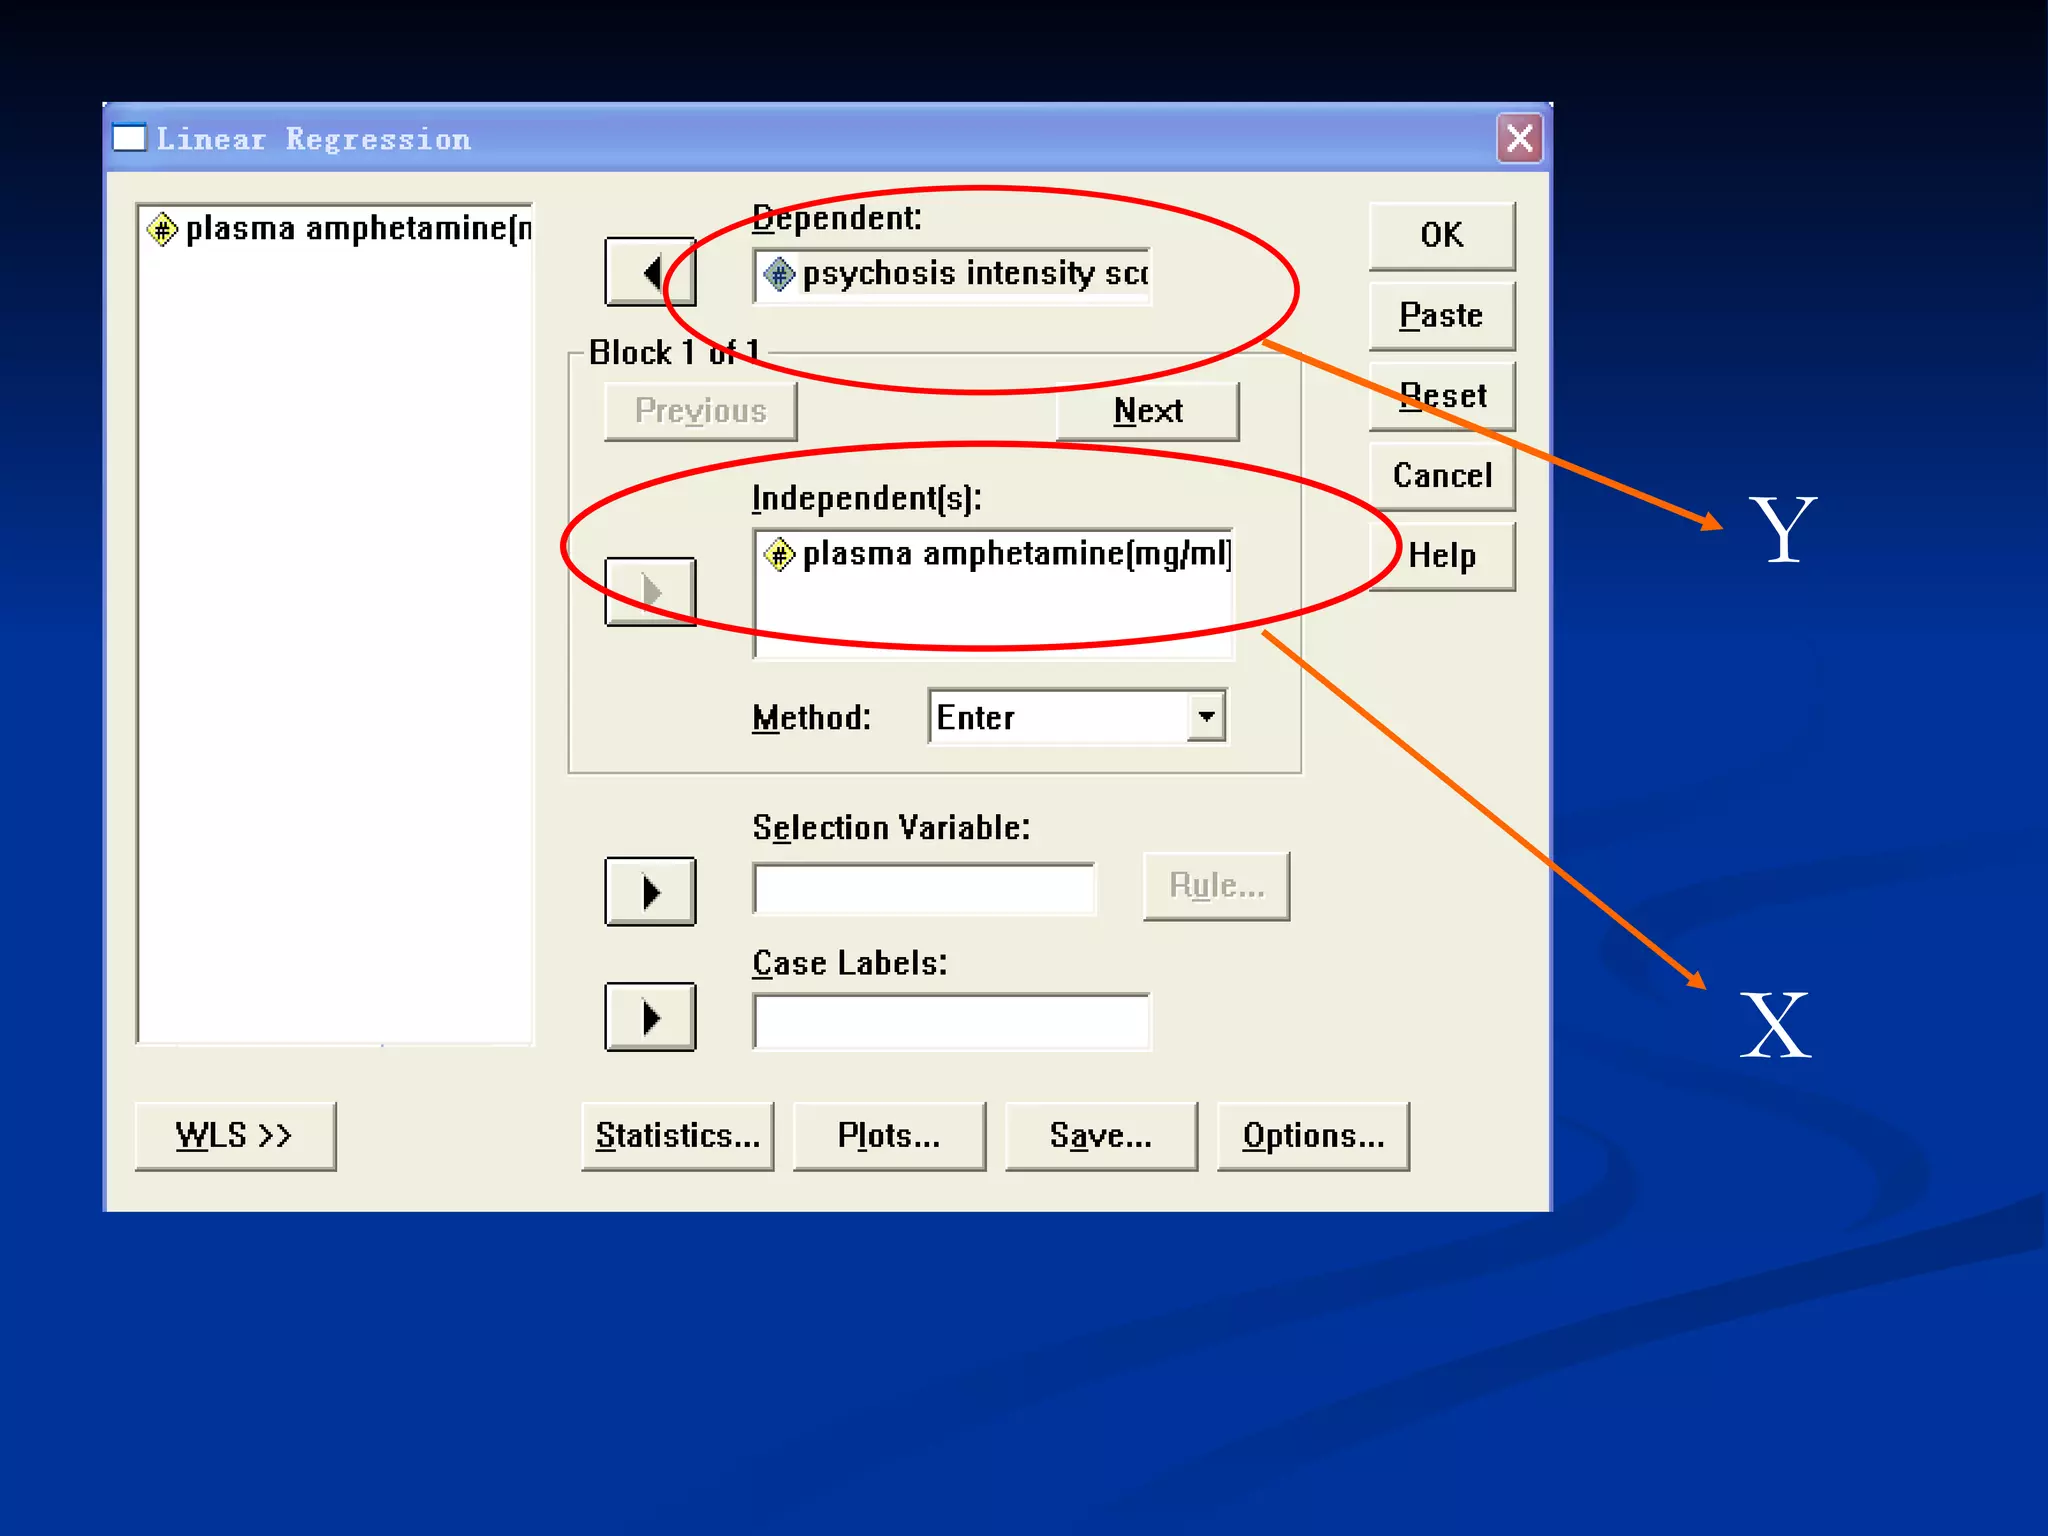
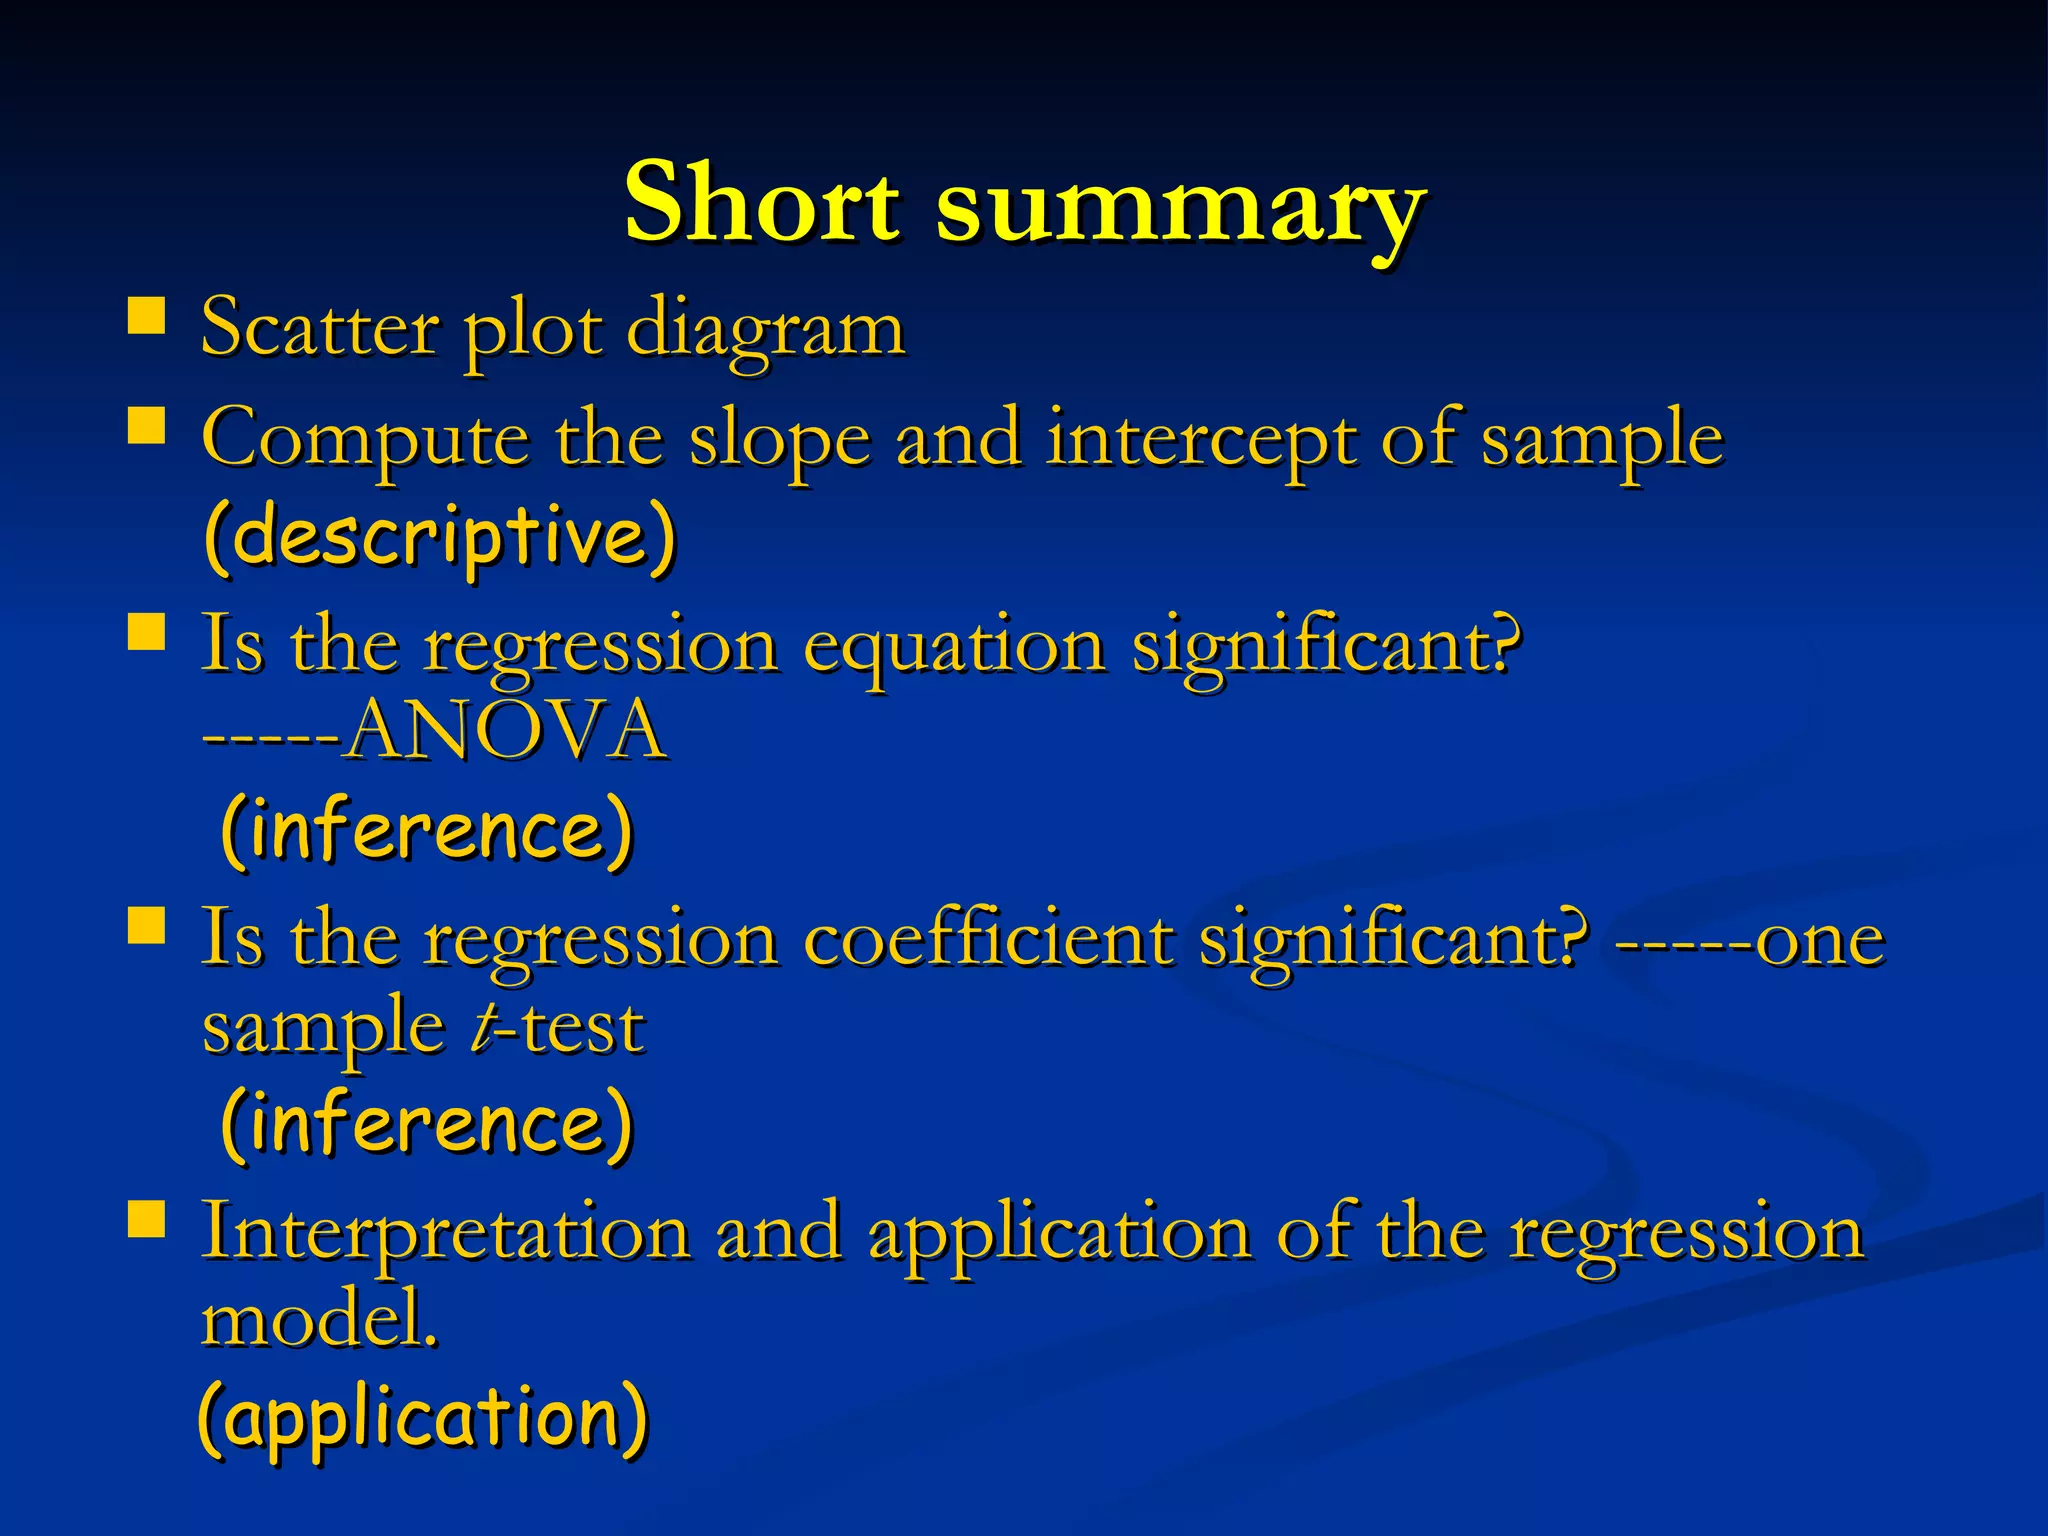

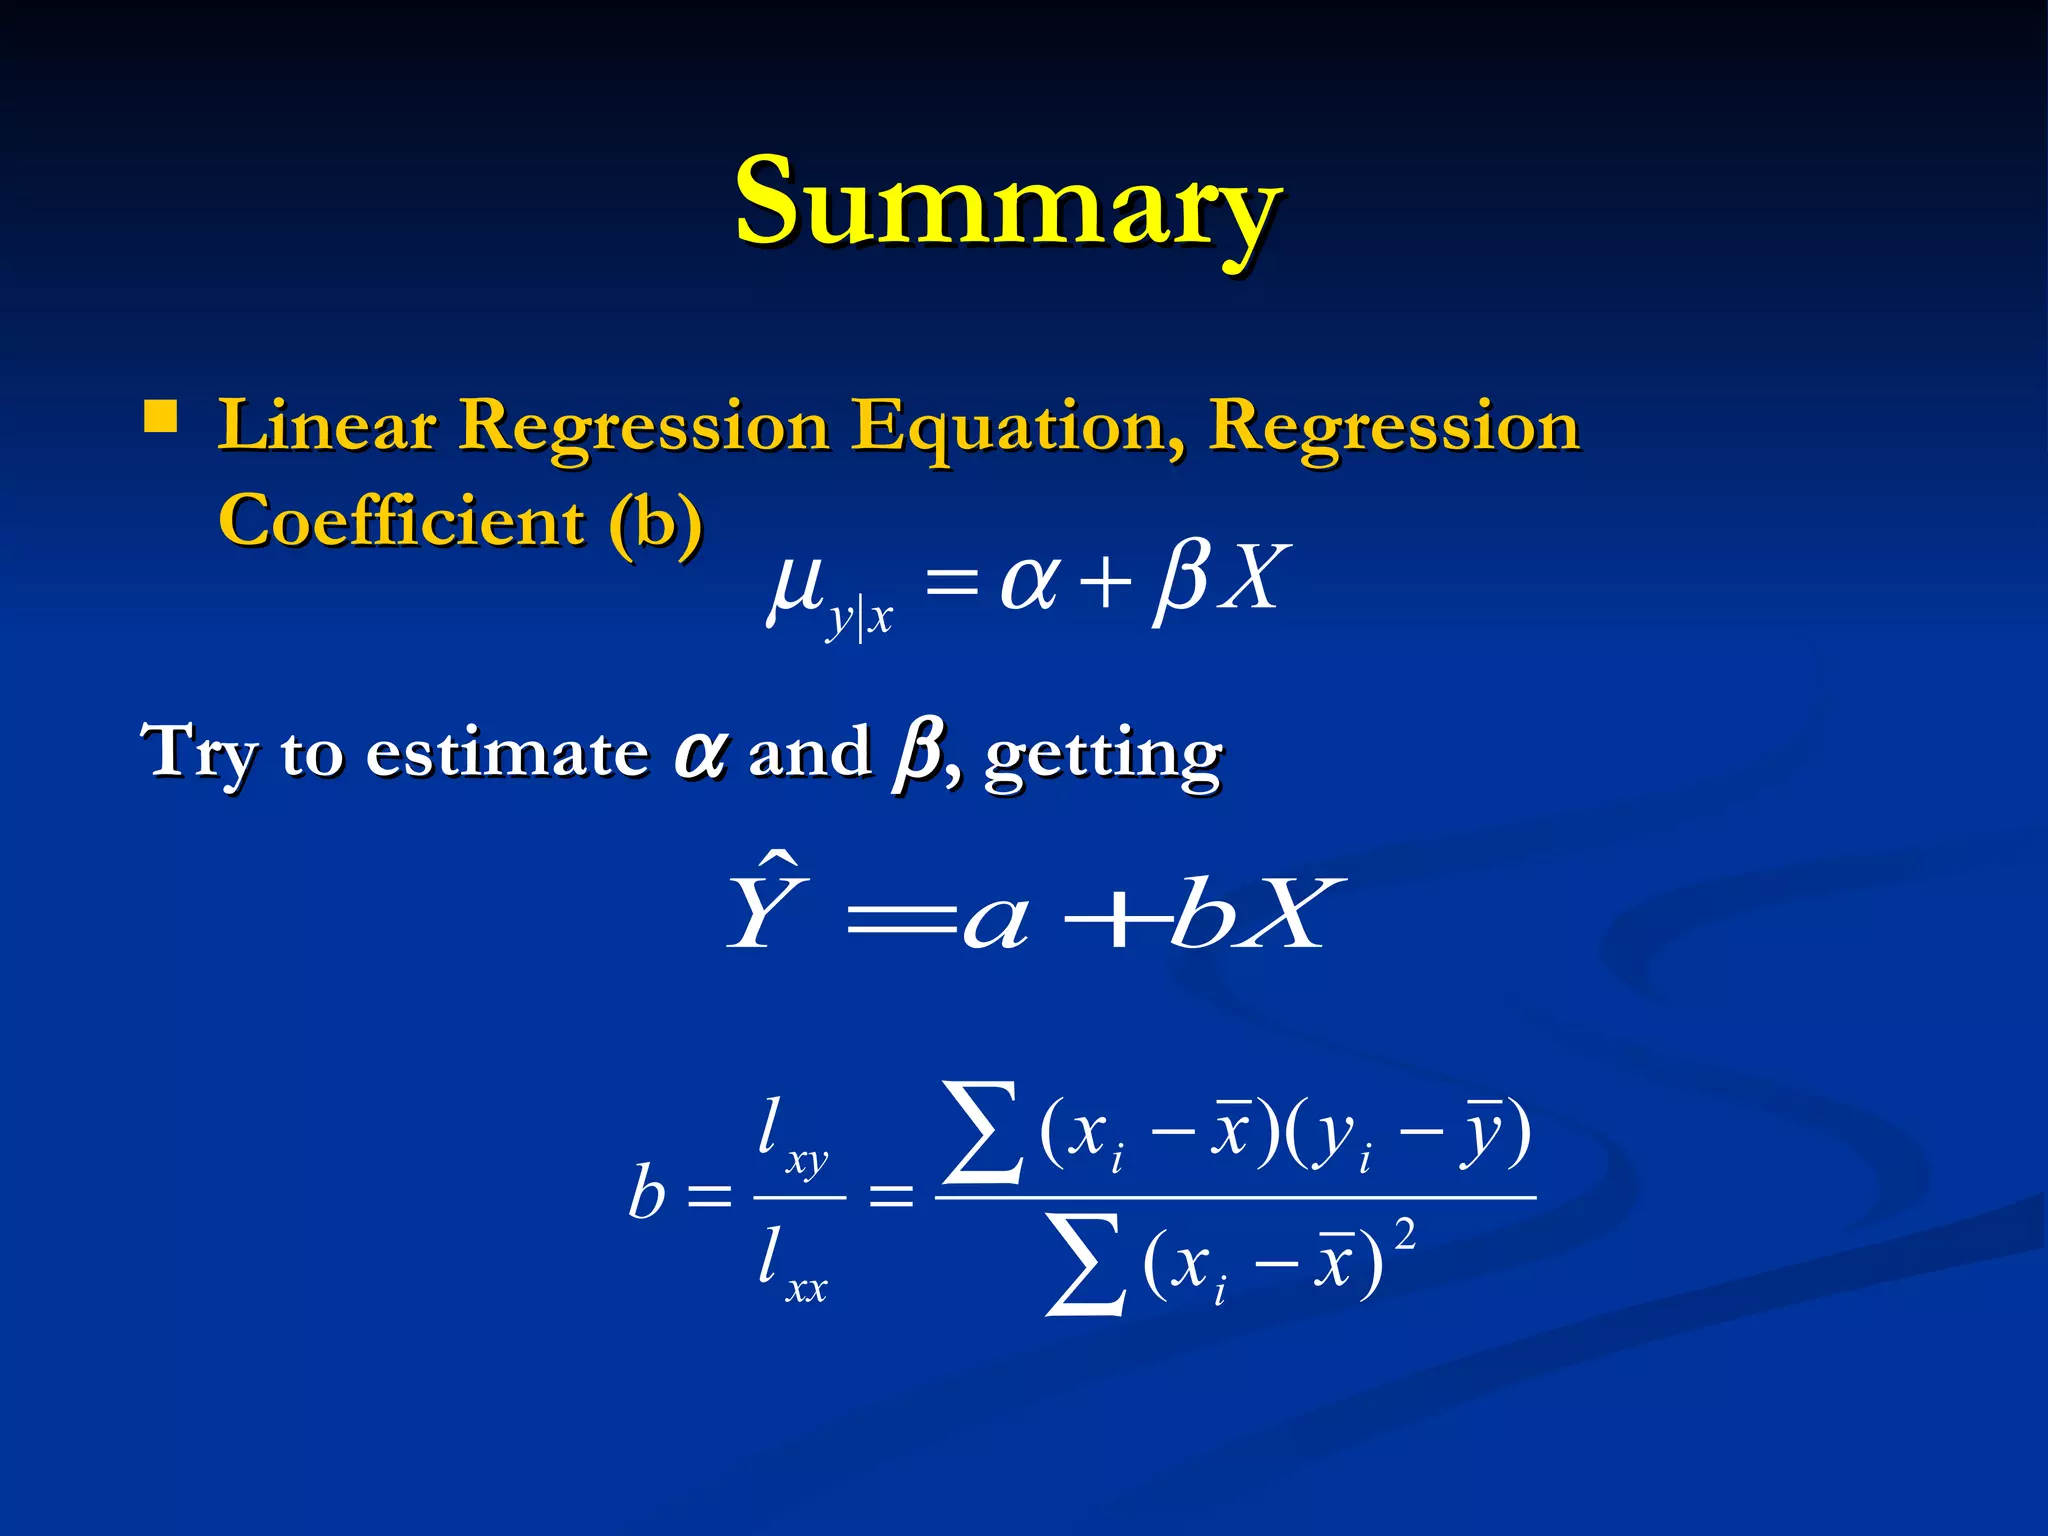
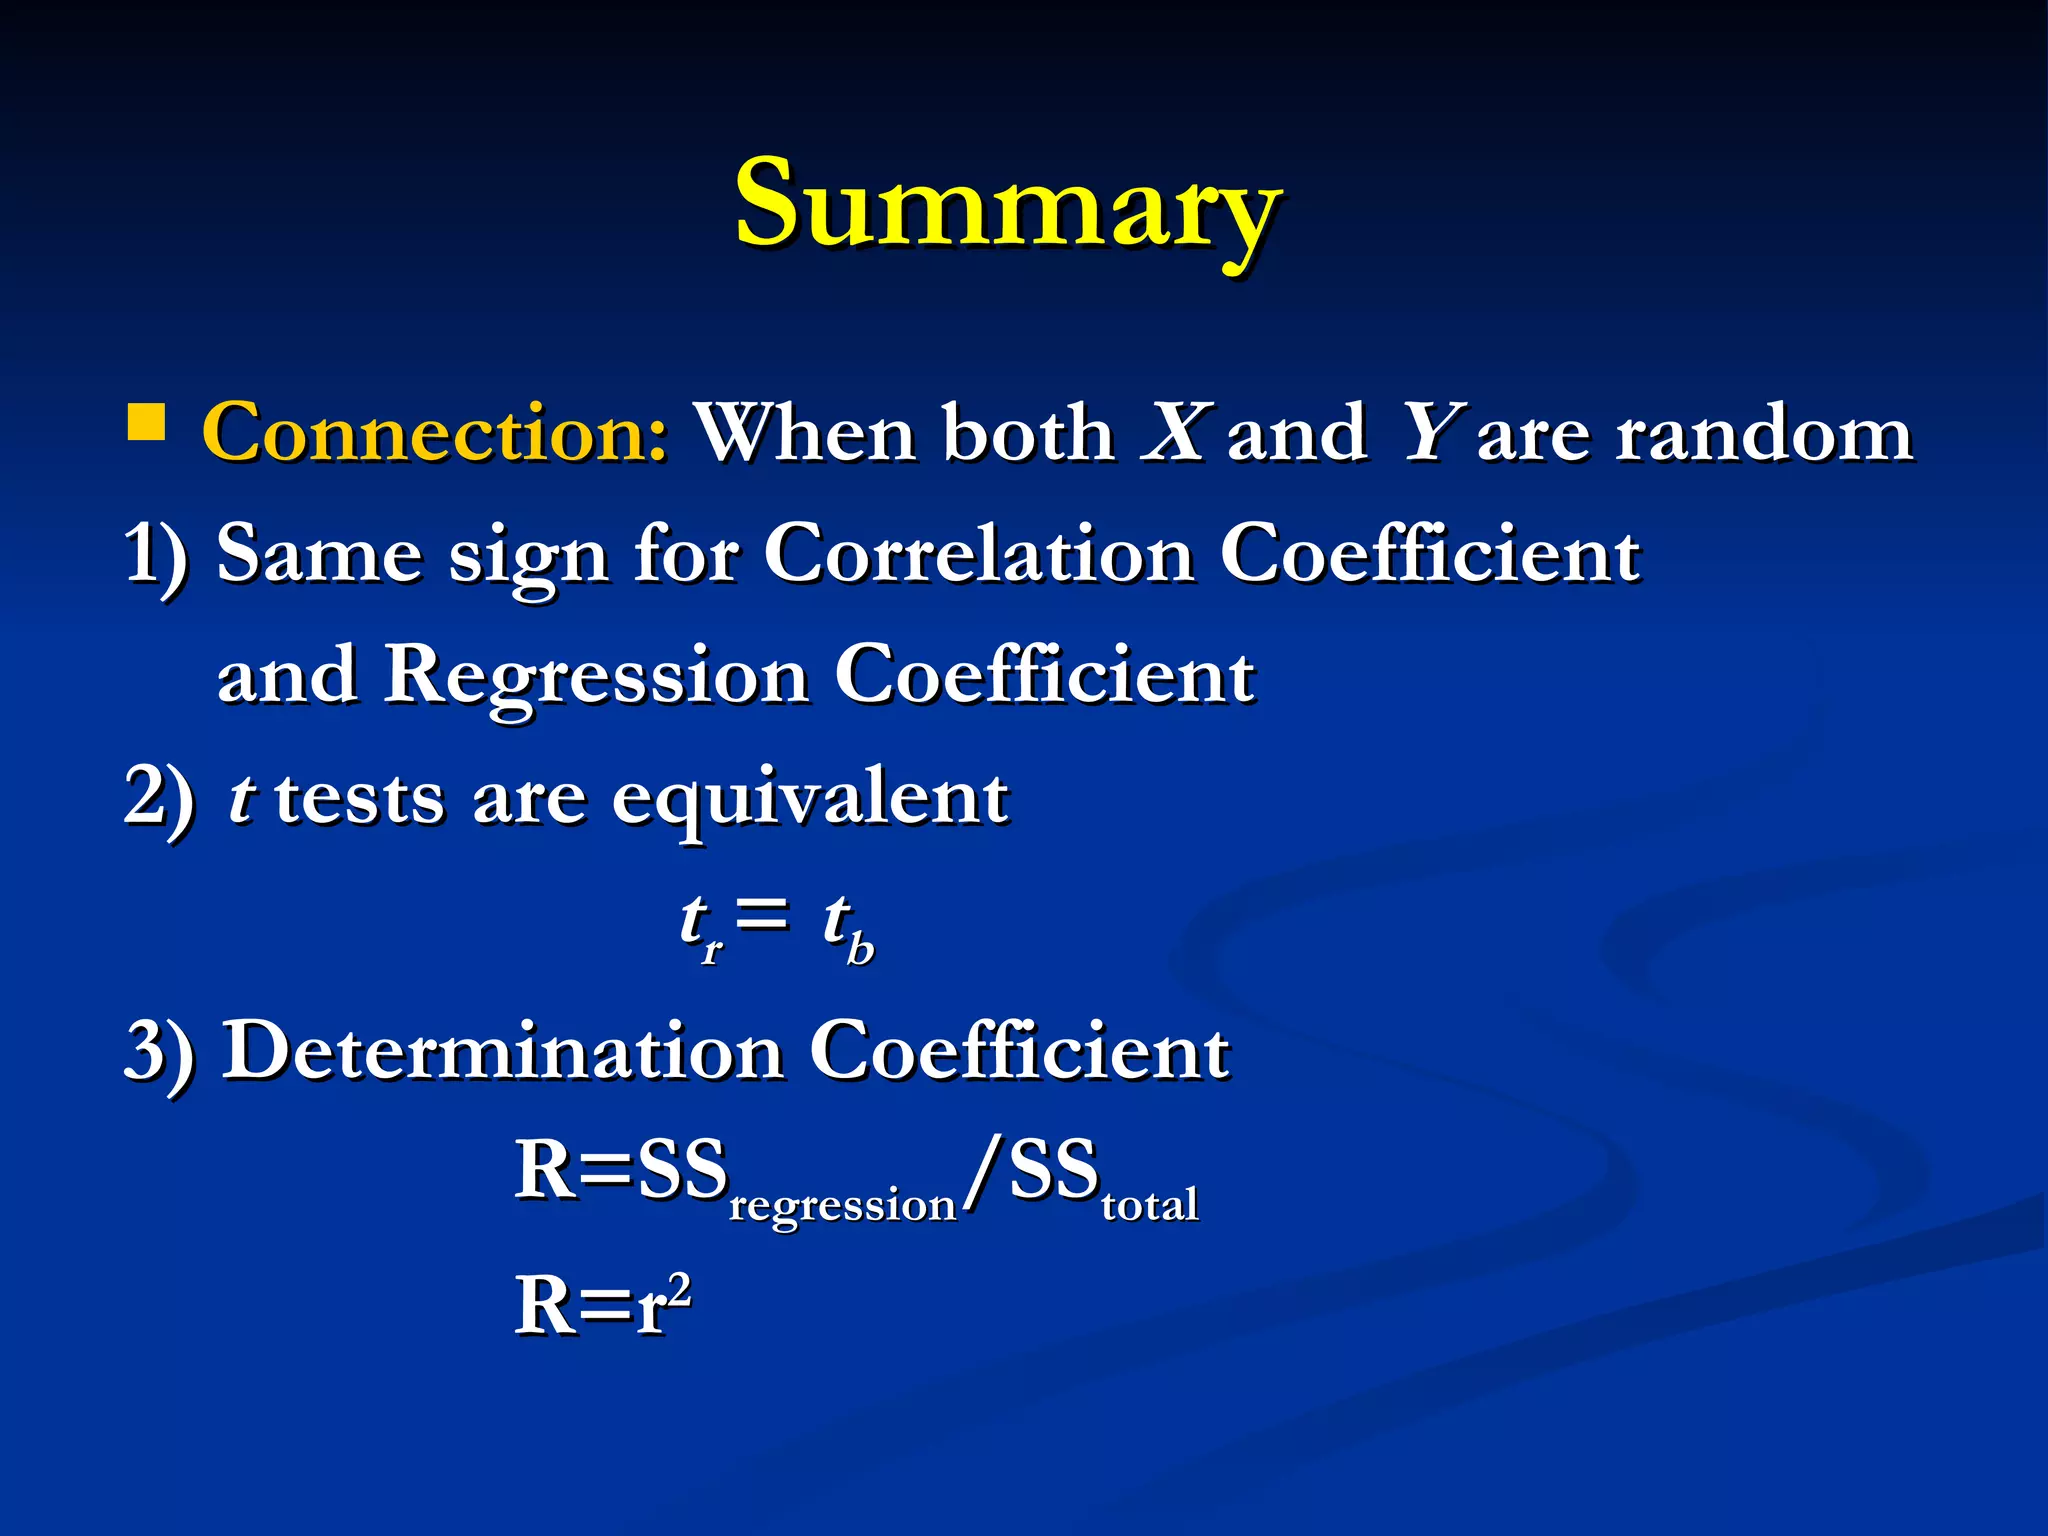
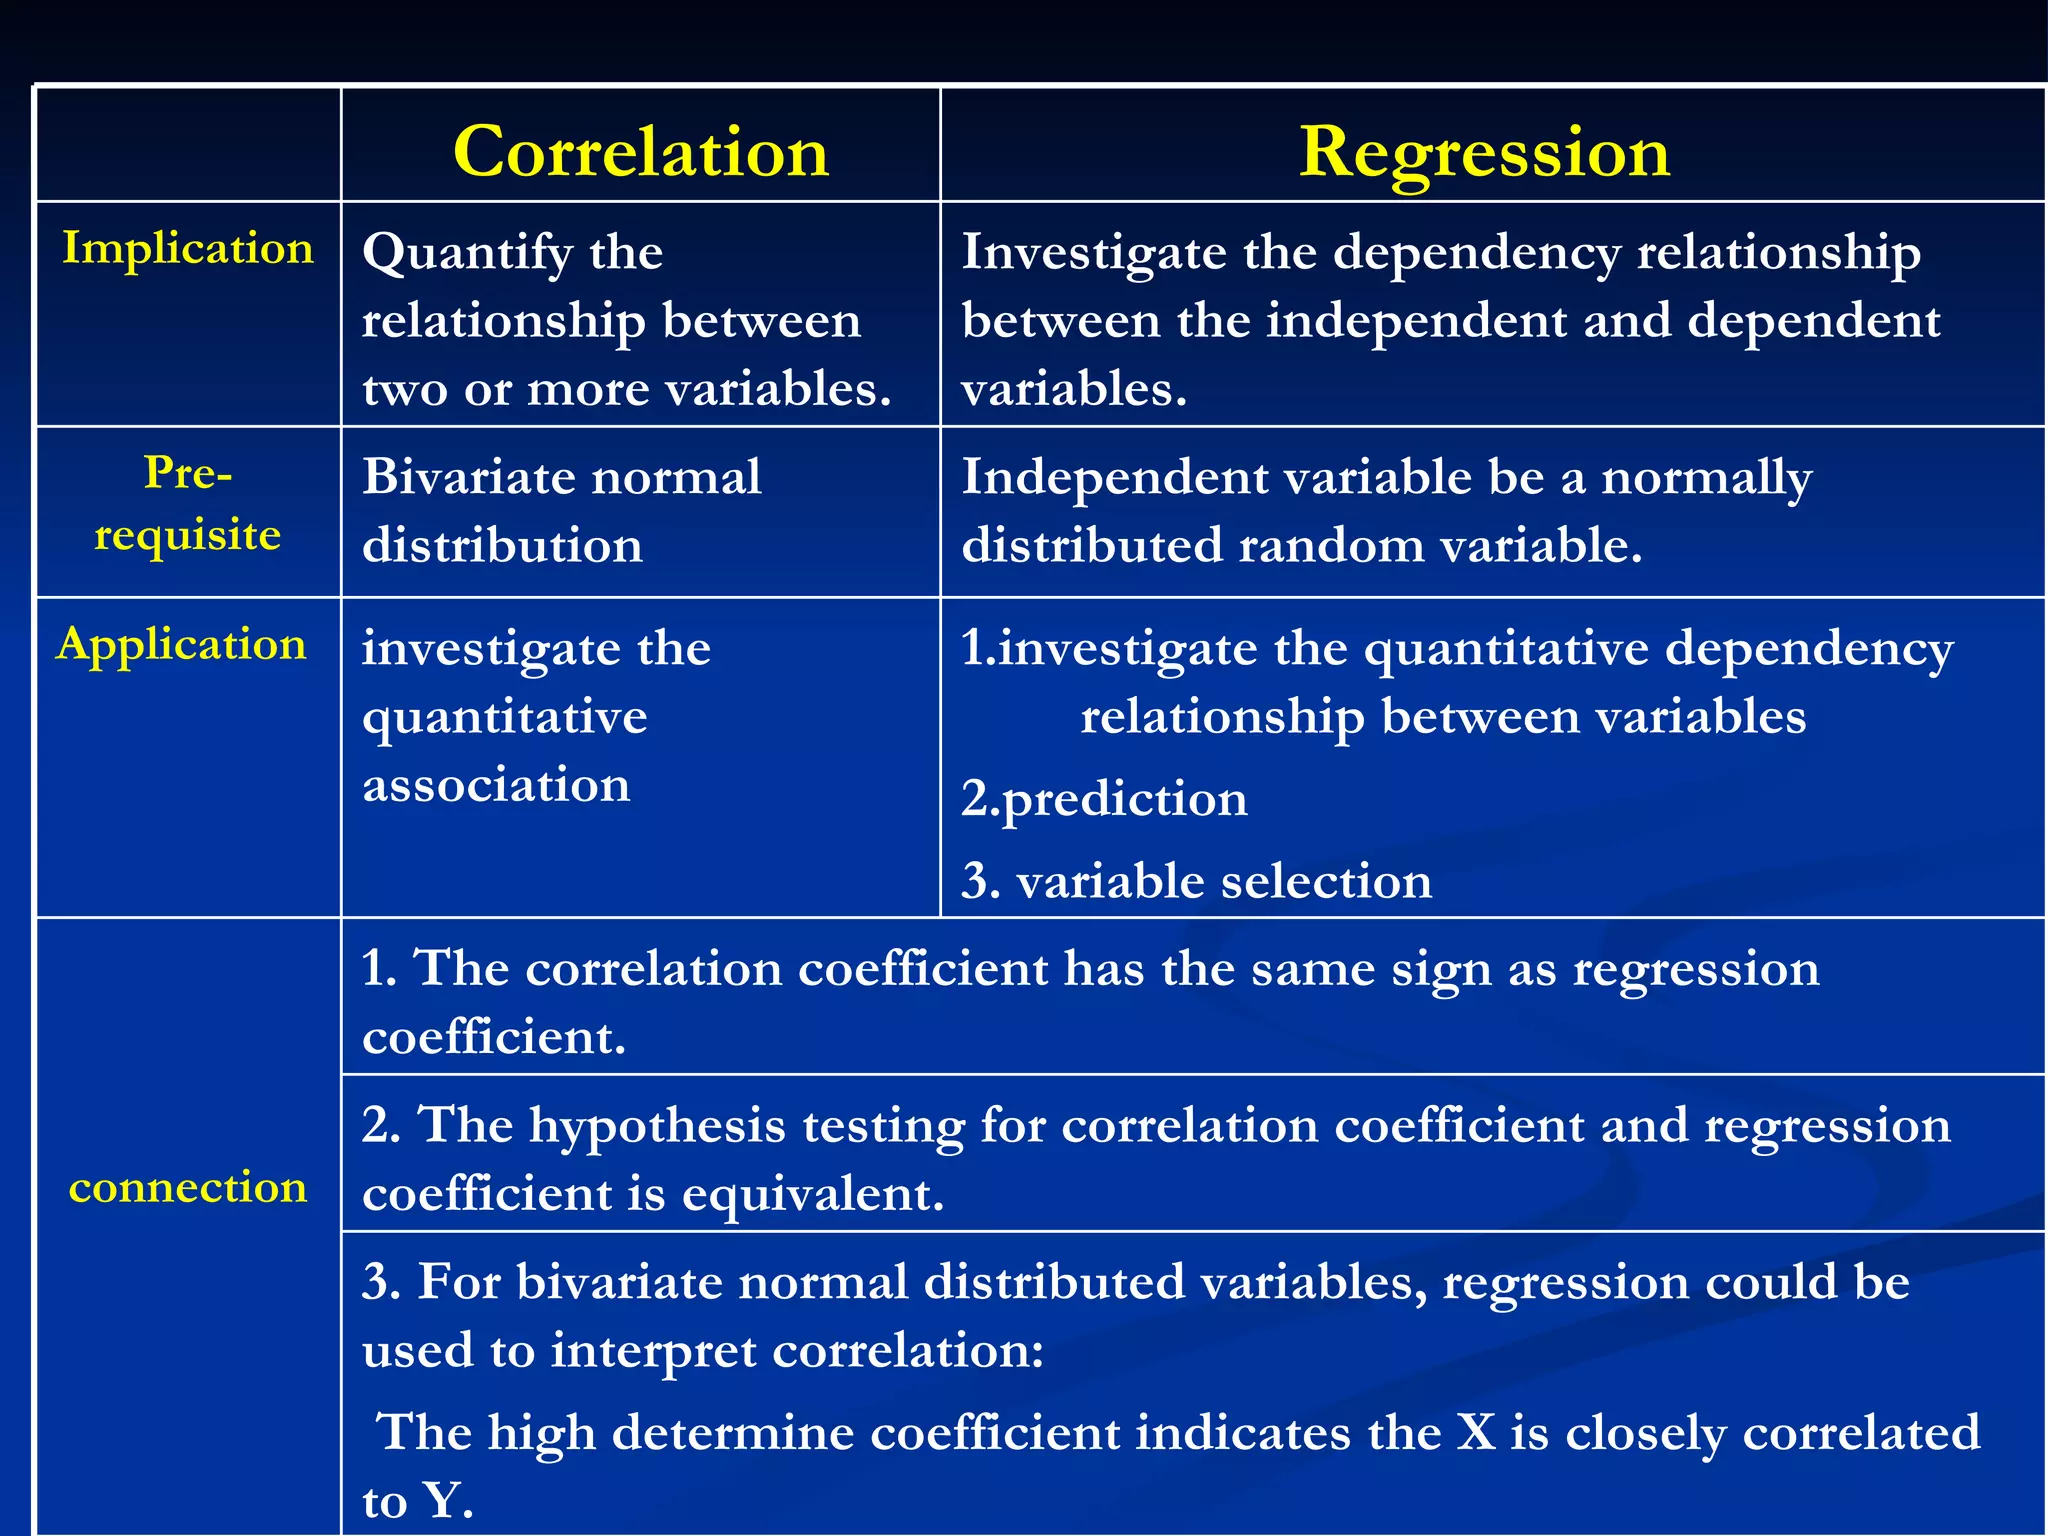
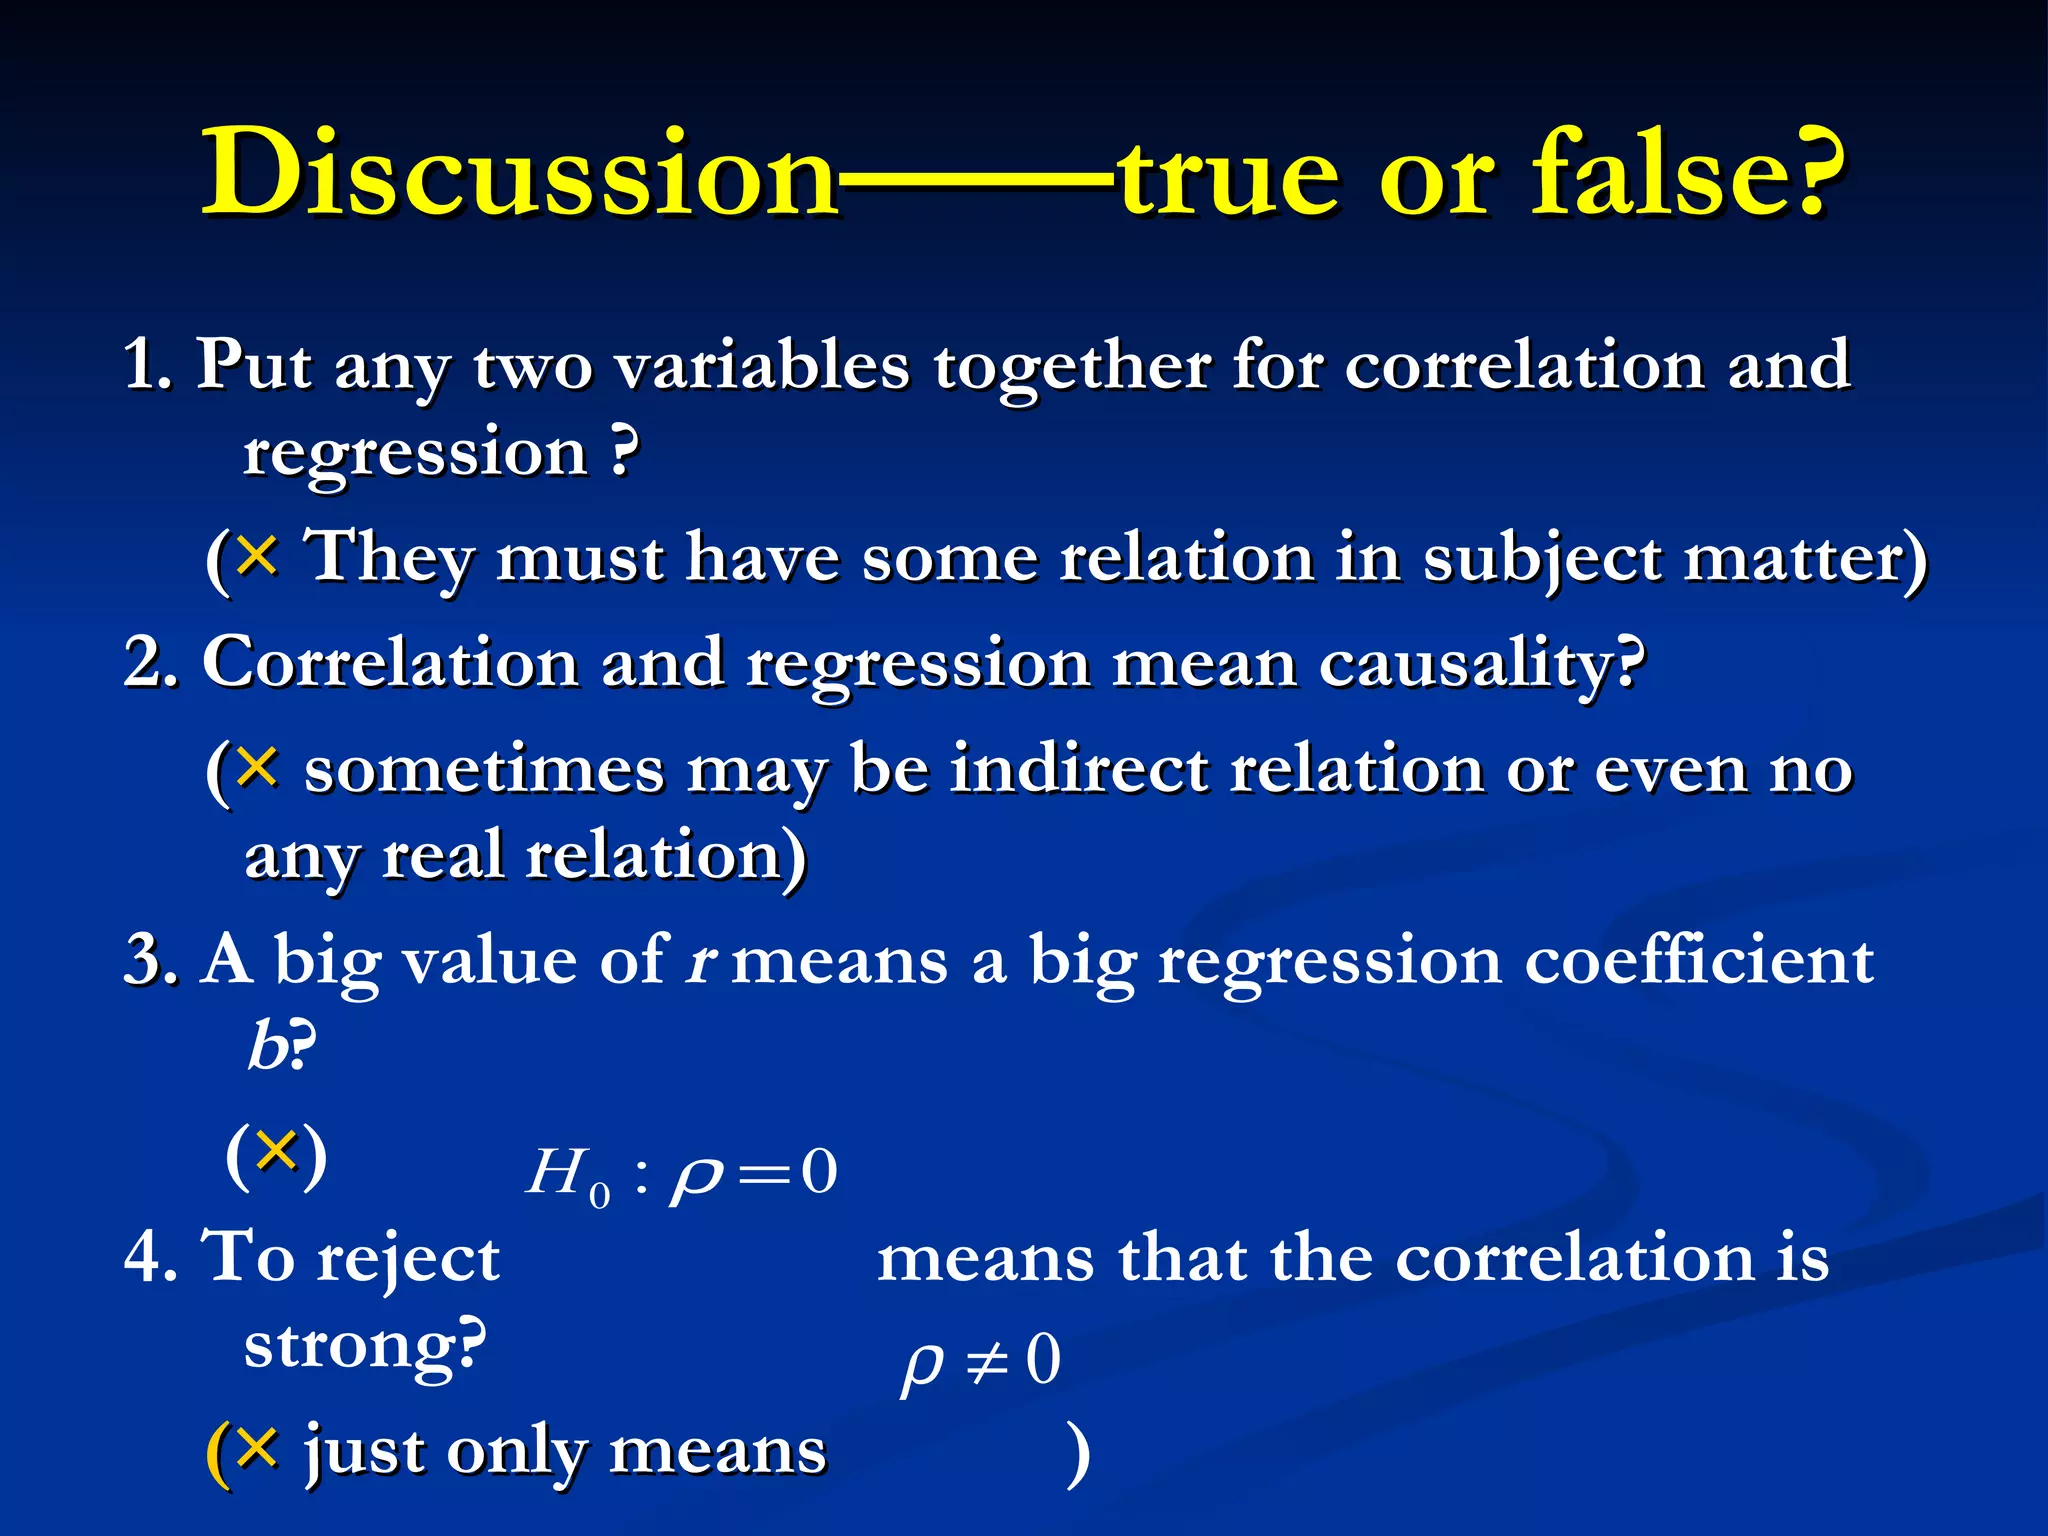


1. The document discusses linear correlation and regression between plasma amphetamine levels and amphetamine-induced psychosis scores using data from 10 patients. 2. A positive correlation was found between the two variables, and a linear regression equation was established to predict psychosis scores from amphetamine levels. 3. However, further statistical tests were needed to determine if the correlation and regression model could be generalized to the overall patient population.


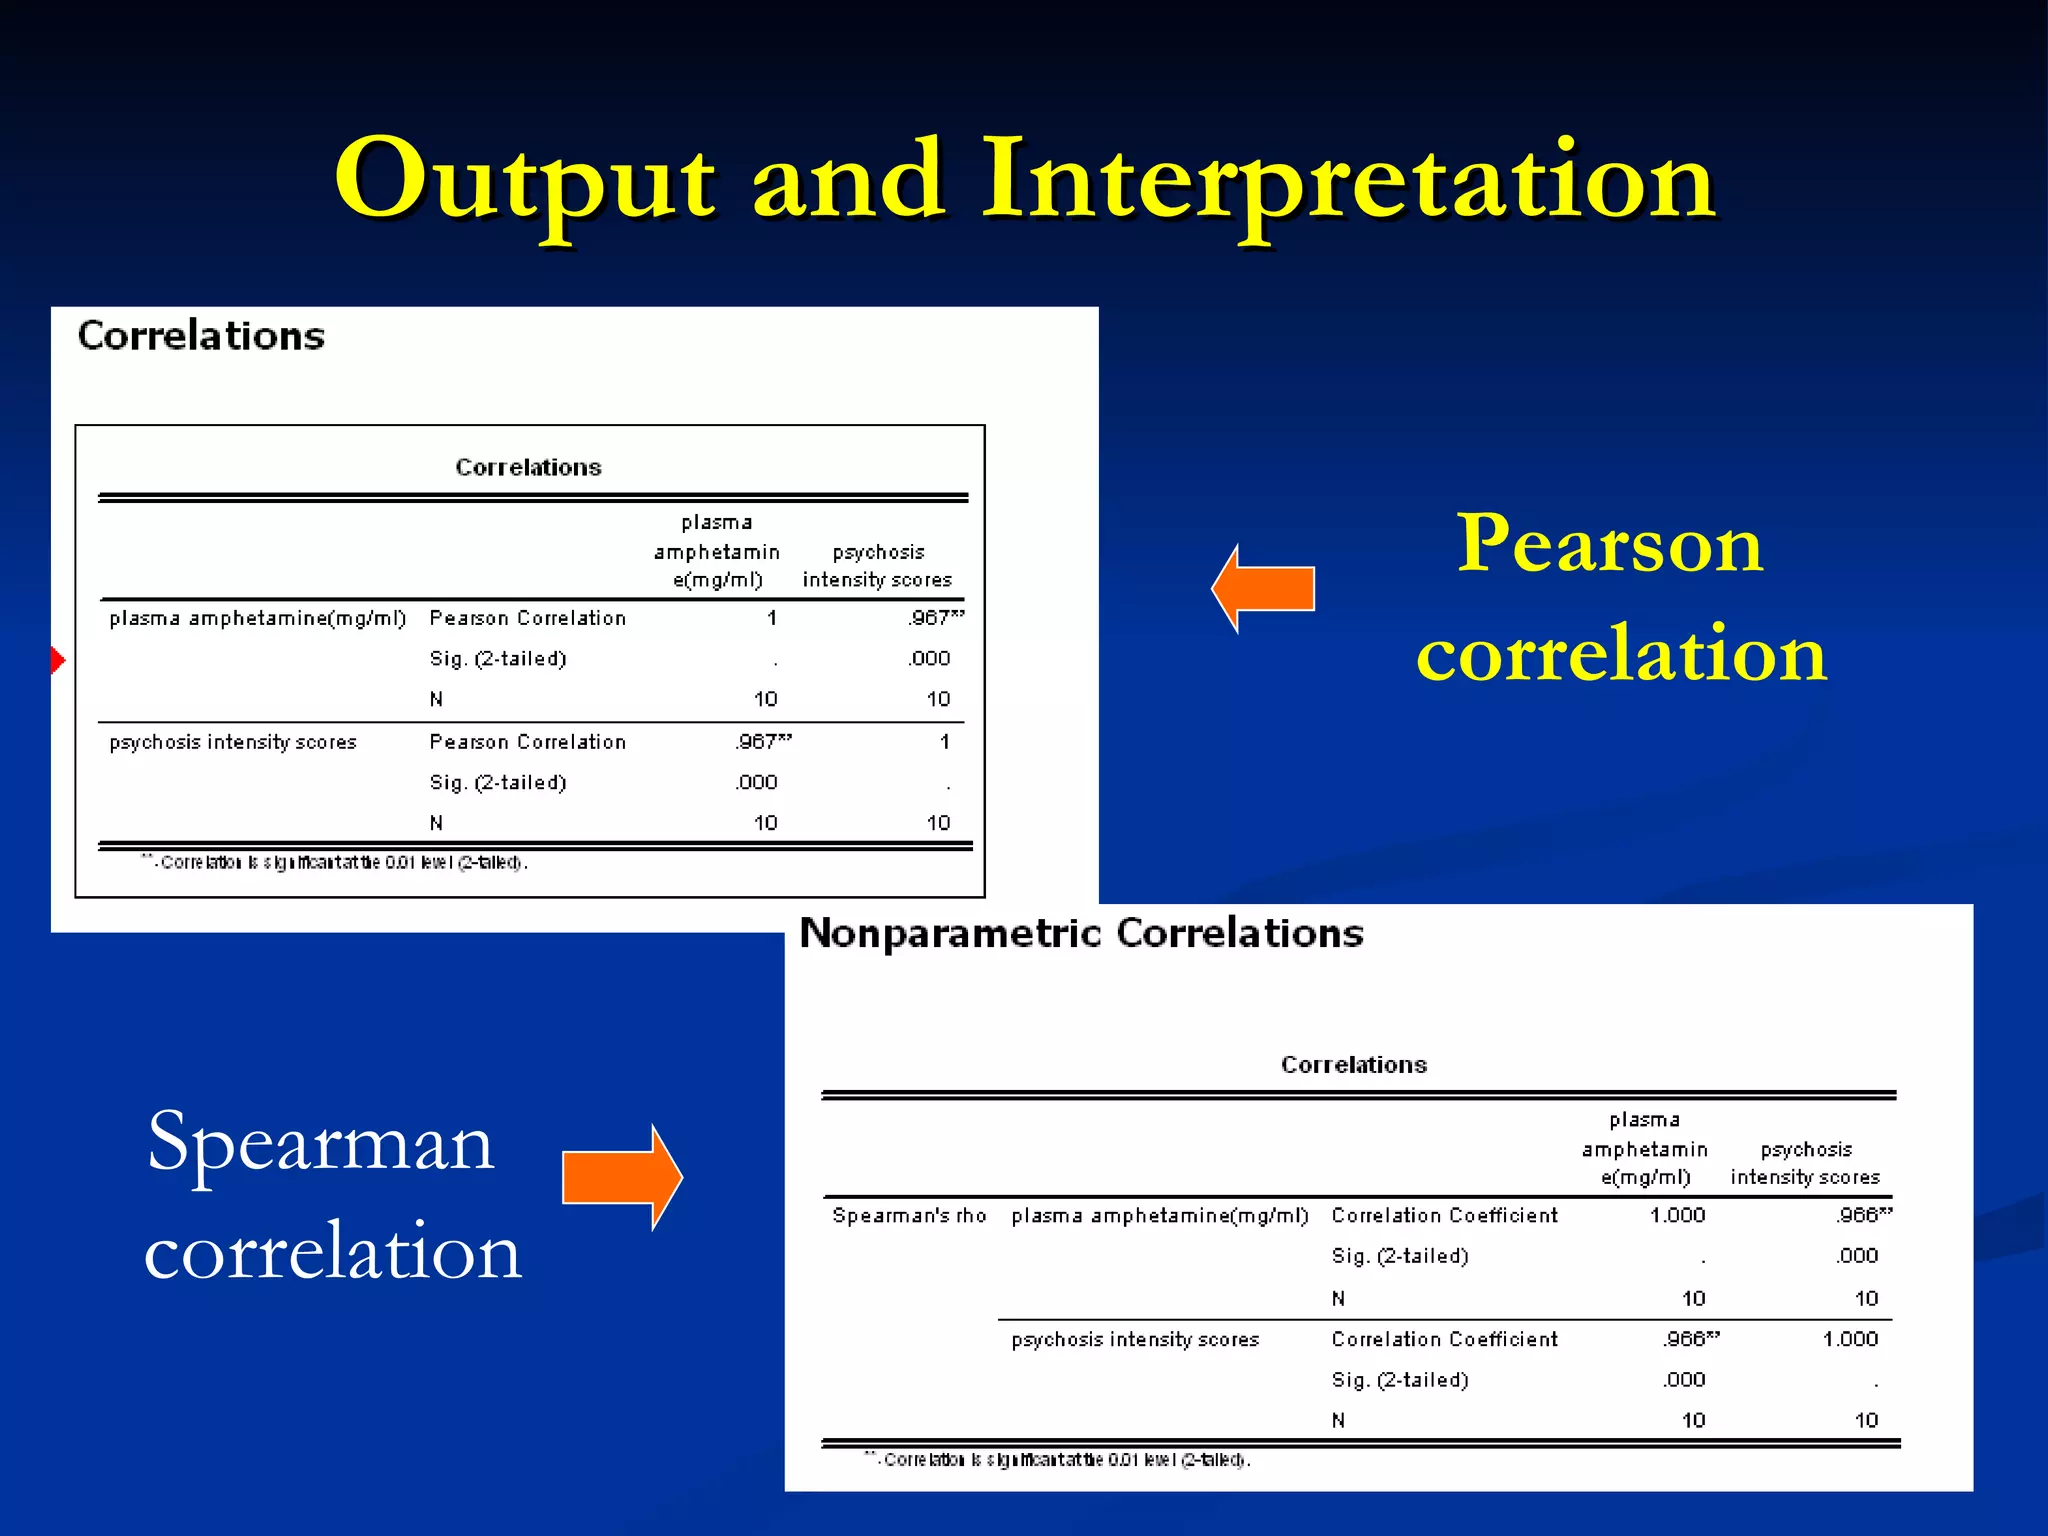
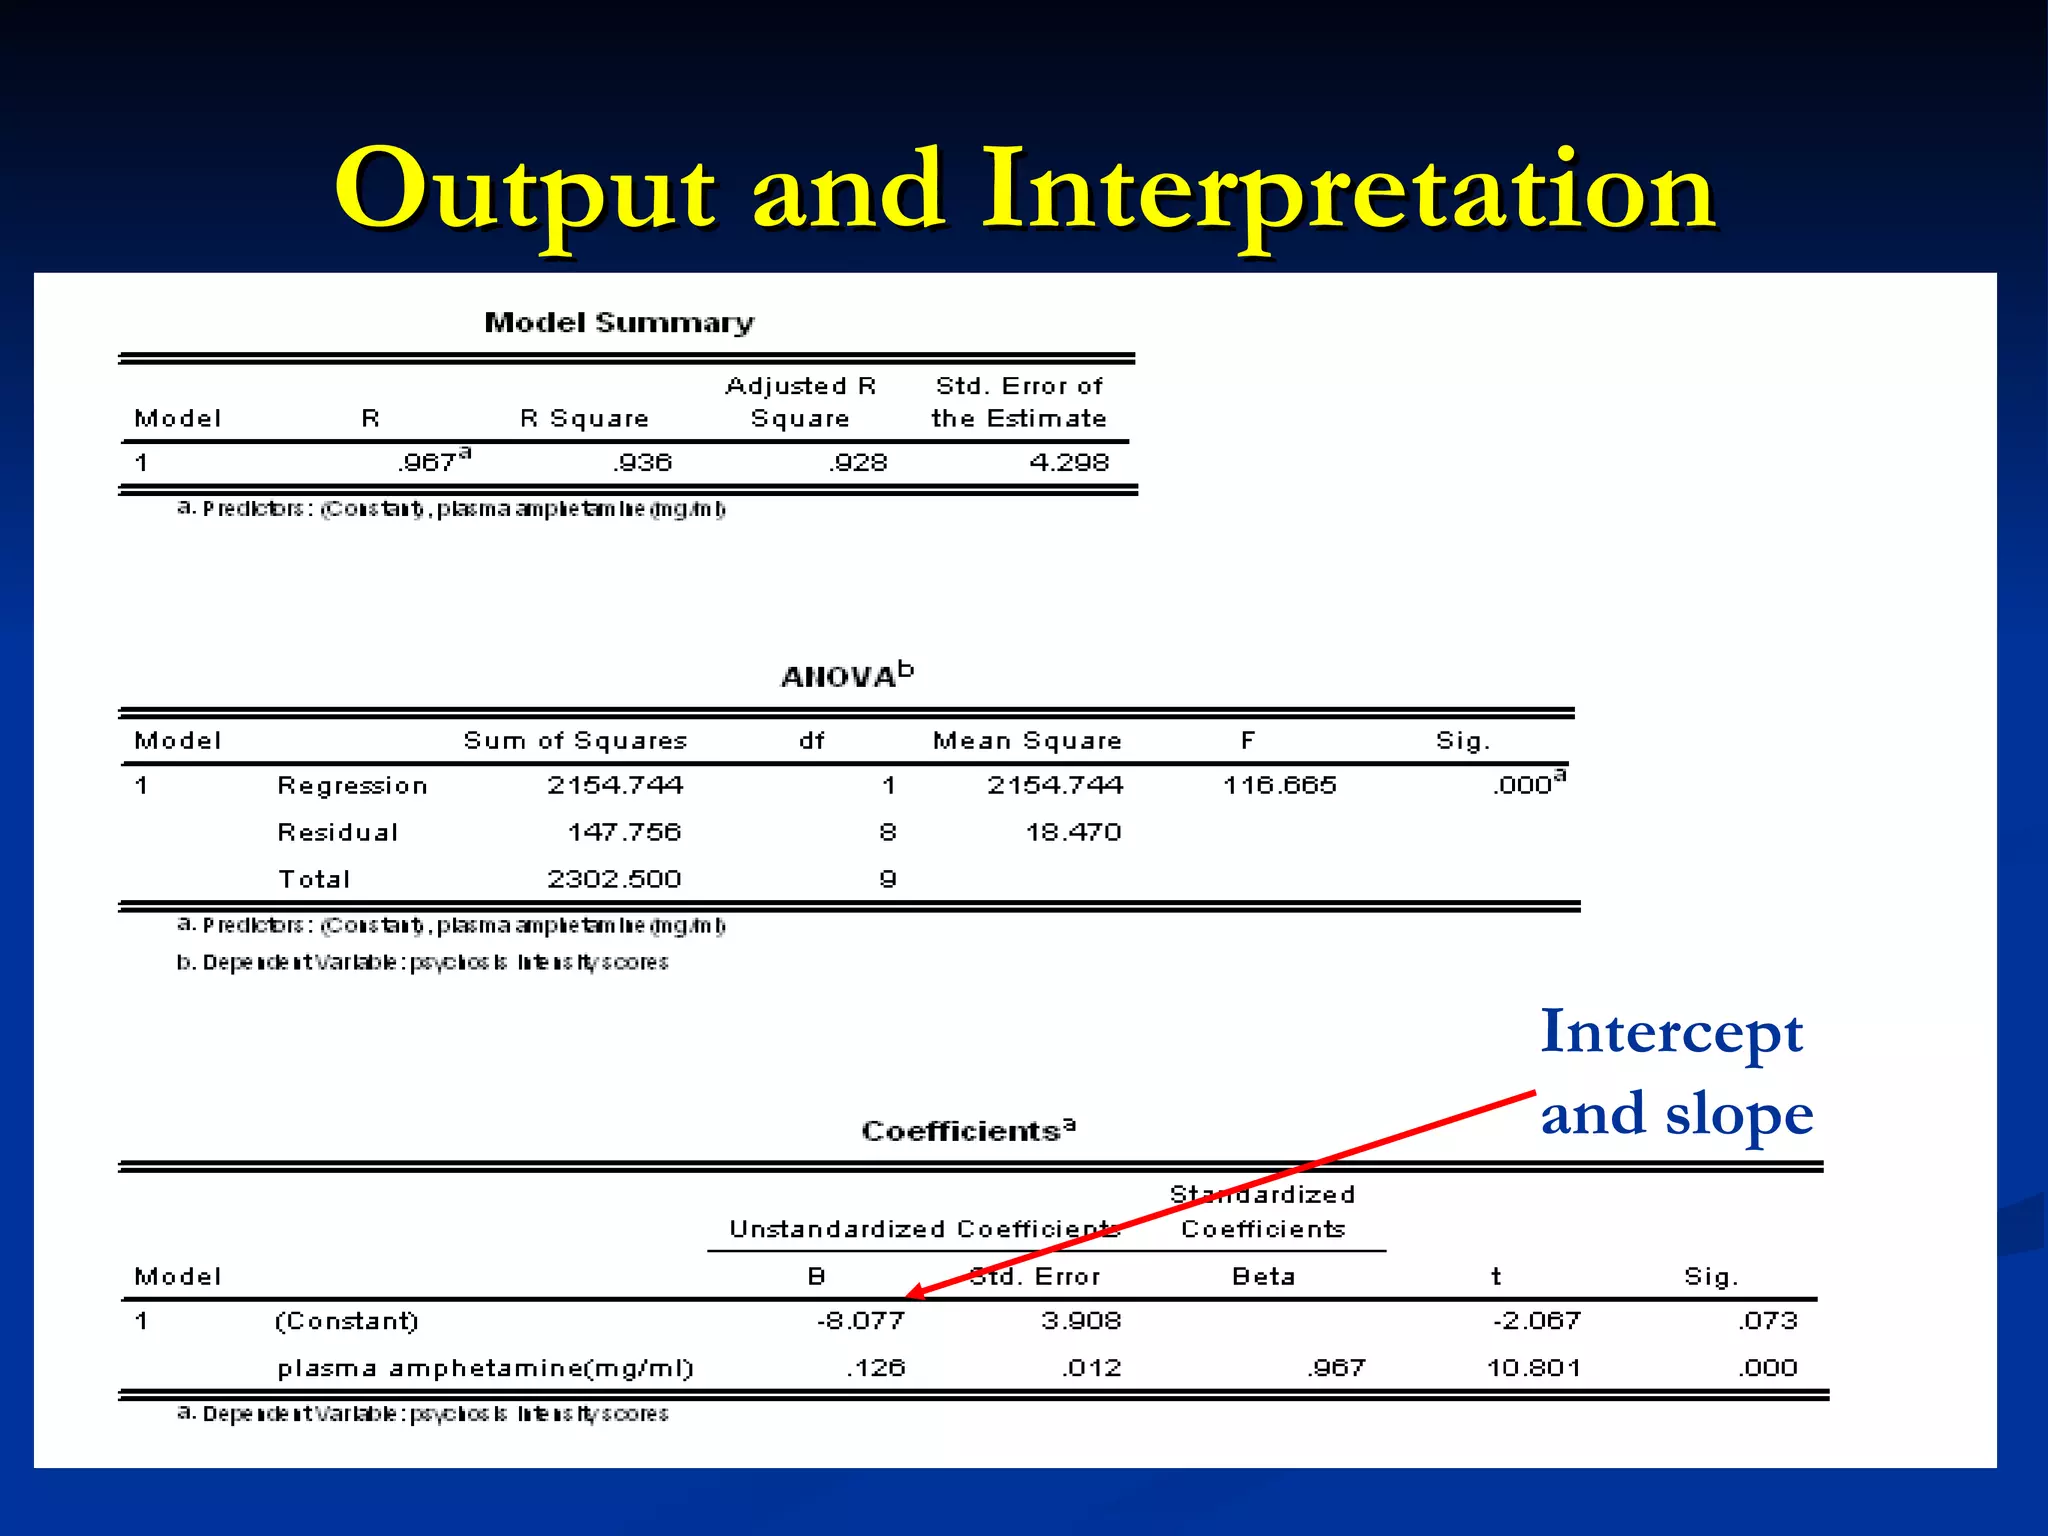
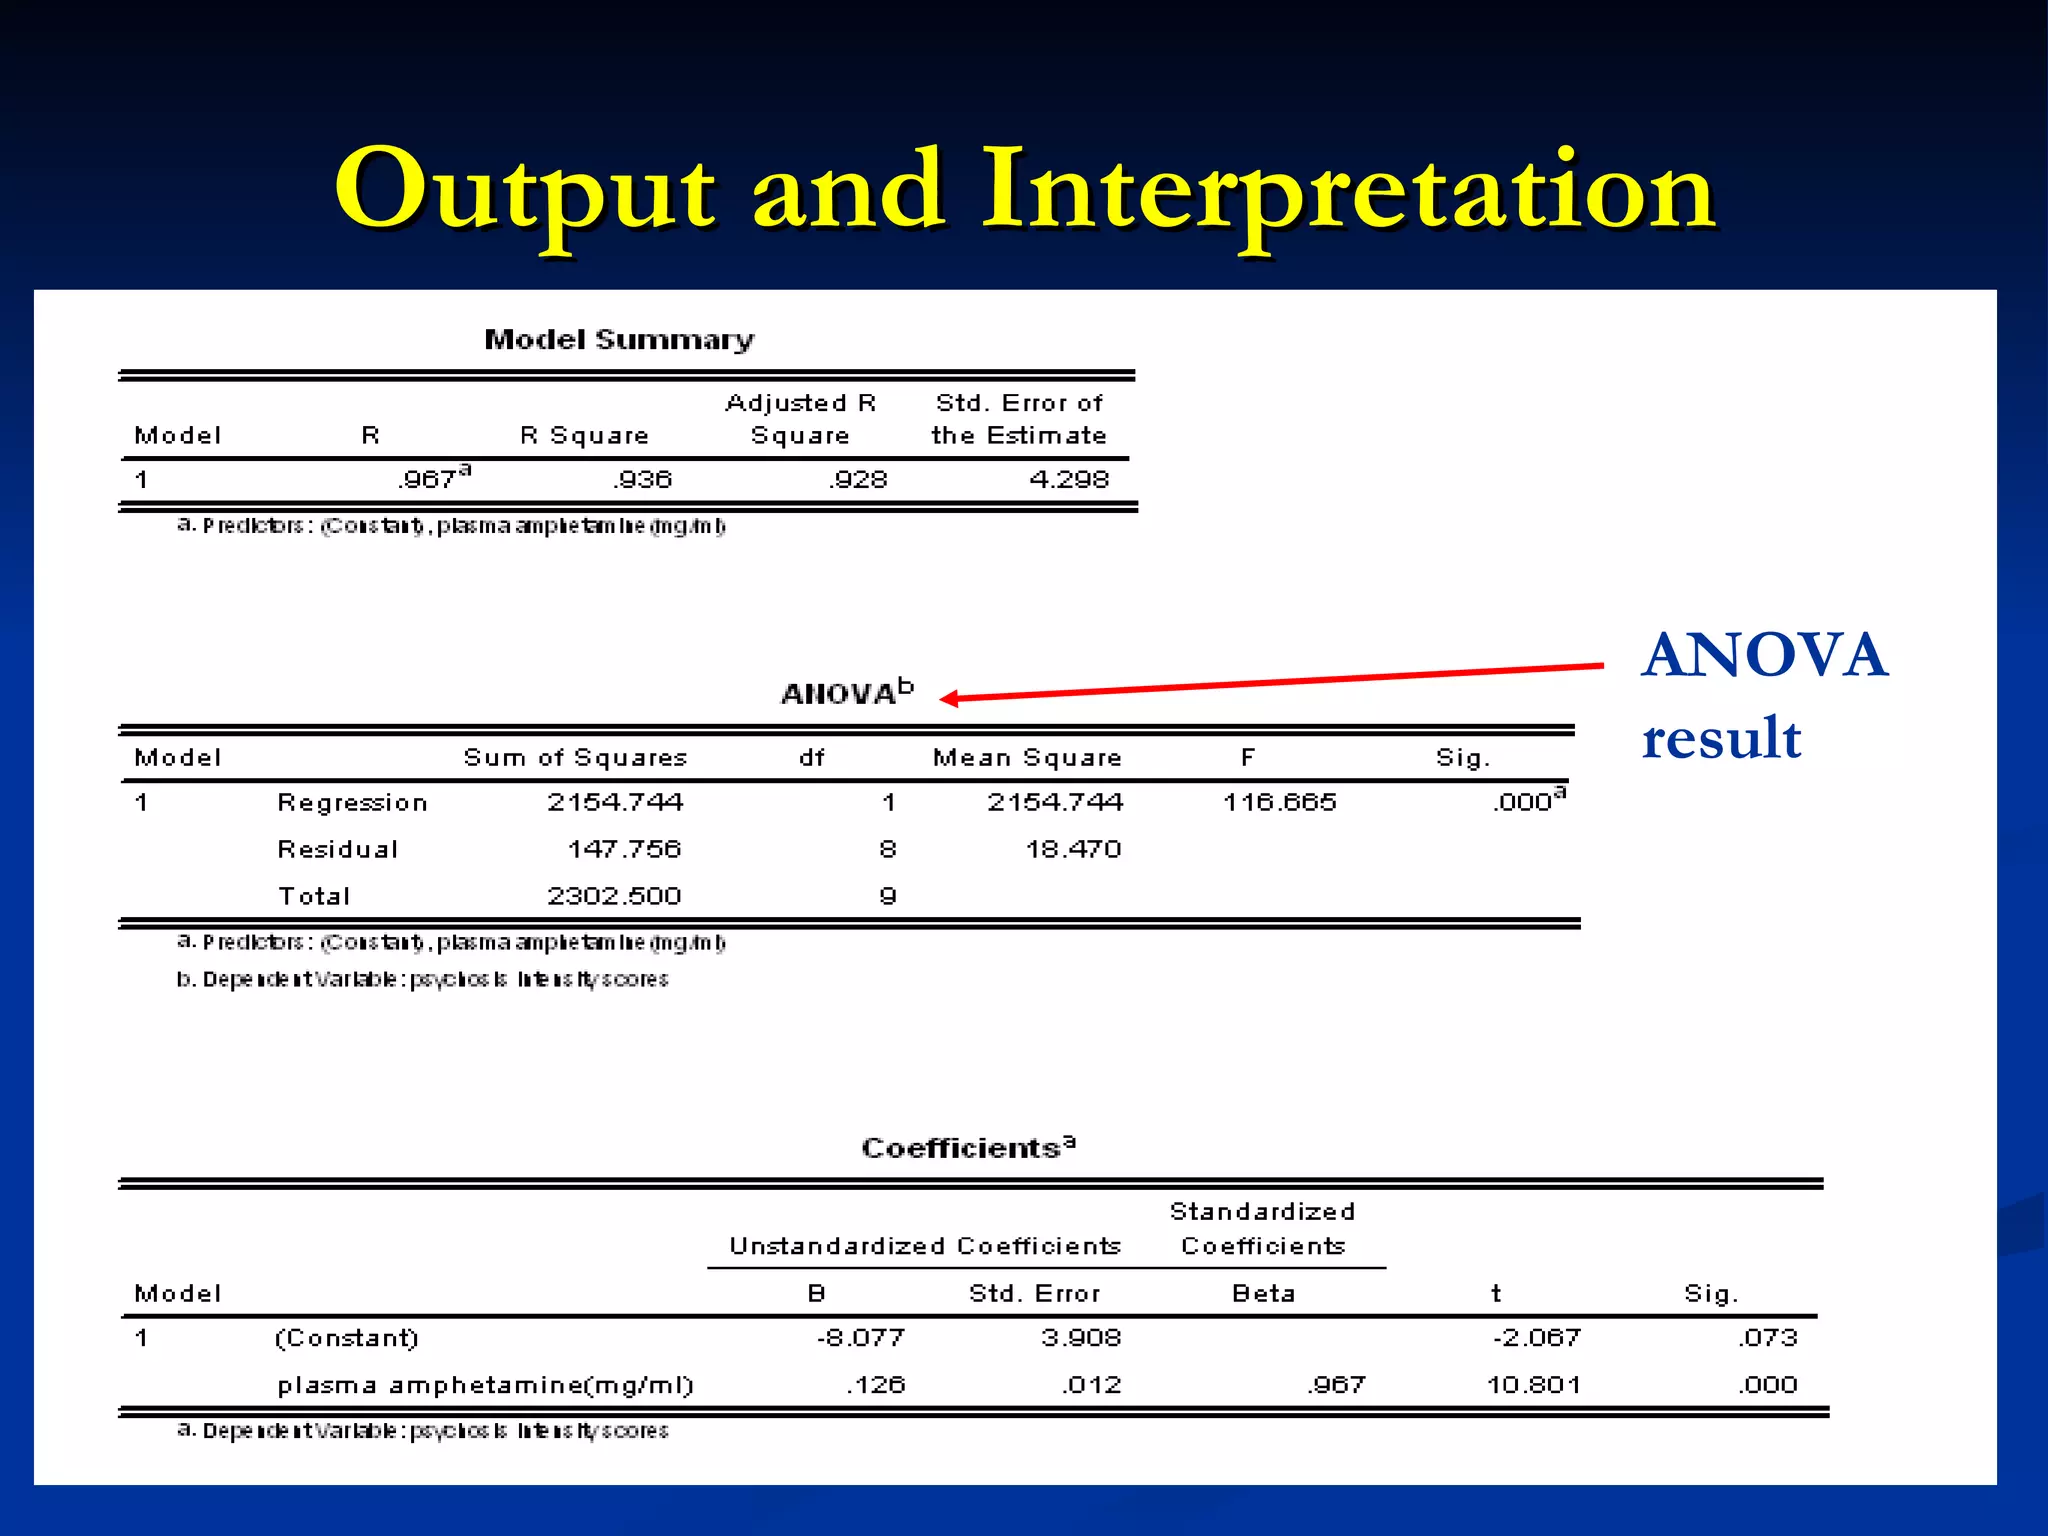
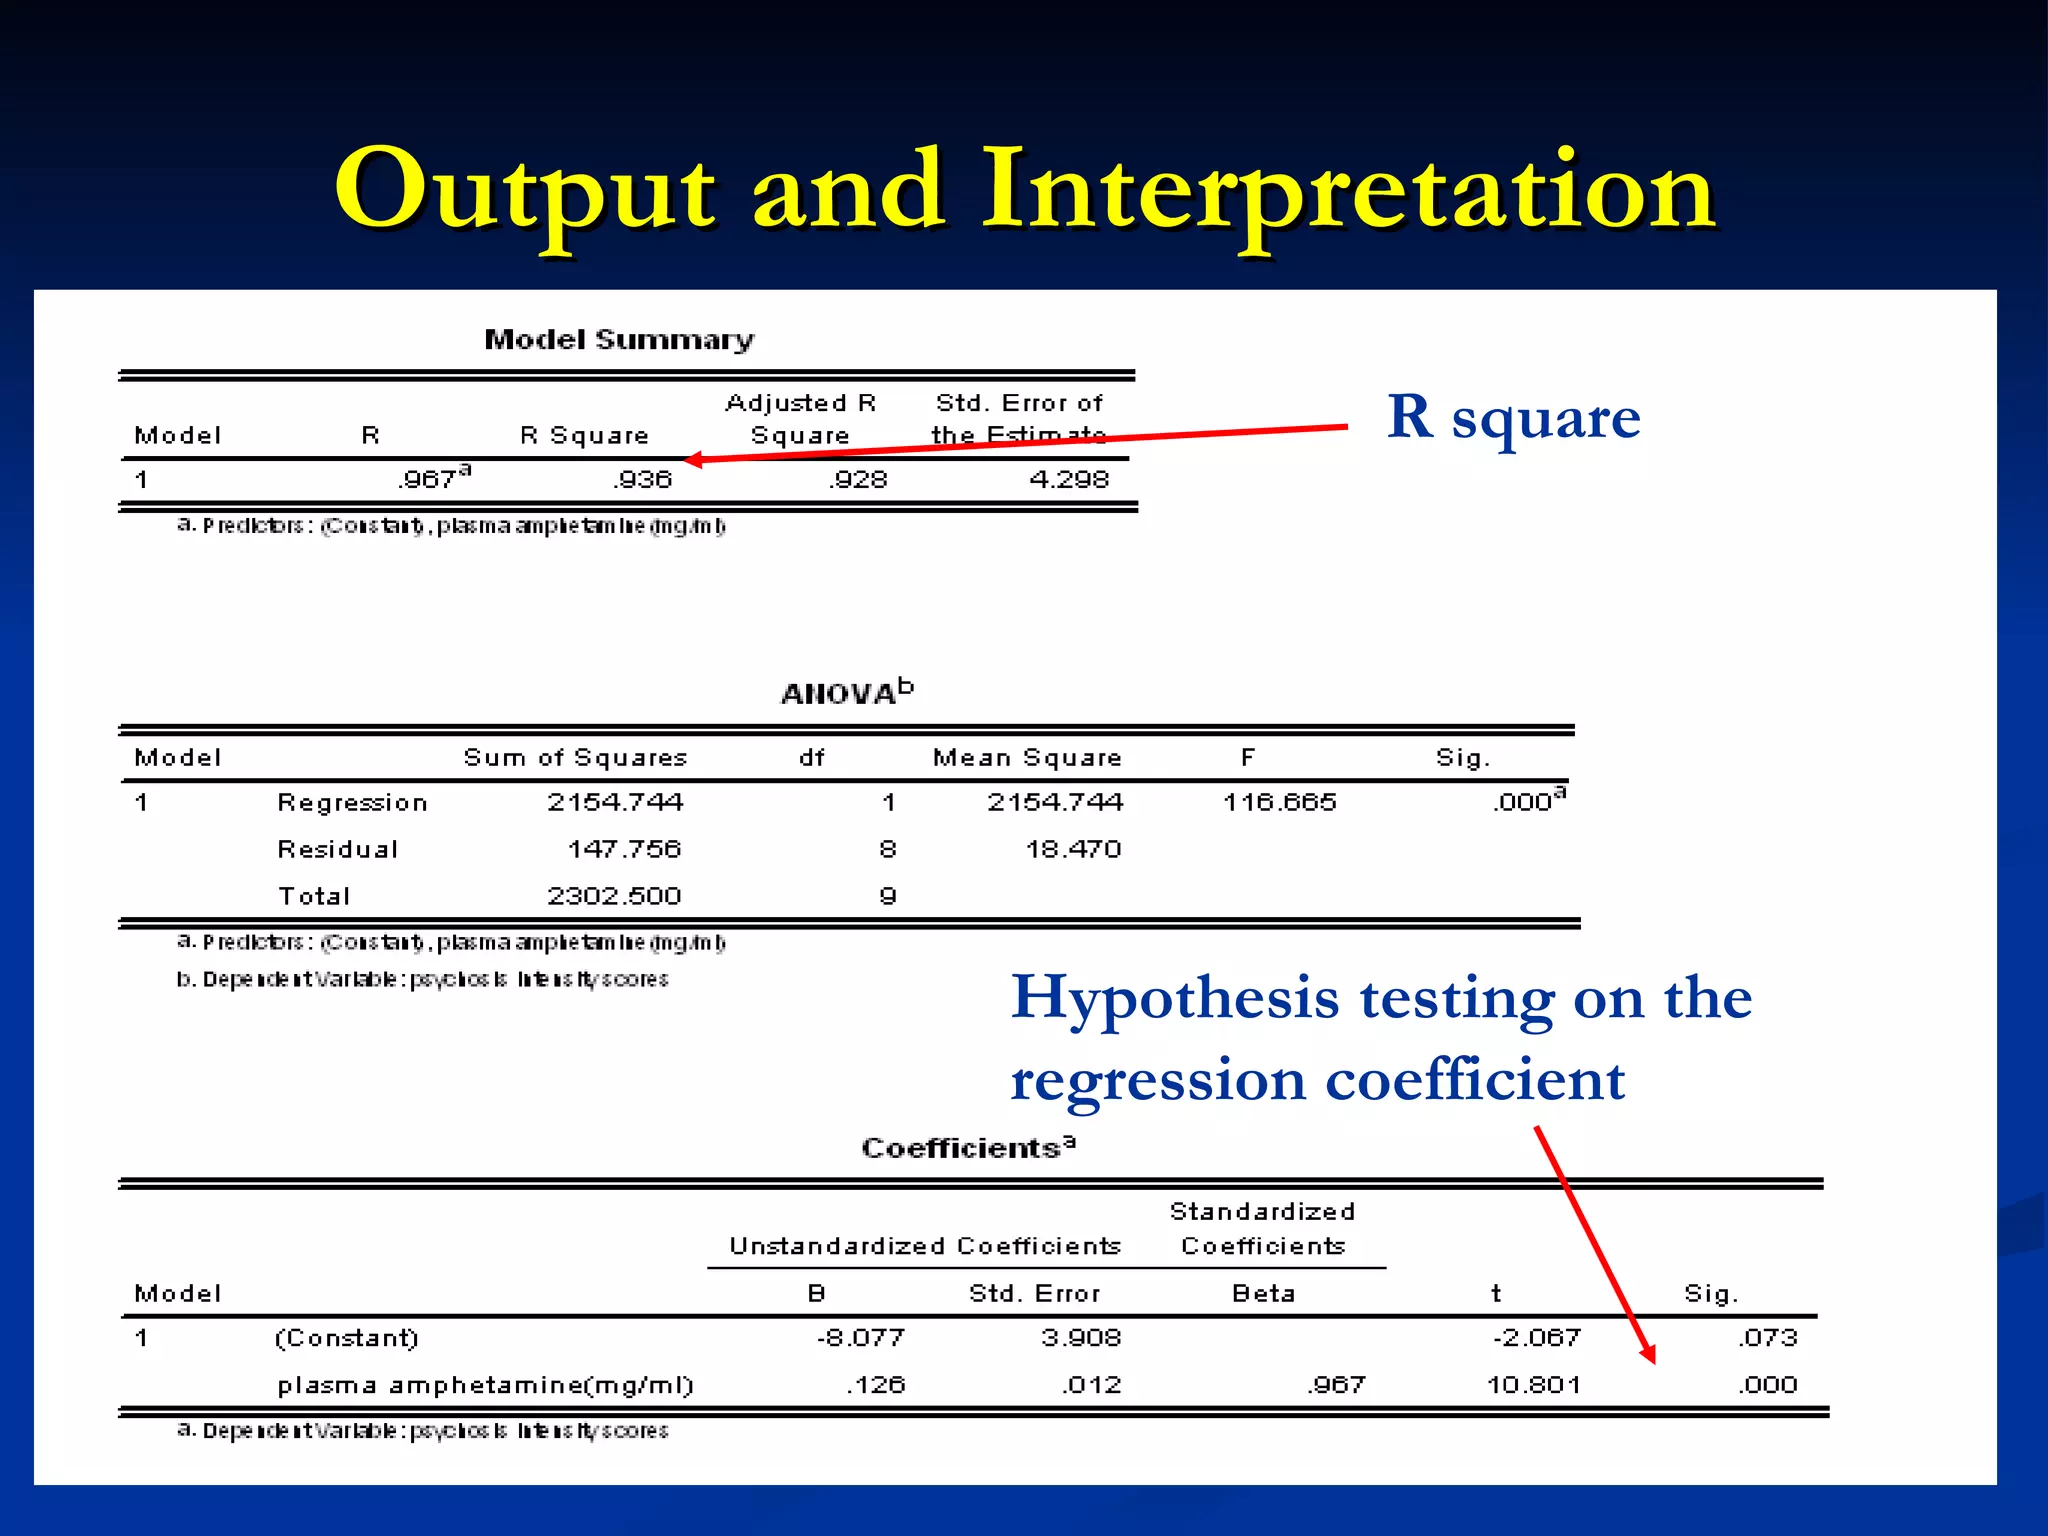
![Coded Agents – with UiPath SDK + LangGraph [Virtual Hands-on Workshop]](https://cdn.slidesharecdn.com/ss_thumbnails/codedagentsdeck-251215155422-5497c599-thumbnail.jpg?width=640&height=640&fit=bounds)


