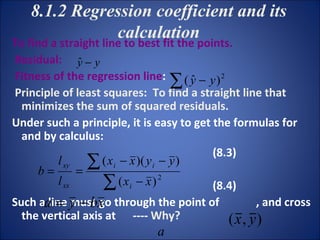
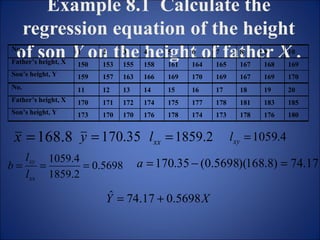
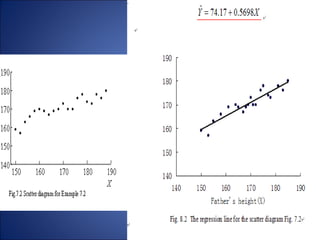
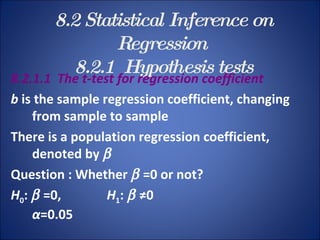
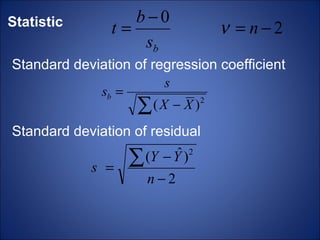
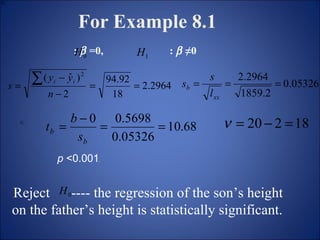
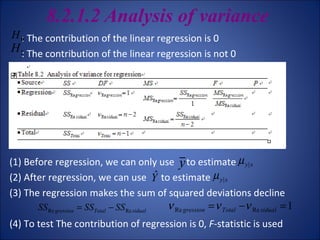
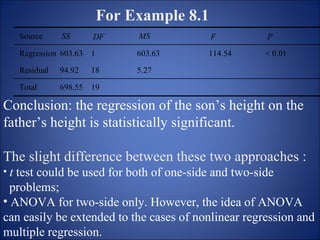
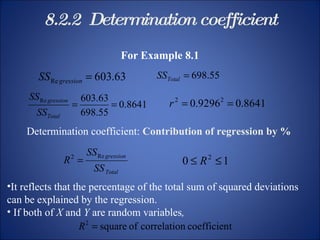
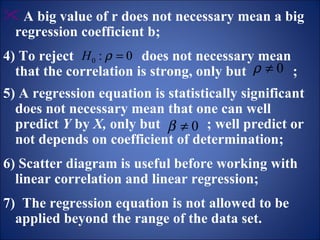
Chapter 9 Linear Regression
How does the value of one variable depend on that of another one? How does the son’s height depend on the father’s height? How does the death rate of animal depend on the drug dosage? How does the infant weight depend on the month’s age? How does the body surface area depend on the height? ----  To explore linear dependence quantitatively between two continuous variables.
8.1.1 Linear regression equation Initial meaning of “regression”: Galdon noted that if the father is tall, his son will be relatively tall; if the father is short, his son will  be relatively short.  But, if the father is very tall, his son will not taller than his father usually; if the father is very short, his son will not shorter than his father usually.  Otherwise, ……?! Galdon called this phenomenon “regression to the mean” 8.1 Statistical Description of Linear Regression
Independent variable  (explanatory variable),  X randomly changing  or  fixed by the researcher Dependent variable  (response variable),  Y randomly following a linear equation
What is regression in statistics? To find out the track of the means 100 120 140 160 180 200 220 100 120 140 160 180 200 220 Father ’ s height ( cm ) Son’s height (cm)
Given the value of  X ,  Y  varies around a center  (  y|x ) All the centers locate on a line -- regression line.  The relationship between the center   y|x  and X is described by a linear equation
Linear regression Try to estimate    and    , getting  Where  a --  estimate of    , intercept b --  estimate of    , slope --  estimate of   y|x
8.1.2 Regression coefficient and its calculation To find a straight line to best fit the points. Residual:   Fitness of the regression line :  Principle of least squares :  To find a straight line that minimizes the sum of squared residuals.  Under such a principle, it is easy to get the formulas for and by calculus:   (8.3) (8.4) Such a line must go through the point of  , and cross the vertical axis at  ----  Why?
Example 8.1  Calculate the regression equation of the height of son  Y  on the height of father  X  .
 
8.2 Statistical Inference on Regression   8.2.1  Hypothesis tests 8.2.1.1  The t-test for regression coefficient b  is the sample regression coefficient, changing from sample to sample There is a population regression coefficient, denoted by   Question : Whether    =0 or not? H 0 :     =0,  H 1 :     ≠0 α =0.05
Statistic Standard deviation of regression coefficient Standard deviation of residual
For Example 8.1 p  <0.001 .  Reject  ---- the regression of the son’s height on the father’s height is statistically significant. :     =0,  :     ≠0
8.2.1.2 Analysis of variance   : The contribution of the linear regression is 0 : The contribution of the linear regression is not 0 (1) Before regression, we can only use  to estimate (2)  After regression, we can use  to estimate (3)  The regression makes the sum of squared deviations decline  (4) To test The contribution of regression is 0,  F -statistic is used
For Example 8.1 Conclusion: the regression of the son’s height on the father’s height is statistically significant. The slight difference between these two approaches : t  test could be used for both of one-side and two-side  problems; ANOVA for two-side only. However, the idea of ANOVA can easily be extended to the cases of nonlinear regression and multiple regression.
8.2.2  Determination coefficient   For Example 8.1 Determination coefficient:  Contribution of regression by % It reflects that the percentage of the total sum of squared deviations  can be explained by the regression. If both of  X  and  Y  are random variables ,
In practice, it is suggested to report the value of determination coefficient after an analysis of regression to describe how good the regression is.  Here is a story:  : An index of liver function : A score for psychological status   Regression is statistically significant, Claimed:  “the index for liver function can be improved by psychological consultation” It is wrong? Why?
8.3 The Application of Linear Regression 8.3.1 Two interval estimations 8.3.1.1 Confidence interval for 8.3.1.2 Prediction interval for  Y
8.3.3  On the basic assumptions    ----  LINE (1)  Linear  : There exists a linear tendency between the dependent variable and the independent variable (2)  Independent  : The individual observations are independent each other (3)  Normal  : Given the value of, the corresponding follows a normal distribution  (4)  Equal variances  : The variances of  for different values of are all equal, denoted with .
In practice, one may use scatter diagram to observe whether the basic assumptions are met.  The assumption of linearity is essential that using a linear model to describe a curvilinear relationship is obviously inappropriate;  The assumption of independency is also essential;  The violation to the assumptions of normal distribution and equal variance might not seriously affect the least square estimates though all the introduced formulas for statistical inference might not valid.  Once the assumptions (1), (3) and (4) are violated, some transformations are worthwhile to try.
Summary  Regression and Correlation   1. Distinguish and connection Distinguish :  Correlation: Both  X  and  Y  are random  Regression:  Y  must be random  X  could be random or not   random
Connection:   When  both  X  and  Y  are random  1) Same sign for correlation coefficient  and regression coefficient  2)  t  tests are equivalent  t r  =  t b 3)  Determination   Coefficient
2. Caution -- for regression and correlation Don’t put any two variables together for correlation and regression – They must have some relation in subject matter; Correlation and regression do not necessary mean causality ---- sometimes may be indirect relation or even no any real relation;
A big value of r does not necessary mean a big regression coefficient b; 4) To reject  does not necessary mean that the correlation is strong, only but  ; 5) A regression equation is statistically significant does not necessary mean that one can well predict  Y  by  X,  only but  ; well predict or not depends on coefficient of determination;   6) Scatter diagram is useful before working with  linear correlation and linear regression; 7)  The regression equation is not allowed to be applied beyond the range of the data set.
 

Chapter 9 Regression

  • 1.
    Chapter 9 LinearRegression
  • 2.
    How does thevalue of one variable depend on that of another one? How does the son’s height depend on the father’s height? How does the death rate of animal depend on the drug dosage? How does the infant weight depend on the month’s age? How does the body surface area depend on the height? ---- To explore linear dependence quantitatively between two continuous variables.
  • 3.
    8.1.1 Linear regressionequation Initial meaning of “regression”: Galdon noted that if the father is tall, his son will be relatively tall; if the father is short, his son will be relatively short. But, if the father is very tall, his son will not taller than his father usually; if the father is very short, his son will not shorter than his father usually. Otherwise, ……?! Galdon called this phenomenon “regression to the mean” 8.1 Statistical Description of Linear Regression
  • 4.
    Independent variable (explanatory variable), X randomly changing or fixed by the researcher Dependent variable (response variable), Y randomly following a linear equation
  • 5.
    What is regressionin statistics? To find out the track of the means 100 120 140 160 180 200 220 100 120 140 160 180 200 220 Father ’ s height ( cm ) Son’s height (cm)
  • 6.
    Given the valueof X , Y varies around a center (  y|x ) All the centers locate on a line -- regression line. The relationship between the center  y|x and X is described by a linear equation
  • 7.
    Linear regression Tryto estimate  and  , getting Where a -- estimate of  , intercept b -- estimate of  , slope -- estimate of  y|x
  • 8.
    8.1.2 Regression coefficientand its calculation To find a straight line to best fit the points. Residual: Fitness of the regression line : Principle of least squares : To find a straight line that minimizes the sum of squared residuals. Under such a principle, it is easy to get the formulas for and by calculus:   (8.3) (8.4) Such a line must go through the point of , and cross the vertical axis at ---- Why?
  • 9.
    Example 8.1 Calculate the regression equation of the height of son Y on the height of father X .
  • 10.
  • 11.
    8.2 Statistical Inferenceon Regression 8.2.1 Hypothesis tests 8.2.1.1 The t-test for regression coefficient b is the sample regression coefficient, changing from sample to sample There is a population regression coefficient, denoted by  Question : Whether  =0 or not? H 0 :  =0, H 1 :  ≠0 α =0.05
  • 12.
    Statistic Standard deviationof regression coefficient Standard deviation of residual
  • 13.
    For Example 8.1p <0.001 . Reject ---- the regression of the son’s height on the father’s height is statistically significant. :  =0, :  ≠0
  • 14.
    8.2.1.2 Analysis ofvariance : The contribution of the linear regression is 0 : The contribution of the linear regression is not 0 (1) Before regression, we can only use to estimate (2) After regression, we can use to estimate (3) The regression makes the sum of squared deviations decline (4) To test The contribution of regression is 0, F -statistic is used
  • 15.
    For Example 8.1Conclusion: the regression of the son’s height on the father’s height is statistically significant. The slight difference between these two approaches : t test could be used for both of one-side and two-side problems; ANOVA for two-side only. However, the idea of ANOVA can easily be extended to the cases of nonlinear regression and multiple regression.
  • 16.
    8.2.2 Determinationcoefficient For Example 8.1 Determination coefficient: Contribution of regression by % It reflects that the percentage of the total sum of squared deviations can be explained by the regression. If both of X and Y are random variables ,
  • 17.
    In practice, itis suggested to report the value of determination coefficient after an analysis of regression to describe how good the regression is. Here is a story: : An index of liver function : A score for psychological status Regression is statistically significant, Claimed: “the index for liver function can be improved by psychological consultation” It is wrong? Why?
  • 18.
    8.3 The Applicationof Linear Regression 8.3.1 Two interval estimations 8.3.1.1 Confidence interval for 8.3.1.2 Prediction interval for Y
  • 19.
    8.3.3 Onthe basic assumptions ---- LINE (1) Linear : There exists a linear tendency between the dependent variable and the independent variable (2) Independent : The individual observations are independent each other (3) Normal : Given the value of, the corresponding follows a normal distribution (4) Equal variances : The variances of for different values of are all equal, denoted with .
  • 20.
    In practice, onemay use scatter diagram to observe whether the basic assumptions are met. The assumption of linearity is essential that using a linear model to describe a curvilinear relationship is obviously inappropriate; The assumption of independency is also essential; The violation to the assumptions of normal distribution and equal variance might not seriously affect the least square estimates though all the introduced formulas for statistical inference might not valid. Once the assumptions (1), (3) and (4) are violated, some transformations are worthwhile to try.
  • 21.
    Summary Regressionand Correlation 1. Distinguish and connection Distinguish : Correlation: Both X and Y are random Regression: Y must be random X could be random or not random
  • 22.
    Connection: When both X and Y are random 1) Same sign for correlation coefficient and regression coefficient 2) t tests are equivalent t r = t b 3) Determination Coefficient
  • 23.
    2. Caution --for regression and correlation Don’t put any two variables together for correlation and regression – They must have some relation in subject matter; Correlation and regression do not necessary mean causality ---- sometimes may be indirect relation or even no any real relation;
  • 24.
    A big valueof r does not necessary mean a big regression coefficient b; 4) To reject does not necessary mean that the correlation is strong, only but ; 5) A regression equation is statistically significant does not necessary mean that one can well predict Y by X, only but ; well predict or not depends on coefficient of determination; 6) Scatter diagram is useful before working with linear correlation and linear regression; 7) The regression equation is not allowed to be applied beyond the range of the data set.
  • 25.