Downloaded 965 times
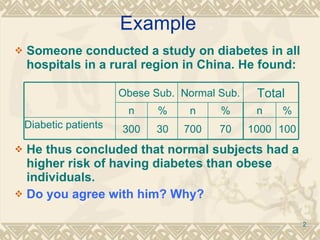
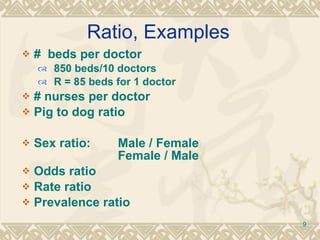
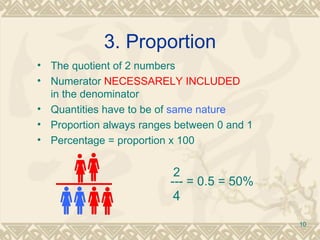
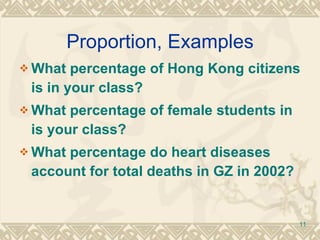
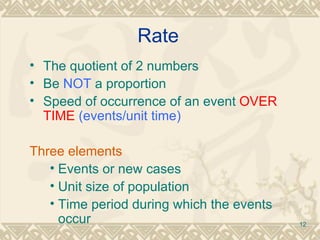
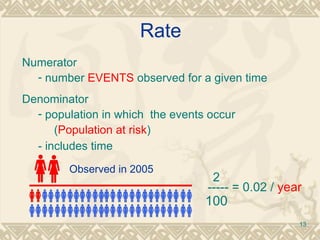
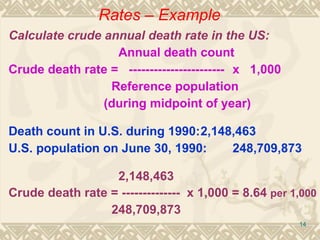
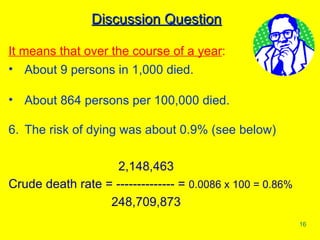
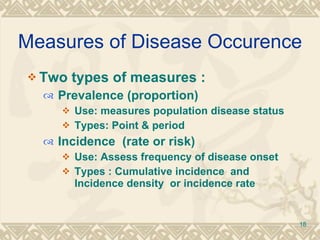
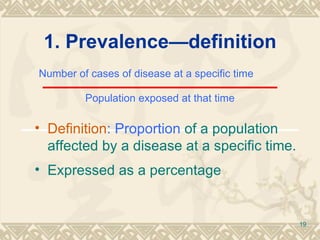
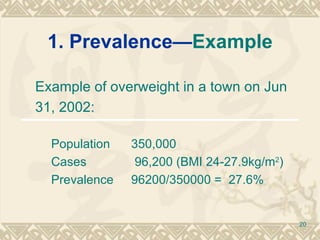
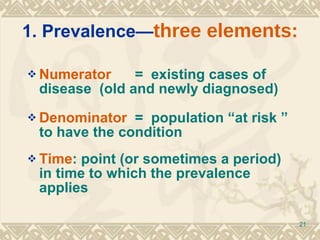
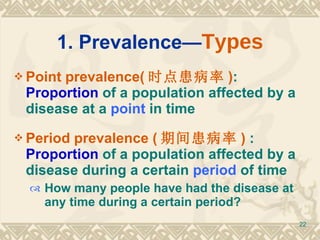
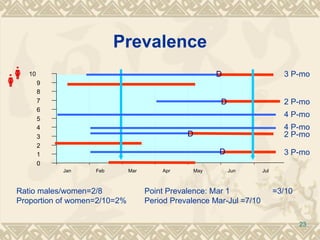
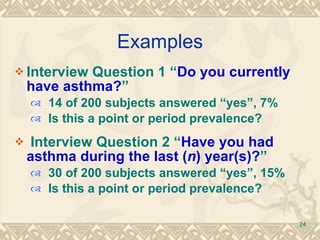
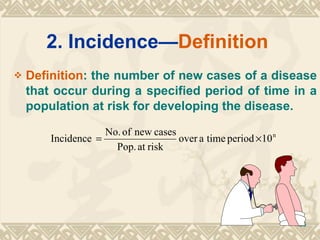
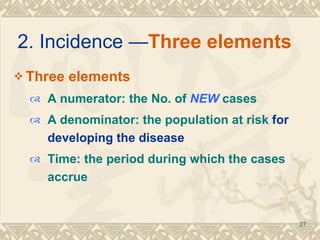
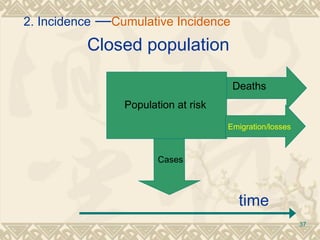
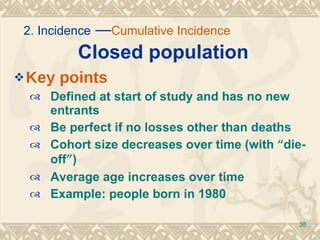
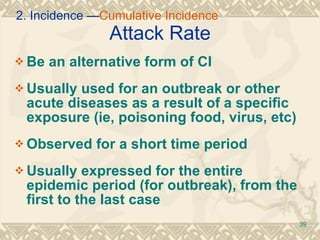
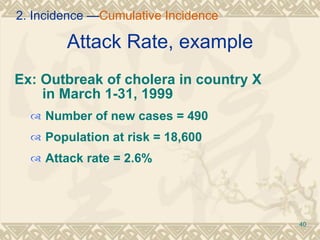
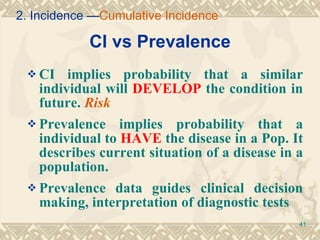
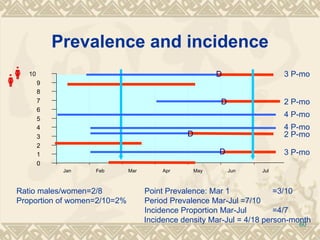
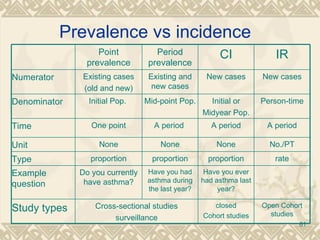
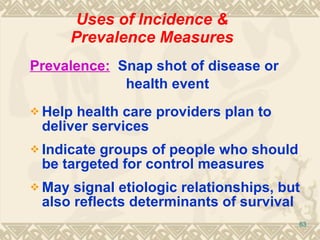
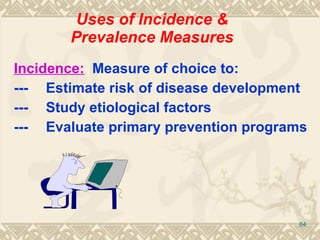


The document defines key epidemiological measures used to describe disease occurrence and impact, including prevalence, incidence, rates, and ratios. It provides examples of how to calculate and interpret these measures. The document concludes that prevalence describes the current disease burden, while incidence provides information on the risk of developing disease over time and is thus better suited for etiological studies.


![Hypothalamus short ppt by Dr. Neha [PT].pptx](https://cdn.slidesharecdn.com/ss_thumbnails/hypothalamusbydr-260124145759-b9f94a93-thumbnail.jpg?width=640&height=640&fit=bounds)


