Wipro reported financial results for the first quarter of fiscal year 2011, with revenues growing 3.1% over the previous quarter and 12.6% over the same quarter last year. Operating profit margins expanded due to effective currency hedges, and net income grew 9% over the previous quarter and 30.5% over the first quarter of fiscal year 2010. The company's performance was driven by strong volume growth in IT services revenues, with new client additions and large deal wins during the quarter. The analyst maintained an "Accumulate" rating on Wipro stock, with a target price representing 13% upside.
1) Bharti Airtel reported a 17.4% year-over-year revenue growth to Rs. 12,231 crore in the first quarter of FY2011, aided by the acquisition of Zain Africa.
2) However, operating margins declined by 518 basis points to 36.1% due to higher sales, general and administrative expenses, network operating costs, and access costs.
3) Net profit declined by 32% year-over-year to Rs. 1,682 crore due to a net loss reported by the African operations, higher interest costs, depreciation, and taxes. Excluding Africa, net profit fell 23% due to margin pressure.
Mphasis reported 4.8% quarter-over-quarter revenue growth to Rs. 1,279 crore for 3QFY2010. The company saw mixed performance, with strong volume growth in application and ITO segments, but steep pricing cuts of 9.6% in applications. Margins declined slightly due to pricing changes and salary hikes, but were supported by restructuring in BPO and cost optimization in ITO. Revenue was driven by financial services, technology, and healthcare verticals, while telecom declined due to client issues. The company added 22 new clients spanning industries and saw improved wallet share with existing clients.
Infosys reported a 4.3% quarter-over-quarter growth in revenues to Rs. 6,198 crore for the first quarter of fiscal year 2011, backed by a 7.6% growth in volumes. However, earnings before interest and taxes (EBIT) margins fell by 1.8% due to annual wage hikes. Infosys revised its fiscal year 2011 revenue growth guidance upwards from 16-18% to 19-21% in rupee terms and maintained its earnings per share growth guidance of 7.2-11.5%. The growth was broad-based across services and verticals led by the banking, financial services and insurance sector.
Infosys reported strong revenue growth of 12.1% quarter-over-quarter for 2QFY2011, driven by persistent volume growth of 7.2% and better business mix. Operating margins rebounded to 33.3% from cost efficiencies. The company revised its FY2011 revenue guidance upwards to 24-25% growth and EPS growth to 10.4-12.2% in US dollar terms. Broad-based growth was seen across industries like retail, BFSI, and manufacturing as well as geographies like Europe and the US. Hiring continued to be strong though utilisation improved.
Exide Industries reported a 35.1% increase in net profit for 1QFY2011 compared to the previous year. Net sales grew 27.5% year-over-year to Rs1,152 crore, exceeding estimates. Earnings before interest, taxes, depreciation, and amortization margins improved from the previous quarter due to a decline in other expenditures. The analyst maintains an "Accumulate" rating for Exide Industries due to reasonable valuations and expects net sales and profit to grow annually over the next two years.
Exide Industries reported a 35.1% increase in net profit for the first quarter of fiscal year 2011. Net sales grew 27.5% due to a substantial increase in both original equipment and replacement auto battery sales. While raw material costs increased, operating margins improved on a quarter-over-quarter basis due to a decline in other expenditures and average lead prices. The analyst maintains an "Accumulate" rating for Exide Industries due to reasonable valuations and expectations for continued double-digit revenue and earnings growth over the next two fiscal years.
Wipro reported strong financial results for the fourth quarter of fiscal year 2010, with revenue growth of 1.9% quarter-over-quarter and 6.7% year-over-year in rupee terms. Revenue growth was broad-based across business segments and verticals, aided by improved client spending and a recovery in challenged industries. Margins declined slightly due to wage increases and higher spending, but the bottom line grew due to robust other income and lower depreciation costs. Looking ahead, Wipro expects continued revenue growth driven by volume increases and large deals, though margins may be impacted in the current quarter by wage hikes and performance bonuses.
TCS reported strong financial results for the 1QFY2011 quarter that exceeded analyst estimates. Revenue grew 6.2% quarter-over-quarter to Rs. 8,217 crore, driven by an 8.1% increase in business volumes. Operating margins declined slightly due to wage increases and currency fluctuations impacting costs. Net profit declined 5.3% due to higher foreign exchange losses and taxes. The analyst maintains a positive outlook due to TCS's strong deal pipeline and hiring growth, but notes concerns around the European economic situation and currency movements. The stock is recommended as an "Accumulate" with a target price of Rs. 920.
Jyoti Structures reported a 20.3% year-over-year growth in net profit to Rs. 25 crores for the fourth quarter of FY2010, slightly below estimates. Operating margins expanded more than expected by 235 basis points to 12.8% due to lower raw material costs. For the full year, net profit grew 15.3% to Rs. 92 crores on sales of Rs. 2,006 crores. The company maintained its buy recommendation with a target price of Rs. 215, citing the large investments planned for power transmission and the company's position as a top player in the industry.
All cargo result update 1 qcy2010 050510Angel Broking
Allcargo Global Logistics' 1QCY2010 consolidated results were above expectations due to strong pick-up in volumes across segments. While revenues grew by 21.9% year-over-year, operating profit grew by a mere 2.7% due to inability to fully pass on increased freight rates in the ECU line, resulting in margin erosion. However, lower interest expenses and tax rate led to a 23.2% jump in net profit. The company maintained a neutral outlook while being well positioned in container segments.
1) Marico reported a 13.4% increase in quarterly revenue to Rs. 790.1 crore, above estimates, led by 16% volume growth in its core brands Parachute and Saffola.
2) Earnings grew 27% to Rs. 73.7 crore after adjusting for tax rate declines, despite margins contracting.
3) The analyst upgrades Marico stock from "Reduce" to "Neutral" and increases earnings estimates by 2-3% based on strong volume growth and lower taxes boosting profits.
MPL Result Update 4qfy2010-030510-finalAngel Broking
Madhucon Projects reported disappointing results for the fourth quarter of fiscal year 2010 that were below expectations. While revenue grew robustly due to higher subcontracting in the power segment, operating margins hit a historical low of 6.4% due to the heavy subcontracting. The analyst maintains a "Buy" rating but lowers the target price to Rs. 190 per share based on revised estimates factoring in lower margins and a higher holding company discount applied to the valuation of Madhucon Infra subsidiary. Near-term revenue visibility comes from existing power segment orders but margins are expected to remain under pressure from ongoing subcontracting.
McNally Bharat Engineering Co. Ltd. (MBE) reported disappointing financial results for the first quarter of fiscal year 2011, with revenues, earnings, and margins coming in below previous estimates. While MBE's order backlog remains strong at Rs. 4,803 crores, providing high revenue visibility, its subsidiary McNally Sayaji also saw subdued performance. However, analysts maintain a 'Buy' recommendation due to MBE's experience in various sectors, ongoing government infrastructure spending, and significant projected market opportunities over the next few years totaling Rs. 51,600 crores. Estimates have been revised downward to account for the weak quarterly performance.
The document provides an analysis of Consolidated Construction Consortium's (CCCL) 4QFY2010 results and outlook. Some key points:
- CCCL reported 33.2% revenue growth for 4QFY2010 inline with estimates, but order inflow for FY2010 was below expectations at Rs2,166cr.
- The company's current order book stands at Rs3,392cr, providing 1.4x revenue visibility for FY2011, which is lower than peers.
- The analyst expects 19.2% revenue CAGR for CCCL over FY2010-2012 on the back of its order book and recovery in private capex.
- C
1) For 1QCY2010, FAG Bearing reported a 25.2% year-over-year growth in net sales to Rs237.4cr, in line with expectations. Operating margins declined by 417 basis points to 15.3% due to higher raw material costs.
2) Net profit grew 61.4% year-over-year to Rs22.5cr, with the company meeting performance expectations for the quarter.
3) The analyst maintains a "Buy" rating on the stock, with a target price of Rs712, as revenue growth is expected to be driven by new products and there is upside potential to earnings estimates if industrial production growth increases.
Tech Mahindra reported a 4.2% quarter-over-quarter decline in revenue for the first quarter of fiscal year 2011, which was attributed to adverse currency movements and slower client decision making. The company's profitability declined as well, with earnings before interest, taxes, depreciation, and amortization margins contracting 480 basis points and net income declining 36.4% compared to the previous quarter. However, revenue grew 1.9% year-over-year and management expects growth to be led by strong volume increases from large transformational deals in the pipeline. While the outlook remains positive, uncertainties around currency fluctuations and aggressive hiring could pressure margins going forward.
Cinemax India posted modest revenue growth of 34.1% in 4QFY10 aided by seat additions and big-budget movies, but operating margins declined 138bps due to higher film distribution and rent expenses. Bottom-line grew 353% due to negative tax provisions. The analyst maintains a Buy rating but lowers FY2011-12 estimates and target price to Rs85 due to lower revenue growth expectations and higher costs.
SAIL's 4QFY2010 results were in line with estimates. Revenues grew 1.8% to Rs11,955cr due to higher sales volumes and average realization. EBITDA margins expanded significantly to 25.9% due to lower raw material costs and consumption, leading to a 40.2% rise in net income to Rs2,085cr. While demand is expected to remain strong, the company maintains a neutral outlook given rich valuations and plans for a public offering limiting further upside.
Consolidated Construction Consortium (CCCL) reported net sales of Rs.508 crore for 1QFY2011, in line with expectations. Operating margins of 8.3% and net profits of Rs.18.8 crore were also as expected. Order inflows grew 152% year-over-year to Rs.1,706 crore, indicating a revival in commercial and infrastructure segments. CCCL maintains an order backlog of Rs.4,527 crore, providing visibility for the next few years. While margins and profits met estimates this quarter, analysts maintain an 'Accumulate' rating given strong order backlog and expected 20% earnings growth over FY2010-12.
3i Infotech reported subdued quarterly results with a 1.4% increase in revenue. EBITDA margins declined slightly despite a 10% wage hike. The bottom line declined from the previous quarter due to higher costs and taxes, though it improved year-over-year. The company maintained its full-year revenue guidance, expecting growth of 11-14% driven by a strong order backlog. While initiatives to boost integrated offerings are expected to drive long-term growth, margins may be pressured in the near-term from operational investments. The report maintains a Buy recommendation based on a revised target price implying a 6x forward P/E multiple.
1) Finolex Cables reported a 50.4% year-over-year increase in net sales to Rs. 493.1 crore for the first quarter of FY2011, driven by strong growth in the electrical cables segment.
2) Operating margins declined to 8% from 15.2% in the prior year quarter due to higher raw material costs, though margins improved sequentially.
3) Net profit increased 4.5% year-over-year to Rs. 23 crore for the quarter despite margin pressure, with sales growth offsetting higher costs.
Reliance Communication's quarterly performance failed to meet expectations, with wireless revenue growing only 1.7% compared to the industry average. While the company surpassed 100 million subscribers, its broadband and global business segments saw declines. Profits grew 10.1% due to higher interest earned, but margins fell due to higher network and access costs. Going forward, profitability is expected to come under pressure from increased leverage for capex spending and acquiring 3G licenses.
TV Today Network reported quarterly revenue growth of 46.9% year-over-year to Rs78.9 crore, aided by steady growth in its broadcasting business and the amalgamation of its radio business. However, the company reported a loss of Rs10.1 crore for the quarter compared to a profit of Rs8.1 crore last year, with its operating margin contracting significantly, owing to losses incurred in its newly amalgamated radio business. For the full year, TV Today reported revenue growth of 13.9% but net profit declined 7.9% due to a Rs38 crore loss in the radio business. The analyst downgraded the stock to Neutral given losses in the radio business and a
CESC reported a 33.7% year-over-year growth in revenue for the first quarter of fiscal year 2011, driven by the commissioning of its new 250MW Budge-Budge power plant. However, operating margins declined from the previous quarter due to a 90.6% year-over-year increase in other expenses. While revenue beat estimates, net profit growth was moderate at 4.8% year-over-year due to higher expenditure, growing at a faster pace than revenues. The company continues construction on its 600MW Chandrapur and Haldia power projects.
Crompton Greaves reported a 4.7% year-over-year increase in consolidated sales to Rs. 2,302 crores for the first quarter of FY2011. EBITDA grew 19.8% to Rs. 297 crores due to lower expenses and improved operational efficiencies. Net profit increased 19.5% to Rs. 190.8 crores. The consumer products and industrial systems segments saw robust growth, while the power systems segment remained weak with a 1.9% sales decline. Going forward, the company expects its power systems segment, which accounts for 63% of revenue, to drive growth as massive capacity expansion in the power sector provides investment opportunities in transmission and distribution.
HDIL reported marginally higher than expected 4QFY2010 results. Revenue was driven by TDR sales of 1.48 million square feet from its Mumbai International Airport project. The company has pre-sold 75% of residential projects launched since FY2009, providing Rs2,600 crore in revenue visibility over FY2010-12. The company plans to launch another 5-6 million square feet in FY2011. While execution of the MIAL project and new launches provide growth visibility, delays in relocating families for the MIAL project phase 1 and recent management changes have hurt the stock price. The analyst maintains a Buy rating with a target price of Rs302 per share.
FAG Bearing recorded strong results for the second quarter of 2010, with net sales growing 35% year-over-year to Rs. 273 crore, beating estimates. Operating profit increased 66% to Rs. 52 crore due to lower raw material costs and improved operating leverage. Net profit surged 82% to Rs. 33.8 crore, aided by robust top-line growth and lower taxes. The analyst maintains a "Buy" rating and revised earnings estimates upward based on the company's solid performance.
Infotech Enterprises reported modest revenue growth of 2% for the fourth quarter of fiscal year 2010. Net profit increased 35% due to a 130% rise in other income and lower taxes. While revenue from the engineering and manufacturing segment grew 6%, the utilities, telecom, and government segment declined 6%. Looking forward, the company expects strong revenue growth driven by its order pipeline and improving business environment. The analyst maintains a 'Buy' rating with a target price implying 20% upside.
The key Indian indices opened higher supported by strong Asian markets and quarterly results. Gains were trimmed in the afternoon but markets recovered on buying in metal, realty and auto stocks. The Sensex and Nifty ended up 0.7%.
IVRCL won its first international contracts worth $440 million in Saudi Arabia and Nepal, diversifying geographically. BGR Energy won a $490 million contract in India. Allcargo Global acquired controlling stakes in Hong Kong logistics firms, expecting to boost earnings. Market sentiment was positive supported by company results and deals.
Ambuja Cement reported a 20.5% year-over-year increase in net profit for the second quarter of 2010 due to a substantial rise in shipments. Operating profit grew 23.7% year-over-year as operating margins expanded. The company expects ongoing capacity additions to support continued healthy shipment growth. Analysts maintain a neutral rating on Ambuja Cement, seeing the stock as fairly priced based on estimated 2011 earnings and capacity.
GlaxoSmithKline Pharma reported lower-than-expected 2QCY2010 results with net sales of Rs. 498 cr, up 8.9% YoY, and net profit of Rs. 129 cr, up 3.7% YoY. Sales were impacted by supply constraints in the vaccine segment. While operating margins improved, other income declined by 28.9% YoY. Given the company's rich valuations trading at 31.5x CY2010 earnings, Angel Research maintains a Sell rating with a target price of Rs. 1,700.
South Indian Bank reported a net profit of 77 crore for the second quarter of fiscal year 2011, exceeding analyst estimates. Business growth was strong, with advances growing 35.7% year-over-year and deposits growing 27.3% year-over-year, driven by increased lending against gold and to small and medium enterprises. However, the analyst maintains a neutral rating due to concerns that the stock is trading at a valuation of 9.6 times estimated earnings for fiscal year 2012, which is considered expensive relative to peers and its own historical range.
For the second quarter of fiscal year 2011, Amara Raja Batteries reported an 8.7% increase in net sales to Rs. 392.5 crore, below expectations. EBITDA margins declined significantly by 909 basis points due to higher lead prices and lower realization from the telecom battery segment. Net profit declined 33.8% year-over-year to Rs. 31.6 crore. The company maintained its positive outlook for battery demand growth but expects current lower prices in telecom batteries to restrict earnings growth in the near term.
The market summary provides an overview of the performance of key indices and sectors in the Indian market on the given date. The Nifty and Sensex opened higher and traded in a narrow range before closing with minor gains. On a sectoral basis, automobiles and metals performed positively while oil & gas and technology saw declines. Top gainers were led by Tata Motors and Kotak Bank, while top losers included Bharti Airtel and Axis Bank. The technical analysis indicates the market may test resistance levels in the coming sessions if indices trade above certain thresholds. Key support and resistance levels are also provided for various stocks.
The Indian stock market opened higher tracking gains in Asian markets but pared some gains later in the day. The key indices - Sensex and Nifty - closed with gains of 0.6% each. IT and realty stocks led the gains early on while industrial production data weighed on the markets later. Mid-cap and small-cap indices also ended higher. Container traffic growth and results from Sintex Industries were in line with expectations. Exide Industries and Infosys are scheduled to report quarterly results today. The markets are expected to trade in a range with support and resistance levels provided.
Gateway Distriparks reported quarterly results that were marginally below estimates. Revenue growth was driven by a 24.2% year-over-year increase in the higher-margin Rail business. However, CFS revenues fell 9.2% due to a fire. Profits increased significantly due to tax write backs. While funds from Blackstone were slightly delayed, management expects funds in the next quarter and for Rail to break even on profits this fiscal year. Falling market share at a key container terminal remains a concern.
Reliance Industries reported lower-than-expected quarterly results, with profits impacted by lower-than-expected refining margins. Revenue grew 120.7% year-over-year primarily due to higher refining revenues, but margins were lower than estimates. While volume growth was strong, profitability was hurt by refining margins of $7.5/bbl compared to an estimated $8.5/bbl. The analyst maintains a buy rating due to expectations for margin improvement and inorganic growth opportunities.
This document summarizes derivative market activity in India for July 13, 2010. Open interest for Nifty futures increased by 2.28% while open interest for Mini Nifty futures rose by 7.65%. Put-call ratios increased slightly. Foreign institutional investors were net buyers of index futures, stock futures, and cash equities. Opto Circuits, Polaris, and Rolta saw significant increases in open interest, while open interest declined for CESC, Yes Bank, and Bosch.
The markets opened on a flat note and closed lower, with losses in most sectors. Key indices the Nifty and Sensex fell 0.39% and 0.47% respectively. On technical charts, the markets are showing a sideways movement for three days with no clear trend. Support levels are at 6043-6000 for Nifty and 20088-19968 for Sensex, while resistance is at 6200-6250 and 20578-20720 respectively. Top gainers were Maruti, RelCapital and ITC, while top losers included BhartiAirtel, HindustanUnilever and Tata Steel. Most sectors closed lower led by PSU, Metal and Bankex.
- The open interest for Nifty futures decreased by 1.45% while Minifty futures decreased by 10.73% as the market closed at 6101.50 levels.
- Nifty October future closed at a premium of 33.65 points, while November future closed at a premium of 57.45 points. The PCR-OI increased from 1.18 to 1.27.
- Implied volatility of at-the-money options decreased from 19.50% to 18%. Total open interest of the market is Rs. 1,88,691cr and stock futures open interest is Rs. 53,447cr.
The market opened flat but saw selling pressure in the second half of the session, closing in negative territory. Key indices like Nifty and Sensex fell by around 0.6-0.7%. On the sectoral front, oil & gas and realty saw losses of around 1-1.3% while auto saw gains of 0.7%. Top gainers were from diverse sectors like ABB, BPCL, and Sun Pharma rising over 1.5%, while top losers were RELIANCE, Hindustan Unilever, and IDFC falling over 3%. Technical charts show the indices breaking below an upward trendline, and more downside is possible if levels around 5380/17920 are broken.
The document provides a summary of derivative market activity and analysis for India on June 14, 2010. It discusses changes in open interest for various indexes and stocks. It also analyzes option strategies like bull call spreads and bear put spreads for the Nifty. The document concludes with notes on ongoing derivative strategies and a disclaimer.
India cements result update 4 qfy2010-060510Angel Broking
India Cements reported an 8.6% increase in revenue for the fourth quarter of fiscal year 2010 but margins declined. Revenue grew due to a 26.5% rise in cement sales volumes but realizations fell 19.4% due to excess capacity. Margins fell due to higher raw material and freight costs, causing net profit to decline 59.2% year-over-year. The analyst recommends buying the stock based on valuation and expects capacity expansion projects to be completed on schedule.
NTPC reported a 7.8% year-over-year increase in net sales to Rs. 12,944 crores in the first quarter of fiscal year 2011, driven by lower plant load factors. Operating profit fell 9.6% year-over-year to Rs. 3,345 crores due to higher fuel and employee expenses. Net profit declined 16.1% to Rs. 1,842 crores for the quarter. While NTPC added new capacity, plant load factors declined for some key plants, affecting power generation and margins. The company plans further large capacity additions over the next two fiscal years to drive future growth.
- The Indian stock market indices opened higher and continued trading in positive territory in the morning, but turned volatile in the late afternoon and closed marginally higher.
- TVS Motor plans to invest Rs. 200 crore to increase its two-wheeler production capacity, while RIL is close to inking a deal with DE Shaw to launch a $700-800 million infrastructure fund.
- Corporate news included Tata Motors planning to raise up to Rs. 4,700 crore and ONGC expecting to start gas production from a block in 2016-17.
Wipro reported strong financial results for the 4th quarter of fiscal year 2010, with revenue from IT services growing 3.5% quarter-over-quarter and 11% year-over-year. While revenue growth was slightly lower in rupee terms due to currency fluctuations, the company saw broad-based growth across services and verticals driven by improved client spending. Going forward, the company expects to see continued volume-led growth supported by focus on non-linear initiatives. The analyst maintains an "Accumulate" rating on Wipro stock with a target price representing an upside of 13%.
Ashok Leyland reported a 141.3% year-over-year growth in net sales to Rs2,939 crore for the fourth quarter of fiscal year 2010, in line with expectations. Net profit grew 317.6% year-over-year to Rs222.7 crore, higher than expected due to better operating margins and a change in depreciation policy. Operating margins increased 345 basis points due to price hikes, lower raw material prices, and cost reduction efforts. The company expects commercial vehicle industry volumes to grow 15-18% in fiscal year 2011.
Hindalco reported strong results for the first quarter of fiscal year 2011. Revenue grew 29.2% year-over-year to Rs. 2,533 crore, driven by a 12.7% increase in aluminum shipments. Adjusted EBITDA more than doubled to Rs. 263 crore, resulting in adjusted EBITDA margins of 10.4%. However, net profit declined 65% to Rs. 50 crore due to higher interest and tax expenses. Management expects continued growth in demand and benefits from capacity expansions. The stock currently trades at attractive valuations and the analyst maintains a Buy rating with a target price of Rs. 204.
Container Corporation of India's (Concor) 1QFY2011 results were below expectations due to lower lead distances and terminal charges pulling down Exim performance. Revenue grew 0.9% year-over-year to Rs. 916 crore, below estimates, with Exim revenue falling 0.6% due to lower realizations and rent. Modest Exim volume growth of 7.8% despite robust port growth indicates losing market share to private players. EBITDA margin of 27% beat estimates but profit fell 3.7% to Rs. 194 crore due to Exim weakness. Management expects new railway policies to benefit Concor from FY2012 but no revenue impact in FY2011. The report maintains
1) For 1QFY2012, Persistent Systems reported revenues of ₹224 crore, up 5.2% over the previous quarter and 23.6% over the same period last year.
2) EBITDA was ₹40 crore, up 5.3% over the previous quarter but margins declined.
3) PAT was ₹28 crore, down 16.8% over the previous quarter due to higher taxes.
4) Management maintained revenue guidance of 29% growth for FY2012 and expects PAT to remain flat despite higher tax rates.
Idea Cellular reported strong revenue growth of 22.8% year-over-year for the first quarter of FY2011, however margins declined. While revenue was ahead of estimates due to increased mobile usage and subscribers, earnings before interest, taxes, depreciation and amortization (EBITDA) margins fell 4.6% from the prior year due to higher operational costs. Net profit declined 32.2% from the prior year and 24.5% sequentially. The analyst maintains a "Reduce" rating on Idea Cellular shares and sets a target price of Rs58.
Elecon Engineering reported a 15% increase in revenue for the first quarter of fiscal year 2011. While operating margins declined slightly, net profits increased 57% due to a 32% decrease in interest costs. The company maintains a strong order backlog of Rs1,582 crore, providing revenue visibility. Recovery in the industrial sector and opportunities in material handling equipment are expected to drive continued growth for Elecon Engineering.
Elecon Engineering reported a 15% rise in revenue for the first quarter of fiscal year 2011. While operating margins declined slightly, profit grew 57% due to a 32% drop in interest costs. The company has a robust order backlog of Rs1,582 crore, offering high revenue visibility. Going forward, recovery in the industrial sector and opportunities in material handling equipment are expected to drive continued growth for Elecon Engineering.
Cipla reported 1QFY2011 results that were ahead of estimates, with operating margins improving sequentially. While domestic formulation sales grew only 3.6% due to lower generic sales, export sales increased 14.4% due to growth in ARV and anti-asthma segments. Operating margins expanded to 20.9% due to lower other expenses. Net profit grew 6.5% to Rs257cr from higher margins and other income. The company expects its new Indore facility to start contributing significantly over the next 6-12 months and sees this aiding substantial future growth. The report recommends buying the stock.
Hindalco reported financial results for the first quarter of fiscal year 2011. Net revenue increased 32.9% year-over-year to Rs. 5,146 crore, driven by higher aluminum and copper volumes and prices. EBITDA grew 9.9% to Rs. 832 crore while net profit increased 11.2% to Rs. 534 crore. Hindalco is expanding aluminum production capacity significantly over the next few years, which is expected to drive further revenue and profit growth. The analyst maintains a Buy recommendation on Hindalco shares.
TCS reported strong financial results for the fourth quarter of fiscal year 2010 that exceeded expectations. Revenue grew 1.1% over the previous quarter to Rs. 7,737 crore, driven by a 4% increase in volumes. However, currency fluctuations reduced realized revenue. Improved operating levers helped expand operating margins by 19 basis points sequentially and 368 basis points year-over-year. Strong other income and profit growth of 7.4% sequentially and 47.1% year-over-year exceeded forecasts. The company added over 10,000 employees in the quarter and closed 10 large deals.
Nagarjuna Construction Company (NCC) reported disappointing 1QFY2011 results with revenues growing only 8.5% year-over-year, below expectations. Operating margins were in line with estimates at 9.7% however. The company maintained full-year revenue guidance of Rs5,800cr. NCC has a strong order backlog of Rs16,051cr, providing revenue visibility. While results were below estimates, management sees potential in its diversified operations and order backlog. The stock remains undervalued and analysts maintain a "Buy" rating given growth opportunities.
Bharat Forge reported strong results for 1QFY2011 with net sales growing 75.7% year-over-year to Rs 630.1 crore, beating estimates. Operating margins improved significantly to 25.2% due to lower raw material costs and higher utilization levels. Net profit was Rs 59.4 crore, exceeding expectations due to improved volumes and operating leverage. The analyst recommends accumulating the stock given the better-than-expected performance and revised upward estimates.
Steel Authority of India reported a 1.7% decline in EBITDA to Rs. 1,843 cr for the first quarter of FY2011, below Angel Research's estimate, due to lower sales volume and higher staff costs. Net profit declined 11.3% to Rs. 1,177 cr for the same reasons. While steel prices increased, sales volume fell 15.5% from a year ago. Staff costs rose sharply due to additional provisions for employee benefits. Going forward, the company is expected to benefit from strong domestic demand, but capacity expansion benefits will only be seen after FY2012. Angel Research maintains a Neutral rating on the stock.
Graphite India reported a 66% year-over-year increase in 4QFY2010 sales, in line with estimates. Full year FY2010 sales fell 10.1%, lower than expected, due to lower production at the company's German facility. However, operating margins increased to a strong 29.4% for FY2010 due to higher realizations. Going forward, the company is well positioned for growth due to increasing demand from the steel industry and its capacity expansion plans. The report maintains a "Buy" recommendation on the stock based on its attractive valuation and growth outlook.
Crompton Greaves reported strong quarterly results with net profit growth of 39.9% year-over-year. While revenue growth was modest at 1.9%, the company significantly expanded operating margins. The strong performance was driven by growth in standalone business and improved margins in international operations despite a revenue decline. The company maintained its guidance for revenue and profit growth in the current fiscal year.
Crompton Greaves reported strong quarterly results with net profit growth of 39.9% year-over-year. While revenue growth was modest at 1.9%, the company significantly expanded operating margins. The strong performance was driven by growth in standalone business and improved margins in international operations despite a revenue decline. The company maintained its guidance for revenue and profit growth in fiscal year 2011.
Reliance Industries reported lower-than-expected earnings for 1QFY2011. While net operating income rose 86.7% year-over-year due to growth in refining revenues, EBITDA was below estimates due to lower petrochemical sales volumes and refining margins. Net profit grew 32.3% year-over-year, meeting estimates. The analyst maintains a 'Buy' rating based on the company's growth outlook and believes it is undervalued relative to its peers.
Sun TV reported strong 1QFY2011 results with 53% year-over-year revenue growth and 43% PAT growth. Revenues grew due to a 50% increase in advertising revenue, 84% growth in DTH subscription revenue, and 42% growth in analogue subscription revenue. Operating margins expanded 397 basis points to 81.7% due to cost rationalization and operating leverage. The company maintained its Accumulate rating based on continued earnings and cash flow growth despite increasing its FY2012 EPS estimates 2-5% to account for margin expansion.
The Indian markets are expected to open higher, tracking gains in most Asian markets. Spain has asked for a bailout of up to €100 billion for its banking system. Chinese exports grew more than expected in May. In India, shares extended gains for a fifth session despite weak global cues as major central banks held off on additional stimulus. The key support and resistance levels for the Nifty are 5,023 and 5,114 respectively. L&T has bagged orders worth Rs. 483 crore to build commercial vessels in Qatar. Vedanta Resources has acquired a 24.5% stake in Raykal Aluminium for Rs. 201 crore.
Axis Bank reported a 27.0% year-over-year increase in net profit to Rs. 942 crore for the first quarter of fiscal year 2012, in line with analyst estimates. Business growth momentum slowed as advances declined 7.4% quarter-over-quarter and deposits fell 3.0% quarter-over-quarter, moderating the bank's cash-deposit ratio to 40.5% from 41.1% last quarter. However, asset quality remained healthy with slippage ratio declining to 0.8% and gross and net NPA ratios stable.
1) For 1QFY2012, Electrosteel Castings reported 16.4% sales growth but margins declined due to higher raw material costs. EBITDA fell 18.2% and net profit declined 7.2%.
2) While sales volumes grew, costs increased more due to a rise in raw material costs as a percentage of sales.
3) The company maintains a buy recommendation due to initiatives in steelmaking and backward integration that should lower costs starting in FY2013 and valuation remains attractive.
HT Media reported a 22.7% year-over-year increase in revenue to ₹494 crore for the first quarter of FY2012. Revenue was also up 5.8% quarter-over-quarter. Advertising revenue grew 17% year-over-year, with 18% growth in English and 15% growth in Hindi. Operating profit rose 11.8% year-over-year to ₹87.8 crore due to higher other income and lower tax rates, although operating margins contracted by 174 basis points. The company maintained its Accumulate rating based on expectations of continued revenue growth and margin expansion.
The summary is:
1) The derivative report analyzes the performance of the Nifty futures, options, and key stocks from the previous trading session on July 18, 2011.
2) It provides details on changes in open interest, premium levels, volatility, and turnover for various derivatives contracts.
3) Trading strategies and technical analysis is also given for some stocks along with risk-reward profiles of sample spreads trades for the Nifty.
The market ended lower, with the Sensex and Nifty closing down 0.3%. Mid- and small-cap indices closed higher. Select heavyweights like Hindalco Industries and BHEL gained 1-3%, while TCS and Tata Motors lost 1-2%. In corporate news, Motherson Sumi Systems agreed to acquire an 80% stake in Peguform for €141.5 million. HDFC Bank, Cadila Healthcare, Crompton Greaves, and Ashok Leyland are scheduled to announce their quarterly results. The trend for the day will be decided by whether Nifty trades above or below the levels of 18,533/5,572 in early trade.
- GSM subscriber additions in India continued their declining trend in June 2011, with net additions of 9.6 million, down 10% from the previous month.
- All major operators except BSNL reported a drop in subscriber additions. Bharti and Vodafone each added 2.1 million subscribers.
- The total GSM subscriber base reached 598.8 million in June 2011, with Bharti, Vodafone, Idea and BSNL maintaining their major market shares.
The document provides a technical analysis of the Indian stock market indices Sensex and Nifty for the week of July 16, 2011. It summarizes that the indices declined over 1.5% for the week and are currently trading in a range between 18,326/5496 on the downside and 19,132/5740 on the upside. It notes that a break above or below this range would dictate the direction of the upcoming trend. The analysis also lists pivot levels for 50 Nifty stocks to watch in the coming week.
The document provides a summary of derivative market activity in India for July 18, 2011. Key points include:
- Nifty futures open interest increased 0.67% while Mini Nifty increased 3.48% as the market closed at 5581.10
- Nifty July futures closed at a premium of 5.85 points and August futures at a premium of 22.60 points
- Implied volatility of at-the-money options decreased from 18% to 17.3%
- Total open interest in the market was Rs. 135,158 crore with stock futures open interest at Rs. 34,675 crore.
The indices opened flat but traded choppily throughout the day. Metal, auto and realty stocks declined while IT stocks gained. The indices are currently trading in a range between 18,326-18,810/5496-5653 on the downside and 19,132-19,094/5740-5700 on the upside. A break above these resistance levels could lead to further gains while a break below support could result in losses extending to 17,805-17,950/5350-5400. Pivot levels for 50 Nifty stocks are provided.
- The key Indian stock indices declined slightly, with the Sensex and Nifty closing down 0.3%.
- GSM subscriber additions in India continued their declining trend in June across most major operators such as Idea, Bharti Airtel, and Vodafone. Total GSM subscriber addition was 9.6 million, down 10% from the previous month.
- Tata Motors reported flat annual global sales growth in June 2011 compared to the previous year.
- South Indian Bank reported a 41.2% year-over-year increase in net profit to Rs. 82 crores for the first quarter of fiscal year 2012, slightly below analyst estimates.
- Business growth remained strong, with advances growth of 31.2% and deposits growth of 35.5% year-over-year. However, net interest margins compressed by 29 basis points sequentially to 2.8% due to a sharp rise in the bank's cost of deposits.
- Non-interest income was boosted by treasury gains, but fee income growth was modest. Asset quality was stable with gross and net NPAs rising marginally, and provision coverage at a comfortable 73.1%.
Bajaj Auto reported marginally lower-than-expected results for the first quarter of fiscal year 2012, with net sales growth of 22.8% year-over-year driven by a 17.7% increase in volumes. However, operating margins contracted by 145 basis points quarter-over-quarter to 19.1% due to a 150 basis point increase in raw material costs. As a result, net profit grew by 20.5% year-over-year to ₹711 crore, which was slightly below analyst estimates. Going forward, the analyst expects further margin pressure and has revised downward its earnings estimates for fiscal years 2012 and 2013 to factor in higher raw material costs and changes to export incentives.
1) Tata Consultancy Services (TCS) reported strong results for the first quarter of fiscal year 2012, outperforming expectations with revenue growth of 6.3% over the previous quarter and 31.4% over the same quarter of the previous fiscal year.
2) A key highlight was 7.4% quarter-over-quarter growth in business volumes. While profit margins declined due to wage hikes, net profit remained flat due to foreign exchange gains.
3) Management maintained a positive outlook, highlighting strong demand environment and deal pipeline, and expects pricing increases later in the fiscal year.
The document summarizes the Indian stock market outlook and performance on July 15, 2011. It reports that domestic indices closed with modest gains of 0.1-0.4%, while global indices declined. Wholesale price inflation in India rose to 9.44% in June 2011, above estimates and persisting above 9% for seven months, driven by increases in primary articles and fuel costs. Key benchmark levels are identified for determining if the market may continue rallying or correct in the near term.
The summary is:
1) The derivative report analyzes the movement in Nifty futures, options, and individual stocks between July 14-15, 2011.
2) Nifty futures open interest decreased while mini Nifty open interest increased as the market closed at 5599.80.
3) Implied volatility of at-the-money options increased from 17.6% to 18%.
The Sensex and Nifty indices opened lower and traded with volatility, closing marginally lower. On the sectoral front, Realty, Banks and Healthcare gained while IT and FMCG fell. The advance-decline ratio favored advancing stocks. On the daily chart, prices tested but did not close above the downward gap area of 18,679-18,589/5,601-5,580 levels. Immediate resistance is seen at 18,735/5,633, while 18,449/5,541 is crucial support.
1) Infosys reported modest revenue growth of 3.2% qoq for 1QFY2012. EBITDA and margins declined due to wage hikes.
2) Guidance for 2QFY2012 revenue growth was lower than expected at 3.5-5% qoq. Annual revenue growth guidance was unchanged.
3) The analyst revised EPS estimates down and cut the target price to INR 3,200 due to macro concerns and muted guidance.
This document summarizes a derivative report from India Research dated July 13, 2011. Some key points:
- The Nifty futures open interest increased 0.51% while Minifty futures open interest rose 8.2% as the market closed at 5526.15.
- Implied volatility of at-the-money options increased from 18% to 19.75%. PCR-OI decreased from 1.20 to 1.15.
- Total open interest of the market is Rs. 125,816 crore and stock futures open interest is Rs. 33,500 crore.
- FII were net sellers of Rs. 969 crore in the cash market segment. Put-call
The daily technical report provides the following information:
1) The Sensex and Nifty indexes opened with a downside gap and remained negative throughout the day, with the realty, IT, and auto sectors among the major losers.
2) On the daily chart, the indexes tested the 20-day simple moving average for support and closed above it, while the RSI and ADX indicators show a negative crossover.
3) The report recommends selling REL. INFRA. futures with a stop loss of Rs. 579.05 and target of Rs. 552.00.
Budgeting as a Control Tool in Government Accounting in Nigeria
Being a Paper Presented at the Nigerian Maritime Administration and Safety Agency (NIMASA) Budget Office Staff at Sojourner Hotel, GRA, Ikeja Lagos on Saturday 8th June, 2024.
What Lessons Can New Investors Learn from Newman Leech’s Success?Newman Leech
Newman Leech's success in the real estate industry is based on key lessons and principles, offering practical advice for new investors and serving as a blueprint for building a successful career.
Confirmation of Payee (CoP) is a vital security measure adopted by financial institutions and payment service providers. Its core purpose is to confirm that the recipient’s name matches the information provided by the sender during a banking transaction, ensuring that funds are transferred to the correct payment account.
Confirmation of Payee was built to tackle the increasing numbers of APP Fraud and in the landscape of UK banking, the spectre of APP fraud looms large. In 2022, over £1.2 billion was stolen by fraudsters through authorised and unauthorised fraud, equivalent to more than £2,300 every minute. This statistic emphasises the urgent need for robust security measures like CoP. While over £1.2 billion was stolen through fraud in 2022, there was an eight per cent reduction compared to 2021 which highlights the positive outcomes obtained from the implementation of Confirmation of Payee. The number of fraud cases across the UK also decreased by four per cent to nearly three million cases during the same period; latest statistics from UK Finance.
In essence, Confirmation of Payee plays a pivotal role in digital banking, guaranteeing the flawless execution of banking transactions. It stands as a guardian against fraud and misallocation, demonstrating the commitment of financial institutions to safeguard their clients’ assets. The next time you engage in a banking transaction, remember the invaluable role of CoP in ensuring the security of your financial interests.
For more details, you can visit https://technoxander.com.
In World Expo 2010 Shanghai – the most visited Expo in the World History
https://www.britannica.com/event/Expo-Shanghai-2010
China’s official organizer of the Expo, CCPIT (China Council for the Promotion of International Trade https://en.ccpit.org/) has chosen Dr. Alyce Su as the Cover Person with Cover Story, in the Expo’s official magazine distributed throughout the Expo, showcasing China’s New Generation of Leaders to the World.
A toxic combination of 15 years of low growth, and four decades of high inequality, has left Britain poorer and falling behind its peers. Productivity growth is weak and public investment is low, while wages today are no higher than they were before the financial crisis. Britain needs a new economic strategy to lift itself out of stagnation.
Scotland is in many ways a microcosm of this challenge. It has become a hub for creative industries, is home to several world-class universities and a thriving community of businesses – strengths that need to be harness and leveraged. But it also has high levels of deprivation, with homelessness reaching a record high and nearly half a million people living in very deep poverty last year. Scotland won’t be truly thriving unless it finds ways to ensure that all its inhabitants benefit from growth and investment. This is the central challenge facing policy makers both in Holyrood and Westminster.
What should a new national economic strategy for Scotland include? What would the pursuit of stronger economic growth mean for local, national and UK-wide policy makers? How will economic change affect the jobs we do, the places we live and the businesses we work for? And what are the prospects for cities like Glasgow, and nations like Scotland, in rising to these challenges?
Madhya Pradesh, the "Heart of India," boasts a rich tapestry of culture and heritage, from ancient dynasties to modern developments. Explore its land records, historical landmarks, and vibrant traditions. From agricultural expanses to urban growth, Madhya Pradesh offers a unique blend of the ancient and modern.
Fabular Frames and the Four Ratio ProblemMajid Iqbal
Digital, interactive art showing the struggle of a society in providing for its present population while also saving planetary resources for future generations. Spread across several frames, the art is actually the rendering of real and speculative data. The stereographic projections change shape in response to prompts and provocations. Visitors interact with the model through speculative statements about how to increase savings across communities, regions, ecosystems and environments. Their fabulations combined with random noise, i.e. factors beyond control, have a dramatic effect on the societal transition. Things get better. Things get worse. The aim is to give visitors a new grasp and feel of the ongoing struggles in democracies around the world.
Stunning art in the small multiples format brings out the spatiotemporal nature of societal transitions, against backdrop issues such as energy, housing, waste, farmland and forest. In each frame we see hopeful and frightful interplays between spending and saving. Problems emerge when one of the two parts of the existential anaglyph rapidly shrinks like Arctic ice, as factors cross thresholds. Ecological wealth and intergenerational equity areFour at stake. Not enough spending could mean economic stress, social unrest and political conflict. Not enough saving and there will be climate breakdown and ‘bankruptcy’. So where does speculative design start and the gambling and betting end? Behind each fabular frame is a four ratio problem. Each ratio reflects the level of sacrifice and self-restraint a society is willing to accept, against promises of prosperity and freedom. Some values seem to stabilise a frame while others cause collapse. Get the ratios right and we can have it all. Get them wrong and things get more desperate.
Navigating Your Financial Future: Comprehensive Planning with Mike Baumannmikebaumannfinancial
Learn how financial planner Mike Baumann helps individuals and families articulate their financial aspirations and develop tailored plans. This presentation delves into budgeting, investment strategies, retirement planning, tax optimization, and the importance of ongoing plan adjustments.
Singapore 2024 Sustainability Reporting and Accountancy Education Slides
Wipro
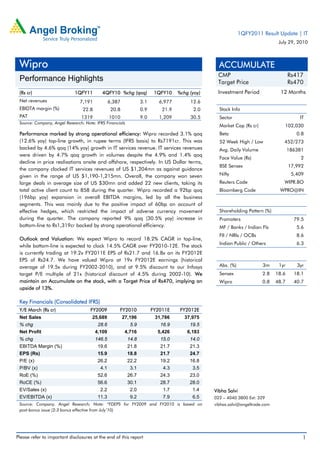
1. 1QFY2011 Result Update | IT
July 29, 2010
Wipro ACCUMULATE
CMP Rs417
Performance Highlights Target Price Rs470
(Rs cr) 1QFY11 4QFY10 %chg (qoq) 1QFY10 %chg (yoy) Investment Period 12 Months
Net revenues 7,191 6,387 3.1 6,977 12.6
EBIDTA margin (%) 22.8 20.8 0.9 21.9 2.0 Stock Info
PAT 1319 1010 9.0 1,209 30.5 Sector IT
Source: Company, Angel Research; Note: IFRS Financials
Market Cap (Rs cr) 102,030
Performance marked by strong operational efficiency: Wipro recorded 3.1% qoq Beta 0.8
(12.6% yoy) top-line growth, in rupee terms (IFRS basis) to Rs7191cr. This was 52 Week High / Low 452/273
backed by 4.6% qoq (14% yoy) growth in IT services revenue. IT services revenues Avg. Daily Volume 186381
were driven by 4.7% qoq growth in volumes despite the 4.9% and 1.4% qoq
Face Value (Rs) 2
decline in price realisations onsite and offshore, respectively. In US Dollar terms,
BSE Sensex 17,992
the company clocked IT services revenues of US $1,204mn as against guidance
given in the range of US $1,190-1,215mn. Overall, the company won seven Nifty 5,409
large deals in average size of US $30mn and added 22 new clients, taking its Reuters Code WIPR.BO
total active client count to 858 during the quarter. Wipro recorded a 92bp qoq Bloomberg Code WPRO@IN
(196bp yoy) expansion in overall EBITDA margins, led by all the business
segments. This was mainly due to the positive impact of 60bp on account of
effective hedges, which restricted the impact of adverse currency movement Shareholding Pattern (%)
during the quarter. The company reported 9% qoq (30.5% yoy) increase in Promoters 79.5
bottom-line to Rs1,319cr backed by strong operational efficiency. MF / Banks / Indian Fls 5.6
FII / NRIs / OCBs 8.6
Outlook and Valuation: We expect Wipro to record 18.2% CAGR in top-line,
Indian Public / Others 6.3
while bottom-line is expected to clock 14.5% CAGR over FY2010-12E. The stock
is currently trading at 19.2x FY2011E EPS of Rs21.7 and 16.8x on its FY2012E
EPS of Rs24.7. We have valued Wipro at 19x FY2012E earnings (historical
average of 19.5x during FY2002-2010), and at 9.5% discount to our Infosys Abs. (%) 3m 1yr 3yr
target P/E multiple of 21x (historical discount of 4.5% during 2002-10). We Sensex 2.8 18.6 18.1
maintain an Accumulate on the stock, with a Target Price of Rs470, implying an Wipro 0.8 48.7 40.7
upside of 13%.
Key Financials (Consolidated IFRS)
Y/E March (Rs cr) FY2009 FY2010 FY2011E FY2012E
Net Sales 25,689 27,196 31,786 37,975
% chg 28.6 5.9 16.9 19.5
Net Profit 4,109 4,716 5,426 6,183
% chg 146.5 14.8 15.0 14.0
EBITDA Margin (%) 19.6 21.8 21.7 21.3
EPS (Rs) 15.9 18.8 21.7 24.7
P/E (x) 26.2 22.2 19.2 16.8
P/BV (x) 4.1 3.1 4.3 3.5
RoE (%) 52.6 26.7 24.3 23.0
RoCE (%) 56.6 30.1 28.7 28.0
EV/Sales (x) 2.2 2.0 1.7 1.4 Vibha Salvi
EV/EBITDA (x) 11.3 9.2 7.9 6.5 022 – 4040 3800 Ext: 329
Source: Company, Angel Research; Note: *FDEPS for FY2009 and FY2010 is based on vibhas.salvi@angeltrade.com
post-bonus issue (2:3 bonus effective from July’10)
Please refer to important disclosures at the end of this report 1
2. Wipro | 1Q FY2011Result Update
Exhibit 1: 1QFY2011 performance (consolidated, IFRS)
Y/E March (Rs cr) 1QFY11 4QFY10 % chg 1QFY10 % chg FY2010 FY2009 % chg
(qoq) (yoy)
Net Revenues 7,191 6,977 3.1 6,387 12.6 27,196 25,689 5.9
Cost of Revenue 4,676 4,588 1.9 4,138 13.0 17,938 17,386 3.2
Gross Profit 2,514 2,390 5.2 2,249 11.8 9,258 8,303 11.5
SG&A Expenses 923 870 6.0 779 18.4 3,252 3,123 4.1
Forex Gains/Losses (net) (46) (6) 141 72 155
Operating Profit (EBITDA) 1,638 1,525 7.4 1,329 23.2 5,934 5,025 18.1
Other Income 135 185 (26.9) 100 35.8 460 357 29.0
Interest 40 24 70.0 64 (37.0) 123.2 233 (47.2)
Depreciation 188 189 (0.2) 187 0.9 783.10 694.70 12.7
Share of profits of Equity
16 18 (10.8) 11 37.7 53 36 46.4
accounted associates
Income before Income Taxes 1,560 1,515 2.9 1,189 31.1 5,541 4,490 23.4
Income Taxes 235 302 (22.2) 174 34.8 929 604 54.0
Minority Interest 7 5 45.7 5 36.7 18.500 10 86.9
Net Income 1,319 1,209 9.0 1,010 30.5 4,593 3,876 18.5
Diluted EPS (Rs) 5.4 5.0 9.0 4.1 31.0 31.2 26.5 17.9
Gross Profit Margin (%) 35.0 34.2 35.2 34.0 32.3
EBITDA Margin (%) 22.8 21.9 20.8 21.8 19.6
Net Profit Margin (%) 18.3 17.3 15.8 16.9 15.1
Source: Company, Angel Research
Exhibit 2: 1QFY2011 – Actual v/s Angel estimates
(Rs cr) Estimates Actual Variation (%)
Net revenue 7,134 7,191 0.8
EBIDTA margin (%) 21.2 22.8 0.0
PAT 1,213 1,319 8.7
Source: Company, Angel Research
Top-line growth led by strong volumes in IT services
Wipro recorded 3.1% qoq (12.6% yoy) top-line growth, in rupee terms (IFRS
basis), backed by 4.6% qoq (14% yoy) growth in IT services revenues, which were
driven by 4.7% qoq growth in volumes despite the 4.9% and 1.4% qoq decline in
price realisations onsite and offshore, respectively. Higher volumes were on
account of new project start ups during the quarter mainly onsite, which impacted
the price realisation severely there compared to offshore. In US Dollar terms, the
company clocked IT services revenues of US $1,204mn as against guidance given
in the range of US $1,190-1,215mn.
The growth in IT Services was broad-based, and mainly driven by 18.5%, 9.7%,
3.7% and 2.6% qoq growth in product engineering services (PES), package
implementation (PI), ADM and R&D services, respectively. In terms of verticals,
growth was strongly driven by communication & media services providers (CMSP),
financial services, manufacturing and retail-transportation verticals, which grew by
6.4%, 6.4%, 5.5% and 5.1% qoq, respectively. In addition to IT services segments,
the consumer care and lightning, and other businesses also grew by 5.4% and
July 29, 2010 2
3. Wipro | 1Q FY2011Result Update
1.6% qoq, respectively. The IT product business de-grew by 6.5% qoq, but was up
by 13.4% yoy.
In terms of geographies, America, India and the Middle East and APAC, and other
emerging markets witnessed growth of 4.3%, 5.4% and 5.6% qoq, respectively.
Despite the ongoing crisis in Europe, the company witnessed slight de-growth of
0.2% qoq, while it grew by 16.2% yoy. In fact, Wipro won a large deal from one
of its European client, viz. Citibank to take over the ownership and management
of its data center in Meerbusch, Germany. As per the agreement Citibank will
lease back-office and data center space from Wipro for at least 30 months and
Wipro will provide Citibank with facilities management and IMS services during
the period. The Meerbusch Germany data center will be Wipro’s first facility in
Europe and will enable it to offer full portfolio of infrastructure management
solutions (IMS) to its European and global clients.
Overall, the company won seven large deals in average size of US $30mn and
added 22 new clients, taking its total active client count to 858 during the quarter.
Exhibit 3: Segment-wise revenue breakup
Rs cr 1QFY11 4QFY10 1QFY10 chg chg
qoq % yoy %
IT services 5,500 5,260 4,827 4.6 14.0
Pure IT Services 4,945 4,686 4,339 5.5 14.0
BPO Services 556 573 487 (3.1) 14.0
IT Products 832 890 734 (6.5) 13.4
Consumer Care & Lightning 641 608 520 5.4 23.4
Others 232 229 149 1.6 56.3
Eliminations (15) (9) 158 62.4 (109.5)
Total 7,191 6,977 6,387 3.1 12.6
Source: Company, Angel Research
Effective hedges contained adverse currency impact on margins
During 1QFY2011, Wipro recorded a 92bp qoq (196bp yoy) expansion in
overall EBITDA margins, led by all the business segments. Despite the higher
employee costs (with infused freshers hiring) and decline in pricing, the
company witnessed 37bp qoq (238bp yoy) expansion in EBIT margins of IT
services segment. This was mainly due to the positive impact of 60bp on
account of effective hedges, which contained the adverse currency impact on
EBIDTA margins during the quarter. The EBIT margins in IT products and
consumer care and lighting businesses also expanded by 111bp and 44bp
qoq, respectively. The company continued to witness strong sequential
ramp up in its fixed-priced projects mix, which was up by 30bp qoq to 44.6%
in 1QFY2011.
July 29, 2010 3
4. Wipro | 1Q FY2011Result Update
Exhibit 4: EBITDA margin trend
25
24
23
22
(%)
21
20
19
1QFY08
2QFY08
3QFY08
4QFY08
1QFY09
2QFY09
3QFY09
4QFY09
1QFY10
2QFY10
3QFY10
4QFY10
1QFY11
Wipro (Total) Wipro (IT Services)
Source: Company, Angel Research
Strong operational efficiency boosts bottom-line
Other income declined by 26.9% qoq mainly due to gains from exchange
fluctuation in 4QFY2010, absent in 1QFY2011. However, on a yoy basis,
other income was up 35.8% due to higher interest income. The interest cost
increased by 70% qoq with increase in debt levels during the quarter. Further,
the effective tax rate was down from 20% in 4QFY2010 to 15% in 1QFY2011.
Thus, at the net level, the company reported 9% qoq (30.5% yoy) increase in
bottom-line backed by strong operational efficiency.
Strong manpower additions aided growth
Wipro made net addition of 4,854 employees during the quarter taking total
headcount to 1,12,925. The quarterly annualised attrition rate in Global IT
services was up at 23% (17.1% in 4QFY2010); however, on TTM basis, it
stood lower at 15.8%, yet higher from 12.1% in 4QFY2010. In BPO services,
the quarterly attrition stood at 16% (17% in 4QFY2010). The company has
strong hiring plans both for laterals and freshers going forward, with the
improvement in demand environment.
2QFY2011E revenue guidance at US $1,253-1,277mn
Despite challenging macro-economic indicators Wipro has given strong
revenue guidance for the IT services segment for 2QFY2011 in the range of
US $1,253-1,277mn, a sequential growth of 4.1 - 6.1%.
To address the attrition issue, the company gave 20,000 promotions with
effect from July 1, 2010 and will also award restricted stock units (RSUs) to its
middle management staff. Thus, adverse currency movement and higher
employee costs (with strong hiring and variable spends) would remain key
headwinds impacting the margins and bottom-line in 2QFY2011.
July 29, 2010 4
5. Wipro | 1Q FY2011Result Update
Investment Arguments
Broad-based volume led growth with uptick in discretionary spends and stable
pricing environment
The strong growth witnessed in Wipro’s package implementation service
revenues during 1QFY2011 reflects the pick-up in discretionary spends of
clients. Significant spend is currently happening in social customer relationship
management (CRM), which if it grows further as expected would certainly
assure strong top-line and better profitability for the company going forward.
Further, the consumer package goods (CPG), retail & transportation, energy &
utilities and the healthcare verticals are witnessing strong demand pipeline
and are expected to grow strongly. The financial services vertical is also
witnessing steady demand pick. The company is witnessing a stable pricing
environment from most of its clients with some expected to give an upward
revision going forward.
Non-linear initiatives to drive growth
Wipro’s non-linear initiatives include implementation of shared services model
thereby executing more projects without any major employee deployment,
which would result in costs savings. Other such initiatives include its platform
oriented integrated IT and BPO offerings and intellectual property related
revenues. Such offerings help to drive better profitability in projects without
incurring of additional fixed costs. The company expects these initiatives to
contribute ~14% of its revenues in FY2011.
Outlook and Valuation
We expect Wipro to record 18.2% CAGR in top-line, while bottom-line is expected
to clock 14.5% CAGR over FY2010-12E. The stock is currently trading at 19.2x
FY2011E EPS of Rs21.7 and 16.8x on its FY2012E EPS of Rs24.7. We have valued
Wipro at 19x FY2012E earnings (historical average of 19.5x during FY2002-
2010), and at 9.5% discount to our Infosys target P/E multiple of 21x (historical
discount of 4.5% during 2002-10). We maintain an Accumulate on the stock, with
a Target Price of Rs470, implying an upside of 13%.
Exhibit 5: Key assumptions
FY2011E FY2012E
Volume growth 20.0 18.6
Pricing growth (2.6) 2.7
Revenue growth (in US $ terms) 16.2 18.1
USD-INR rate (realised) 46.5 47.0
Revenue Growth (in Re terms) 17.0 19.5
EBIDTA Margin (%) 21.7 21.3
Tax Rate (%) 18.0 20.0
EPS Growth (%) 15.4 14.1
Source: Company, Angel Research
July 29, 2010 5
6. Wipro | 1Q FY2011Result Update
Exhibit 6: Change in estimates
FY2011E FY2012E
Parameter Earlier Revised Var. Earlier Revised Var.
(Rs cr) estimates estimates (%) estimates estimates (%)
Net revenue 31,034 31,786 2.4 37,317 37,975 1.8
EBIDTA 6,620 6,901 4.2 7,741 8,094 4.6
PBT 6,028 6,590 9.3 7,194 7,696 7.0
Tax 1,085 1,164 7.3 1,439 1,513 5.1
PAT 4,988 5,426 8.8 5,805 6,183 6.5
Source: Company, Angel Research
We have upgraded our FY2011E and FY2012E top-line estimates, in line with
strong cues from management and the expected higher infusion of gross
manpower. Since the company has a strong hedge position (currently stands
at US $1.6bn), unfavourable cross-currency movement would have lesser
impact on EBIDTA margins as expected earlier. We estimate PAT to be higher
in FY2011E and FY2012E, compared to the earlier estimates, on the back of
better margins.
Exhibit 7: Angel EPS forecast v/s consensus
Bloomberg Variation
Year (%) Angel forecast
consensus (%)
FY2011E 21.7 22.2 (2.3)
FY2012E 24.7 25.2 (2.0)
Source: Company, Angel Research
Exhibit 8: One-year forward P/E band
800
30x
700
600 25x
Share Price (Rs)
500 20x
400 15x
300
200
100
Dec-05
Apr-04
Jul-05
Aug-07
Apr-09
Jul-10
Mar-07
Oct-06
Sep-04
Feb-05
Sep-09
Feb-10
Nov-08
May-06
Jun-08
Jan-08
Source: Company, Angel Research
July 29, 2010 6
8. Wipro | 1Q FY2011Result Update
Profit & Loss Statement (Consolidated IFRS)
Y/E March (Rs cr) FY2009 FY2010 FY2011E FY2012E
Gross sales 25,689 27,196 31,786 37,975
Less: Excise duty - - - -
Net Sales 25,689 27,196 31,786 37,975
Other operating income - - - -
Total operating income 25,689 27,196 31,786 37,975
% chg 28.6 5.9 16.9 19.5
Total Expenditure 20,664 21,262 24,885 29,880
Cost of Equipment 3,463 3,497 3,878 4,557
SGA 1,905 1,947 2,177 2,525
Cost of IT 15,142 15,746 18,751 22,712
Other 155 72 79 86
EBITDA 5,025 5,934 6,901 8,094
(% of Net Sales) 19.6 21.8 21.7 21.3
Depreciation& Amortisation 695 783 880 993
EBIT 4,330 5,151 6,022 7,102
(% of Net Sales) 16.9 18.9 18.9 18.7
Interest & other Charges 233 123 124 132
Other Income 393 513 568 594
(% of PBT) 8.7 9.3 8.8 7.9
Recurring PBT 4,490 5,541 6,466 7,564
% chg 22.0 23.4 16.7 17.0
Extraordinary Expense/(Inc.) - - - -
PBT (reported) 4,490 5,541 6,466 7,564
Tax 604 929 1,164 1,513
(% of PBT) 13.4 16.8 18.0 20.0
PAT (reported) 3,886 4,612 5,302 6,051
Add: Share of earnings of
- - - -
associate
Less: Minority interest (MI) (9.9) (18.5) - -
Prior period items - - - -
PAT after MI (reported) 3,876 4,593 5,302 6,051
ADJ. PAT 3,876 4,593 5,302 6,051
% chg 18.8 18.5 15.4 14.1
(% of Net Sales) 15.1 16.9 16.7 15.9
Basic EPS (Rs) 26.7 31.5 21.7 24.7
Fully Diluted EPS (Rs) 26.5 31.2 21.7 24.7
% chg 18.8 18.5 15.4 14.1
July 29, 2010 8
9. Wipro | 1Q FY2011Result Update
Balance Sheet (Consolidated IFRS)
Y/E March (Rs cr) FY2009 FY2010 FY2011E FY2012E
SOURCES OF FUNDS
Equity Share Capital 293 294 489 489
Reserves& Surplus 14,071 19,047 23,446 28,305
Shareholders Funds 14,364 19,341 23,935 28,794
Minority Interest 375 314 - -
Total Loans 3,323 2,563 2,713 2,913
Total Liabilities 18,061 22,218 26,648 31,707
APPLICATION OF FUNDS
Gross Block 7,421 8,561 9,561 10,561
Less: Acc. Depreciation 3,465 4,049 4,929 5,922
Net Block 3,956 4,511 4,632 4,639
Capital Work-in-Progress 1,373 1,236 1,236 1,236
Goodwill 5,614 5,380 5,530 5,530
Investments 1,365 1,276 1,626 1,676
Current Assets 16,078 20,551 24,736 30,388
Cash 4,912 6,488 6,477 8,785
Loans & Advances - - - -
Other 11,166 14,064 18,259 21,603
Current liabilities 10,324 10,737 11,112 11,762
Net Current Assets 5,753 9,814 13,624 18,626
Mis. Exp. not written off - - - -
Total Assets 18,061 22,218 26,648 31,707
Cash Flow Statement (Consolidated IFRS)
Y/E March (Rs cr) FY2009 FY2010 FY2011E FY2012E
Profit before tax 4,490 5,541 6,466 7,564
Depreciation 695 783 880 993
Change in Working Capital (1,075) 731 (4,661) (2,708)
Less: Other income (287) 1,164 568 594
Direct taxes paid 786 791 1,164 1,513
Cash Flow from Operations 3,610 5,100 952 3,741
(Inc)./ Dec in Fixed Assets (1,742) (2,770) (609) (985)
(Inc)./ Dec. in Investments (375) (580) (50) (50)
(Inc)./ Dec. in loans and adv. (668) (405) -
Other income 366 374 568 594
Cash Flow from Investing (2,418) (3,382) (91) (441)
Issue of Equity 8 9 - -
Inc./(Dec.) in loans 349 614 150 200
Dividend Paid (Incl. Tax) 683 682 1,022 1,192
Others (fx effect) 155 (82) - -
Cash Flow from Financing (171) (142) (872) (992)
Inc./(Dec.) in Cash 1,020 1,576 (11) 2,308
Opening Cash balances 3,891 4,912 6,488 6,477
Closing Cash balances 4,912 6,488 6,477 8,785
July 29, 2010 9
10. Wipro | 1Q FY2011Result Update
Key Ratios
Y/E March FY2009 FY2010 FY2011E FY2012E
Valuation Ratio (x)
P/E (on FDEPS) 7.8 10.4 19.2 16.8
P/CEPS 13.3 11.4 16.5 14.5
P/BV 4.1 3.1 4.3 3.5
Dividend yield (%) 1.0 1.4 0.9 1.0
EV/Sales 2.2 2.0 1.7 1.4
EV/EBITDA 11.3 9.2 7.9 6.5
EV / Total Assets 2.0 1.7 1.4 1.2
Per Share Data (Rs)
EPS (Basic) 26.7 31.5 21.7 24.7
EPS (fully diluted) 26.5 31.2 21.7 24.7
Cash EPS 31.3 36.6 25.3 28.8
DPS 4.0 6.0 3.6 4.2
Book Value 100.8 133.7 97.8 117.7
DuPont Analysis
EBIT margin 16.9 18.9 18.9 18.7
Tax retention ratio 86.6 83.2 82.0 80.0
Asset turnover (x) 1.2 1.1 1.1 1.2
ROIC (Post-tax) 47.9 25.6 24.6 24.3
Cost of Debt (Post Tax) 12.2 3.5 3.9 3.8
Leverage (x) 0.3 0.2 0.1 0.1
Operating ROE 20.9 19.5 18.9 18.2
Returns (%)
ROCE (Pre-tax) 56.6 30.1 28.7 28.0
Angel ROIC (Pre-tax) 78.1 38.7 34.4 32.3
ROE 52.6 26.7 24.3 23.0
Turnover ratios (x)
Asset Turnover (Gross Block) 3.6 3.3 3.5 3.7
Inventory / Sales (days) 6 12 12 12
Receivables (days) 89 91 93 92
Payables (days) 54 106 90 78
Working capital cycle (ex-cash) (days) 7 45 82 95
Solvency ratios (x)
Net debt to equity 0.1 - - -
Net debt to EBITDA 0.4 - - -
Interest Coverage (EBIT / Interest) 18.6 41.8 48.6 53.7
Note: *FDEPS for FY2009 and FY2010 is based on pre-bonus issue (2:3bonus effective from July’10)
July 29, 2010 10
11. Wipro | 1Q FY2011Result Update
Research Team Tel: 022 - 4040 3800 E-mail: research@angeltrade.com Website: www.angeltrade.com
Disclaimer
This document is solely for the personal information of the recipient, and must not be singularly used as the basis of any investment
decision. Nothing in this document should be construed as investment or financial advice. Each recipient of this document should make
such investigations as they deem necessary to arrive at an independent evaluation of an investment in the securities of the companies
referred to in this document (including the merits and risks involved), and should consult their own advisors to determine the merits and
risks of such an investment.
Angel Broking Limited, its affiliates, directors, its proprietary trading and investment businesses may, from time to time, make
investment decisions that are inconsistent with or contradictory to the recommendations expressed herein. The views contained in this
document are those of the analyst, and the company may or may not subscribe to all the views expressed within.
Reports based on technical and derivative analysis center on studying charts of a stock's price movement, outstanding positions and
trading volume, as opposed to focusing on a company's fundamentals and, as such, may not match with a report on a company's
fundamentals.
The information in this document has been printed on the basis of publicly available information, internal data and other reliable
sources believed to be true, but we do not represent that it is accurate or complete and it should not be relied on as such, as this
document is for general guidance only. Angel Broking Limited or any of its affiliates/ group companies shall not be in any way
responsible for any loss or damage that may arise to any person from any inadvertent error in the information contained in this report.
Angel Broking Limited has not independently verified all the information contained within this document. Accordingly, we cannot testify,
nor make any representation or warranty, express or implied, to the accuracy, contents or data contained within this document. While
Angel Broking Limited endeavours to update on a reasonable basis the information discussed in this material, there may be regulatory,
compliance, or other reasons that prevent us from doing so.
This document is being supplied to you solely for your information, and its contents, information or data may not be reproduced,
redistributed or passed on, directly or indirectly.
Angel Broking Limited and its affiliates may seek to provide or have engaged in providing corporate finance, investment banking or
other advisory services in a merger or specific transaction to the companies referred to in this report, as on the date of this report or in
the past.
Neither Angel Broking Limited, nor its directors, employees or affiliates shall be liable for any loss or damage that may arise from or in
connection with the use of this information.
Note: Please refer to the important `Stock Holding Disclosure' report on the Angel website (Research Section). Also, please refer to the
latest update on respective stocks for the disclosure status in respect of those stocks. Angel Broking Limited and its affiliates may have
investment positions in the stocks recommended in this report.
Disclosure of Interest Statement Wipro
1. Analyst ownership of the stock No
2. Angel and its Group companies ownership of the stock No
3. Angel and its Group companies' Directors ownership of the stock No
4. Broking relationship with company covered No
Note: We have not considered any Exposure below Rs 1 lakh for Angel, its Group companies and Directors.
Ratings (Returns) : Buy (> 15%) Accumulate (5% to 15%) Neutral (-5 to 5%)
Reduce (-5% to 15%) Sell (< -15%)
July 29, 2010 11