ING Vyasa Bank Q2FY14 Result: Maintain neutralIndiaNotes.com
ING Vysya Bank’s (VYSB) 2QFY15 PAT was 9% above estimate at INR1.8b (+2% YoY) led by better-than-expected NIM (+10bp) and lower provisioning. Reported NIM improved 17bp QoQ to 3.54%. However, adjusted for interest reversal on account of stressed accounts in 1QFY15, NIM was stable QoQ at 3.54%.
LIC Housing Finance Q1FY15 performance in line with estimates; buyIndiaNotes.com
LIC Housing Finance’s 1QFY15 operational performance was in line with estimates. Lower than expected Net interest income (3% below estimate) compensated by 5% below estimated opex. Operating profits grew 13% YoY to INR4.97b (in-line).
FSA, a personal insolvency restructuring firm and sub-prime home loan lender, has had a stellar run since this research piece was published. Many investors made great returns. Great CEO vision, strategy and execution.
Stock Recommendation: Buy Punjab National Bank on dips for a target of Rs185IndiaNotes.com
In Q3FY15, PNB continued to disappoint on asset quality front and posted an overall lackluster performance. GNPA% and NNPA% have gone up sequentially from 5.65% and 3.26% in Q2FY15 to 5.97% and 3.82% in Q3FY15. NII remains almost flat y-o-y and q-o-q at Rs 4233 cr. Profitability was up 2.5% y-o-y and 34.6% q-o-q to Rs 774.6 cr. Provisions have declined 7.7% y-o-y and 17% q-o-q to Rs 1467.8 cr. Overall loan growth is up 11.2% y-o-y to Rs 372086 cr.
Bajaj Finance reported net profit of Rs 211.4 cr (+20.3% YoY) in Q1FY15 which was above expectations primarily due to higher than expected Net Interest Income (NII). NII increased 23.2% YoY and 23.0% QoQ with increase in consumer durable segment.
how to swap pi coins to foreign currency withdrawable.DOT TECH
As of my last update, Pi is still in the testing phase and is not tradable on any exchanges.
However, Pi Network has announced plans to launch its Testnet and Mainnet in the future, which may include listing Pi on exchanges.
The current method for selling pi coins involves exchanging them with a pi vendor who purchases pi coins for investment reasons.
If you want to sell your pi coins, reach out to a pi vendor and sell them to anyone looking to sell pi coins from any country around the globe.
Below is the contact information for my personal pi vendor.
Telegram: @Pi_vendor_247
when will pi network coin be available on crypto exchange.DOT TECH
There is no set date for when Pi coins will enter the market.
However, the developers are working hard to get them released as soon as possible.
Once they are available, users will be able to exchange other cryptocurrencies for Pi coins on designated exchanges.
But for now the only way to sell your pi coins is through verified pi vendor.
Here is the telegram contact of my personal pi vendor
@Pi_vendor_247
Turin Startup Ecosystem 2024 - Ricerca sulle Startup e il Sistema dell'Innov...Quotidiano Piemontese
Turin Startup Ecosystem 2024
Una ricerca de il Club degli Investitori, in collaborazione con ToTeM Torino Tech Map e con il supporto della ESCP Business School e di Growth Capital
Introduction to Indian Financial System ()Avanish Goel
The financial system of a country is an important tool for economic development of the country, as it helps in creation of wealth by linking savings with investments.
It facilitates the flow of funds form the households (savers) to business firms (investors) to aid in wealth creation and development of both the parties
The European Unemployment Puzzle: implications from population agingGRAPE
We study the link between the evolving age structure of the working population and unemployment. We build a large new Keynesian OLG model with a realistic age structure, labor market frictions, sticky prices, and aggregate shocks. Once calibrated to the European economy, we quantify the extent to which demographic changes over the last three decades have contributed to the decline of the unemployment rate. Our findings yield important implications for the future evolution of unemployment given the anticipated further aging of the working population in Europe. We also quantify the implications for optimal monetary policy: lowering inflation volatility becomes less costly in terms of GDP and unemployment volatility, which hints that optimal monetary policy may be more hawkish in an aging society. Finally, our results also propose a partial reversal of the European-US unemployment puzzle due to the fact that the share of young workers is expected to remain robust in the US.
US Economic Outlook - Being Decided - M Capital Group August 2021.pdfpchutichetpong
The U.S. economy is continuing its impressive recovery from the COVID-19 pandemic and not slowing down despite re-occurring bumps. The U.S. savings rate reached its highest ever recorded level at 34% in April 2020 and Americans seem ready to spend. The sectors that had been hurt the most by the pandemic specifically reduced consumer spending, like retail, leisure, hospitality, and travel, are now experiencing massive growth in revenue and job openings.
Could this growth lead to a “Roaring Twenties”? As quickly as the U.S. economy contracted, experiencing a 9.1% drop in economic output relative to the business cycle in Q2 2020, the largest in recorded history, it has rebounded beyond expectations. This surprising growth seems to be fueled by the U.S. government’s aggressive fiscal and monetary policies, and an increase in consumer spending as mobility restrictions are lifted. Unemployment rates between June 2020 and June 2021 decreased by 5.2%, while the demand for labor is increasing, coupled with increasing wages to incentivize Americans to rejoin the labor force. Schools and businesses are expected to fully reopen soon. In parallel, vaccination rates across the country and the world continue to rise, with full vaccination rates of 50% and 14.8% respectively.
However, it is not completely smooth sailing from here. According to M Capital Group, the main risks that threaten the continued growth of the U.S. economy are inflation, unsettled trade relations, and another wave of Covid-19 mutations that could shut down the world again. Have we learned from the past year of COVID-19 and adapted our economy accordingly?
“In order for the U.S. economy to continue growing, whether there is another wave or not, the U.S. needs to focus on diversifying supply chains, supporting business investment, and maintaining consumer spending,” says Grace Feeley, a research analyst at M Capital Group.
While the economic indicators are positive, the risks are coming closer to manifesting and threatening such growth. The new variants spreading throughout the world, Delta, Lambda, and Gamma, are vaccine-resistant and muddy the predictions made about the economy and health of the country. These variants bring back the feeling of uncertainty that has wreaked havoc not only on the stock market but the mindset of people around the world. MCG provides unique insight on how to mitigate these risks to possibly ensure a bright economic future.
What website can I sell pi coins securely.DOT TECH
Currently there are no website or exchange that allow buying or selling of pi coins..
But you can still easily sell pi coins, by reselling it to exchanges/crypto whales interested in holding thousands of pi coins before the mainnet launch.
Who is a pi merchant?
A pi merchant is someone who buys pi coins from miners and resell to these crypto whales and holders of pi..
This is because pi network is not doing any pre-sale. The only way exchanges can get pi is by buying from miners and pi merchants stands in between the miners and the exchanges.
How can I sell my pi coins?
Selling pi coins is really easy, but first you need to migrate to mainnet wallet before you can do that. I will leave the telegram contact of my personal pi merchant to trade with.
Tele-gram.
@Pi_vendor_247
Falcon stands out as a top-tier P2P Invoice Discounting platform in India, bridging esteemed blue-chip companies and eager investors. Our goal is to transform the investment landscape in India by establishing a comprehensive destination for borrowers and investors with diverse profiles and needs, all while minimizing risk. What sets Falcon apart is the elimination of intermediaries such as commercial banks and depository institutions, allowing investors to enjoy higher yields.
Resume
• Real GDP growth slowed down due to problems with access to electricity caused by the destruction of manoeuvrable electricity generation by Russian drones and missiles.
• Exports and imports continued growing due to better logistics through the Ukrainian sea corridor and road. Polish farmers and drivers stopped blocking borders at the end of April.
• In April, both the Tax and Customs Services over-executed the revenue plan. Moreover, the NBU transferred twice the planned profit to the budget.
• The European side approved the Ukraine Plan, which the government adopted to determine indicators for the Ukraine Facility. That approval will allow Ukraine to receive a EUR 1.9 bn loan from the EU in May. At the same time, the EU provided Ukraine with a EUR 1.5 bn loan in April, as the government fulfilled five indicators under the Ukraine Plan.
• The USA has finally approved an aid package for Ukraine, which includes USD 7.8 bn of budget support; however, the conditions and timing of the assistance are still unknown.
• As in March, annual consumer inflation amounted to 3.2% yoy in April.
• At the April monetary policy meeting, the NBU again reduced the key policy rate from 14.5% to 13.5% per annum.
• Over the past four weeks, the hryvnia exchange rate has stabilized in the UAH 39-40 per USD range.
how can i use my minded pi coins I need some funds.DOT TECH
If you are interested in selling your pi coins, i have a verified pi merchant, who buys pi coins and resell them to exchanges looking forward to hold till mainnet launch.
Because the core team has announced that pi network will not be doing any pre-sale. The only way exchanges like huobi, bitmart and hotbit can get pi is by buying from miners.
Now a merchant stands in between these exchanges and the miners. As a link to make transactions smooth. Because right now in the enclosed mainnet you can't sell pi coins your self. You need the help of a merchant,
i will leave the telegram contact of my personal pi merchant below. 👇 I and my friends has traded more than 3000pi coins with him successfully.
@Pi_vendor_247
Currently pi network is not tradable on binance or any other exchange because we are still in the enclosed mainnet.
Right now the only way to sell pi coins is by trading with a verified merchant.
What is a pi merchant?
A pi merchant is someone verified by pi network team and allowed to barter pi coins for goods and services.
Since pi network is not doing any pre-sale The only way exchanges like binance/huobi or crypto whales can get pi is by buying from miners. And a merchant stands in between the exchanges and the miners.
I will leave the telegram contact of my personal pi merchant. I and my friends has traded more than 6000pi coins successfully
Tele-gram
@Pi_vendor_247
Falcon stands out as a top-tier P2P Invoice Discounting platform in India, bridging esteemed blue-chip companies and eager investors. Our goal is to transform the investment landscape in India by establishing a comprehensive destination for borrowers and investors with diverse profiles and needs, all while minimizing risk. What sets Falcon apart is the elimination of intermediaries such as commercial banks and depository institutions, allowing investors to enjoy higher yields.
USDA Loans in California: A Comprehensive Overview.pptxmarketing367770
USDA Loans in California: A Comprehensive Overview
If you're dreaming of owning a home in California's rural or suburban areas, a USDA loan might be the perfect solution. The U.S. Department of Agriculture (USDA) offers these loans to help low-to-moderate-income individuals and families achieve homeownership.
Key Features of USDA Loans:
Zero Down Payment: USDA loans require no down payment, making homeownership more accessible.
Competitive Interest Rates: These loans often come with lower interest rates compared to conventional loans.
Flexible Credit Requirements: USDA loans have more lenient credit score requirements, helping those with less-than-perfect credit.
Guaranteed Loan Program: The USDA guarantees a portion of the loan, reducing risk for lenders and expanding borrowing options.
Eligibility Criteria:
Location: The property must be located in a USDA-designated rural or suburban area. Many areas in California qualify.
Income Limits: Applicants must meet income guidelines, which vary by region and household size.
Primary Residence: The home must be used as the borrower's primary residence.
Application Process:
Find a USDA-Approved Lender: Not all lenders offer USDA loans, so it's essential to choose one approved by the USDA.
Pre-Qualification: Determine your eligibility and the amount you can borrow.
Property Search: Look for properties in eligible rural or suburban areas.
Loan Application: Submit your application, including financial and personal information.
Processing and Approval: The lender and USDA will review your application. If approved, you can proceed to closing.
USDA loans are an excellent option for those looking to buy a home in California's rural and suburban areas. With no down payment and flexible requirements, these loans make homeownership more attainable for many families. Explore your eligibility today and take the first step toward owning your dream home.
NO1 Uk Rohani Baba In Karachi Bangali Baba Karachi Online Amil Baba WorldWide...Amil baba
Contact with Dawood Bhai Just call on +92322-6382012 and we'll help you. We'll solve all your problems within 12 to 24 hours and with 101% guarantee and with astrology systematic. If you want to take any personal or professional advice then also you can call us on +92322-6382012 , ONLINE LOVE PROBLEM & Other all types of Daily Life Problem's.Then CALL or WHATSAPP us on +92322-6382012 and Get all these problems solutions here by Amil Baba DAWOOD BANGALI
#vashikaranspecialist #astrologer #palmistry #amliyaat #taweez #manpasandshadi #horoscope #spiritual #lovelife #lovespell #marriagespell#aamilbabainpakistan #amilbabainkarachi #powerfullblackmagicspell #kalajadumantarspecialist #realamilbaba #AmilbabainPakistan #astrologerincanada #astrologerindubai #lovespellsmaster #kalajaduspecialist #lovespellsthatwork #aamilbabainlahore#blackmagicformarriage #aamilbaba #kalajadu #kalailam #taweez #wazifaexpert #jadumantar #vashikaranspecialist #astrologer #palmistry #amliyaat #taweez #manpasandshadi #horoscope #spiritual #lovelife #lovespell #marriagespell#aamilbabainpakistan #amilbabainkarachi #powerfullblackmagicspell #kalajadumantarspecialist #realamilbaba #AmilbabainPakistan #astrologerincanada #astrologerindubai #lovespellsmaster #kalajaduspecialist #lovespellsthatwork #aamilbabainlahore #blackmagicforlove #blackmagicformarriage #aamilbaba #kalajadu #kalailam #taweez #wazifaexpert #jadumantar #vashikaranspecialist #astrologer #palmistry #amliyaat #taweez #manpasandshadi #horoscope #spiritual #lovelife #lovespell #marriagespell#aamilbabainpakistan #amilbabainkarachi #powerfullblackmagicspell #kalajadumantarspecialist #realamilbaba #AmilbabainPakistan #astrologerincanada #astrologerindubai #lovespellsmaster #kalajaduspecialist #lovespellsthatwork #aamilbabainlahore #Amilbabainuk #amilbabainspain #amilbabaindubai #Amilbabainnorway #amilbabainkrachi #amilbabainlahore #amilbabaingujranwalan #amilbabainislamabad
NO1 Uk Rohani Baba In Karachi Bangali Baba Karachi Online Amil Baba WorldWide...
Sib ru2 qfy2011-221010
1. Please refer to important disclosures at the end of this report 1
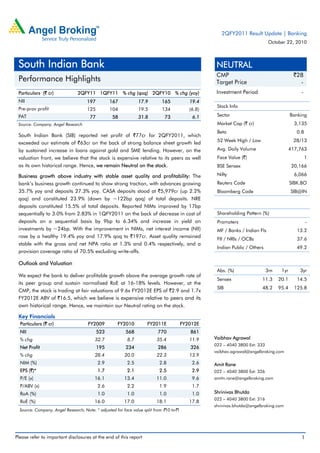
Particulars (` cr) 2QFY11 1QFY11 % chg (qoq) 2QFY10 % chg (yoy)
NII 197 167 17.9 165 19.4
Pre-prov profit 125 104 19.5 134 (6.8)
PAT 77 58 31.8 73 6.1
Source: Company, Angel Research
South Indian Bank (SIB) reported net profit of `77cr for 2QFY2011, which
exceeded our estimate of `63cr on the back of strong balance sheet growth led
by sustained increase in loans against gold and SME lending. However, on the
valuation front, we believe that the stock is expensive relative to its peers as well
as its own historical range. Hence, we remain Neutral on the stock.
Business growth above industry with stable asset quality and profitability: The
bank’s business growth continued to show strong traction, with advances growing
35.7% yoy and deposits 27.3% yoy. CASA deposits stood at `5,979cr (up 2.2%
qoq) and constituted 23.9% (down by ~122bp qoq) of total deposits. NRE
deposits constituted 15.5% of total deposits. Reported NIMs improved by 17bp
sequentially to 3.0% from 2.83% in 1QFY2011 on the back of decrease in cost of
deposits on a sequential basis by 9bp to 6.34% and increase in yield on
investments by ~24bp. With the improvement in NIMs, net interest income (NII)
rose by a healthy 19.4% yoy and 17.9% qoq to `197cr. Asset quality remained
stable with the gross and net NPA ratio at 1.3% and 0.4% respectively, and a
provision coverage ratio of 70.5% excluding write-offs.
Outlook and Valuation
We expect the bank to deliver profitable growth above the average growth rate of
its peer group and sustain normalised RoE at 16-18% levels. However, at the
CMP, the stock is trading at fair valuations of 9.6x FY2012E EPS of `2.9 and 1.7x
FY2012E ABV of `16.5, which we believe is expensive relative to peers and its
own historical range. Hence, we maintain our Neutral rating on the stock.
Key Financials
Particulars (` cr) FY2009 FY2010 FY2011E FY2012E
NII 523 568 770 861
% chg 32.7 8.7 35.4 11.9
Net Profit 195 234 286 326
% chg 28.4 20.0 22.3 13.9
NIM (%) 2.9 2.5 2.8 2.6
EPS (`)* 1.7 2.1 2.5 2.9
P/E (x) 16.1 13.4 11.0 9.6
P/ABV (x) 2.6 2.2 1.9 1.7
RoA (%) 1.0 1.0 1.0 1.0
RoE (%) 16.0 17.0 18.1 17.8
Source: Company, Angel Research; Note: * adjusted for face value split from `10 to`1
NEUTRAL
CMP `28
Target Price -
Investment Period -
Stock Info
Sector Banking
Market Cap (` cr) 3,135
Beta 0.8
52 Week High / Low 28/13
Avg. Daily Volume 417,763
Face Value (`) 1
BSE Sensex 20,166
Nifty 6,066
Reuters Code SIBK.BO
Bloomberg Code SIB@IN
Shareholding Pattern (%)
Promoters -
MF / Banks / Indian Fls 13.2
FII / NRIs / OCBs 37.6
Indian Public / Others 49.2
Abs. (%) 3m 1yr 3yr
Sensex 11.3 20.1 14.5
SIB 48.2 95.4 125.8
Vaibhav Agrawal
022 – 4040 3800 Ext: 333
vaibhav.agrawal@angelbroking.com
Amit Rane
022 – 4040 3800 Ext: 326
amitn.rane@angelbroking.com
Shrinivas Bhutda
022 – 4040 3800 Ext: 316
shrinivas.bhutda@angelbroking.com
South Indian Bank
Performance Highlights
2QFY2011 Result Update | Banking
October 22, 2010
2. South Indian Bank | 2QFY2011 Result Update
October 22, 2010 2
Exhibit 1: 2QFY2011 Performance
Particulars (` cr) 2QFY11 1QFY11 % chg (qoq) 2QFY10 % chg (yoy)
Interest earned 580 540 7.3 469 23.6
Interest expenses 382 373 2.5 304 25.9
Net Interest Income 197 167 17.9 165 19.4
Non-interest income 45 42 7.7 66 (31.5)
Operating income 242 209 15.9 231 5.0
Operating expenses 117 105 12.2 97 21.2
Pre-prov profit 125 104 19.5 134 (6.8)
Provisions & cont. 7 17 (59.2) 16 (58.6)
PBT 118 88 34.5 117 0.5
Prov. for Taxes 41 29 40.1 45 (8.6)
PAT 77 58 31.8 73 6.1
EPS (`)* 0.7 0.5 31.8 0.6 6.1
Cost-to-income ratio (%) 48.5 50.1 42.0
Effective tax rate (%) 34.7 33.4 38.2
Net NPA (%) 0.4 0.4 0.4
Source: Company, Angel Research; Note: * adjusted for face value split from `10 to `1.
Exhibit 2: 2QFY2011 Actual v/s Estimates
Particulars (` cr) Actual Estimates Var (%)
Net interest income 197 172 14.7
Non-interest income 45 36 25.3
Operating income 242 208 16.5
Operating expenses 117 104 12.8
Pre-prov. profit 125 104 20.2
Provisions & cont. 7 9 (21.3)
PBT 118 95 24.0
Prov. for taxes 41 32 27.8
PAT 77 63 22.0
Source: Company, Angel Research
3. South Indian Bank | 2QFY2011 Result Update
October 22, 2010 3
Strong business growth continues
The bank’s business growth continued to register strong traction, with advances
growth at 35.7% yoy (4.9% qoq) and deposits growth at 27.3% yoy (7.4% qoq).
The bank’s CASA deposits stood at `5,979cr (up by 2.2% qoq) and constituted
23.9% (down from 25.1% in 1QFY2011) of total deposits. NRE deposit growth was
sluggish during the quarter but remittances into savings accounts have picked up.
The key drivers for growth in advances were the disbursals to the infrastructure
sector and loans against gold. The bank has been quite aggressively growing the
high-yielding (12% avg. yield) loans against gold, which stood at `3,333cr (up
from ~`3,000cr in 1QFY2011). Loans against gold accounted for ~19% of the
advances.
Management is expecting credit growth above 25% for FY2011 and sees demand
to flow from the infrastructure sector where they have sanctions worth ~`2,800cr
and the loans against gold.
Reported NIMs improved by 17bp sequentially to 3.0% from 2.83% in 1QFY2011
on the back of decrease in cost of deposits on a sequential basis by 9bp to 6.34%
and increase in yield on investments by ~24bp. Also, the CD ratio on average
basis remained above 72% during 2QFY2011, thereby aiding the margin uptick.
However, the yield on advances declined by 16bp sequentially to 10.61% in
2QFY2011. With the improvement in NIMs, net interest income (NII) of the bank
rose by a healthy 19.4% yoy and 17.9% qoq to `197cr.
Going forward, management expects to sustain the NIMs above 2.9% on the back
of focus on CASA deposits and increasing the share of the higher yielding gold
and SME loans. We have built in NIMs of 2.8% for FY2011, considering the rising
interest rate environment, going forward.
Exhibit 3: Advances and deposits growth above industry
Source: Company, Angel Research
3.2 3.1 3.0
5.7
4.2
11.1 11.1
4.8 4.9
4.6 4.4 4.2
2.8
5.9
4.8
11.5
1.4
7.4
-
3.0
6.0
9.0
12.0
15.0
-
4,500
9,000
13,500
18,000
22,500
27,000
2QFY09
3QFY09
4QFY09
1QFY10
2QFY10
3QFY10
4QFY10
1QFY11
2QFY11Advances (` cr) Deposits (` cr)
Advances qoq growth (%, RHS) Deposits qoq growth (%, RHS)
4. South Indian Bank | 2QFY2011 Result Update
October 22, 2010 4
Exhibit 4: Advances break-up - 2QFY2011
Source: Company, Angel Research
Exhibit 5: CASA ratio relatively low at 23.9%
Source: Company, Angel Research
Exhibit 6: Reported NIM surprises on the upside
Source: Company, Angel Research
Healthy asset quality
The bank’s gross and net NPAs have been on a steady decline since 4QFY2009,
due to lower slippages and higher recoveries. The bank’s gross NPAs were up
2.1% sequentially at `228cr, while net NPAs rose 3.6% sequentially to `67cr; the
bank’s gross and net NPA ratio remained flat sequentially at 1.3% and 0.4%,
respectively. The bank maintained healthy provision coverage at 70.5% excluding
technical write-offs. The annualised gross slippage ratio for 2QFY2011 fell to 0.7%
compared to 1.5% for FY2010. During the quarter, the bank restructured advances
worth `25cr taking the total restructured advances to `457cr (28.2% of net worth
and 2.6% of the advances).
LCs, Bills
Receivable &
Packing Credit
18%
Gold Loan
18%
Medium and Large
Corporates
16%
Agri
16%
SME
12%
Housing
9%
NBFC
5%
Others
4%
Food Credit
1% Real Estate
1%
24.6
24.3 24.2
23.1
25.1
23.9
20.0
22.0
24.0
26.0
1QFY10 2QFY10 3QFY10 4QFY10 1QFY11 2QFY11
(%)
2.7 2.7
2.8 2.8
2.8
3.0
2.50
2.70
2.90
3.10
1QFY10 2QFY10 3QFY10 4QFY10 1QFY11 2QFY11
(%)
5. South Indian Bank | 2QFY2011 Result Update
October 22, 2010 5
Exhibit 7: NPAs stable
Source: Company, Angel Research
Non-interest income above expectations
During 2QFY2011, the bank’s non-interest income excluding treasury registered a
strong growth of 33.7% yoy, while the treasury income declined 83.1% yoy to
`6.2cr, resulting in a decline of 31.5% yoy in total non-interest income. Going
forward, the growth in non-interest income excluding treasury is estimated to be in
line with the advances growth. However, on account of lower treasury gains,
overall non-interest income is estimated to decline by 16.8% in FY2011.
Exhibit 8: Break-up of non-interest income
Particulars (` cr) 2QFY11 1QFY11 % chg (qoq) 2QFY10 % chg (yoy)
Fee Income 13 12 6.8 11 18.0
Treasury Gains 6 9 (32.7) 37 (83.1)
Others 26 20 26.6 18 43.5
Total 45 42 7.7 66 (31.5)
Source: Company, Angel Research
Comfortable Capital Adequacy
The bank’s capital adequacy ratio (CAR) stood at a comfortable 15.9%, with tier-I
capital of 13.1% (constituting 82.6% of the total CAR) at the end of 2QFY2011.
Exhibit 9: Comfortable capital adequacy
Source: Company, Angel Research
203
208
261
231
213
214
211
223
228
44
43
134
83
56
57
62
65
67
79 79
48
64
73 73 71 71 71
-
25
50
75
100
-
75
150
225
300
2QFY09
3QFY09
4QFY09
1QFY10
2QFY10
3QFY10
4QFY10
1QFY11
2QFY11
Gross NPAs (` cr) Net NPA (` cr) NPA coverage (%, RHS)
13.2 13.7 14.3 13.9 12.4 13.1 13.1
1.5 1.4
3.6 3.4
3.0 2.9 2.8
-
4.0
8.0
12.0
16.0
20.0
4QFY09
1QFY10
2QFY10
3QFY10
4QFY10
1QFY11
2QFY11
Tier-I CAR Tier-II CAR(%)
6. South Indian Bank | 2QFY2011 Result Update
October 22, 2010 6
Operating expenses under control
Operating expenses rose by 21.2% yoy driven by 22.1% yoy growth in employee
expenses and 19.4% yoy increase in other operating expenses. Due to the muted
performance on the operating income front, the bank’s cost-to-income ratio
deteriorated to 48.5% in 2QFY2011 as against 42.0% in 2QFY2010.
Management is targeting a cost-to-income ratio of 45% over the next two years.
Exhibit 10: Trend in opex
Source: Company, Angel Research
Investment Arguments
Profitable, cost-efficient and technologically up-to-date network
The bank’s largely semi-urban branch network is concentrated in the southern
states of the country. While enjoying customer loyalty that comes from years of
association, the bank has ensured that it remains sufficiently in step with product,
technology and service level developments in the industry thereby maintaining its
market share over the past ten years. Thus, the bank’s profitable, cost-efficient and
technologically up-to-date network constitutes a reasonably attractive standalone
franchise.
Niche NRI deposit base underpins deposit cost advantage over several
peers
The bank’s deposit franchise includes a niche NRI customer base that contributes a
meaningful 15.5% of total deposits and gives it a distinguishing cost advantage
over several of its peers. Thus, we believe that the bank will be relatively better-
placed to protect its NIMs than its peers, going forward.
Outlook and Valuation
At the CMP, the stock is trading at 9.6x FY2012E EPS of `2.9 and 1.7x FY2012E
ABV of `16.5, which we believe is expensive relative to peers and its own
historical range. Hence, we remain Neutral on the stock.
43.7
48.0
50.0
48.7
42.0
45.0
58.0
50.1
48.5
40.0
45.0
50.0
55.0
60.0
-
30
60
90
120
2QFY09
3QFY09
4QFY09
1QFY10
2QFY10
3QFY10
4QFY10
1QFY11
2QFY11
Staff expenses (` cr) Other opex (` cr) Cost-to-income ratio (%, RHS)
7. South Indian Bank | 2QFY2011 Result Update
October 22, 2010 7
Exhibit 11: Key Assumptions
Particulars (%)
Earlier Estimates Revised Estimates
FY2011E FY2012E FY2011E FY2012E
Credit growth 23.0 23.0 23.0 23.0
Deposit growth 19.0 19.0 19.0 19.0
CASA ratio 22.4 21.4 22.4 21.4
NIMs 2.6 2.5 2.8 2.6
Other income growth (14.2) 21.3 (14.2) 21.3
Growth in staff expenses 16.0 16.0 25.0 15.0
Growth in other expenses 16.0 16.0 25.0 15.0
Slippages 1.4 1.2 1.5 1.4
Treasury gain/(loss) (% of investments) 0.3 0.3 0.3 0.3
Source: Company, Angel Research
Exhibit 12: Change in estimates
Particulars (` cr)
FY2011 FY2012
Earlier
estimates
Revised
estimates
% chg
Earlier
estimates
Revised
estimates
% chg
NII 711 770 8.2 819 861 5.1
Non-interest income 179 179 - 217 217 -
Operating income 890 949 6.6 1,036 1,078 4.1
Operating expenses 425 458 7.8 493 526 6.8
Pre-prov. profit 465 491 5.4 544 552 1.6
Provisions & cont. 72 60 (17.5) 43 61 40.8
PBT 393 431 9.7 500 491 (1.8)
Prov. for taxes 133 145 9.7 169 166 (1.8)
PAT 261 286 9.7 332 326 (1.8)
Source: Company, Angel Research
Exhibit 13: P/ABV band
Source: Company, Angel Research
0
5
10
15
20
25
30
35
40
Mar-02
Oct-02
May-03
Dec-03
Jul-04
Mar-05
Oct-05
May-06
Dec-06
Jul-07
Feb-08
Sep-08
Apr-09
Nov-09
Jun-10
Jan-11
Price (`) 0.4x 0.8x 1.2x 1.6x 2x
11. South Indian Bank | 2QFY2011 Result Update
October 22, 2010 11
Research Team Tel: 022 - 4040 3800 E-mail: research@angeltrade.com Website: www.angeltrade.com
DISCLAIMER
This document is solely for the personal information of the recipient, and must not be singularly used as the basis of any investment
decision. Nothing in this document should be construed as investment or financial advice. Each recipient of this document should make
such investigations as they deem necessary to arrive at an independent evaluation of an investment in the securities of the companies
referred to in this document (including the merits and risks involved), and should consult their own advisors to determine the merits and
risks of such an investment.
Angel Broking Limited, its affiliates, directors, its proprietary trading and investment businesses may, from time to time, make
investment decisions that are inconsistent with or contradictory to the recommendations expressed herein. The views contained in this
document are those of the analyst, and the company may or may not subscribe to all the views expressed within.
Reports based on technical and derivative analysis center on studying charts of a stock's price movement, outstanding positions and
trading volume, as opposed to focusing on a company's fundamentals and, as such, may not match with a report on a company's
fundamentals.
The information in this document has been printed on the basis of publicly available information, internal data and other reliable
sources believed to be true, but we do not represent that it is accurate or complete and it should not be relied on as such, as this
document is for general guidance only. Angel Broking Limited or any of its affiliates/ group companies shall not be in any way
responsible for any loss or damage that may arise to any person from any inadvertent error in the information contained in this report.
Angel Broking Limited has not independently verified all the information contained within this document. Accordingly, we cannot testify,
nor make any representation or warranty, express or implied, to the accuracy, contents or data contained within this document. While
Angel Broking Limited endeavours to update on a reasonable basis the information discussed in this material, there may be regulatory,
compliance, or other reasons that prevent us from doing so.
This document is being supplied to you solely for your information, and its contents, information or data may not be reproduced,
redistributed or passed on, directly or indirectly.
Angel Broking Limited and its affiliates may seek to provide or have engaged in providing corporate finance, investment banking or
other advisory services in a merger or specific transaction to the companies referred to in this report, as on the date of this report or in
the past.
Neither Angel Broking Limited, nor its directors, employees or affiliates shall be liable for any loss or damage that may arise from or in
connection with the use of this information.
Note: Please refer to the important `Stock Holding Disclosure' report on the Angel website (Research Section). Also, please
refer to the latest update on respective stocks for the disclosure status in respect of those stocks. Angel Broking Limited and
its affiliates may have investment positions in the stocks recommended in this report.
Disclosure of Interest Statement South Indian Bank
1. Analyst ownership of the stock No
2. Angel and its Group companies ownership of the stock No
3. Angel and its Group companies' Directors ownership of the stock No
4. Broking relationship with company covered No
Note: We have not considered any Exposure below` 1 lakh for Angel, its Group companies and Directors.
Ratings (Returns) : Buy (> 15%) Accumulate (5% to 15%) Neutral (-5 to 5%)
Reduce (-5% to 15%) Sell (< -15%)