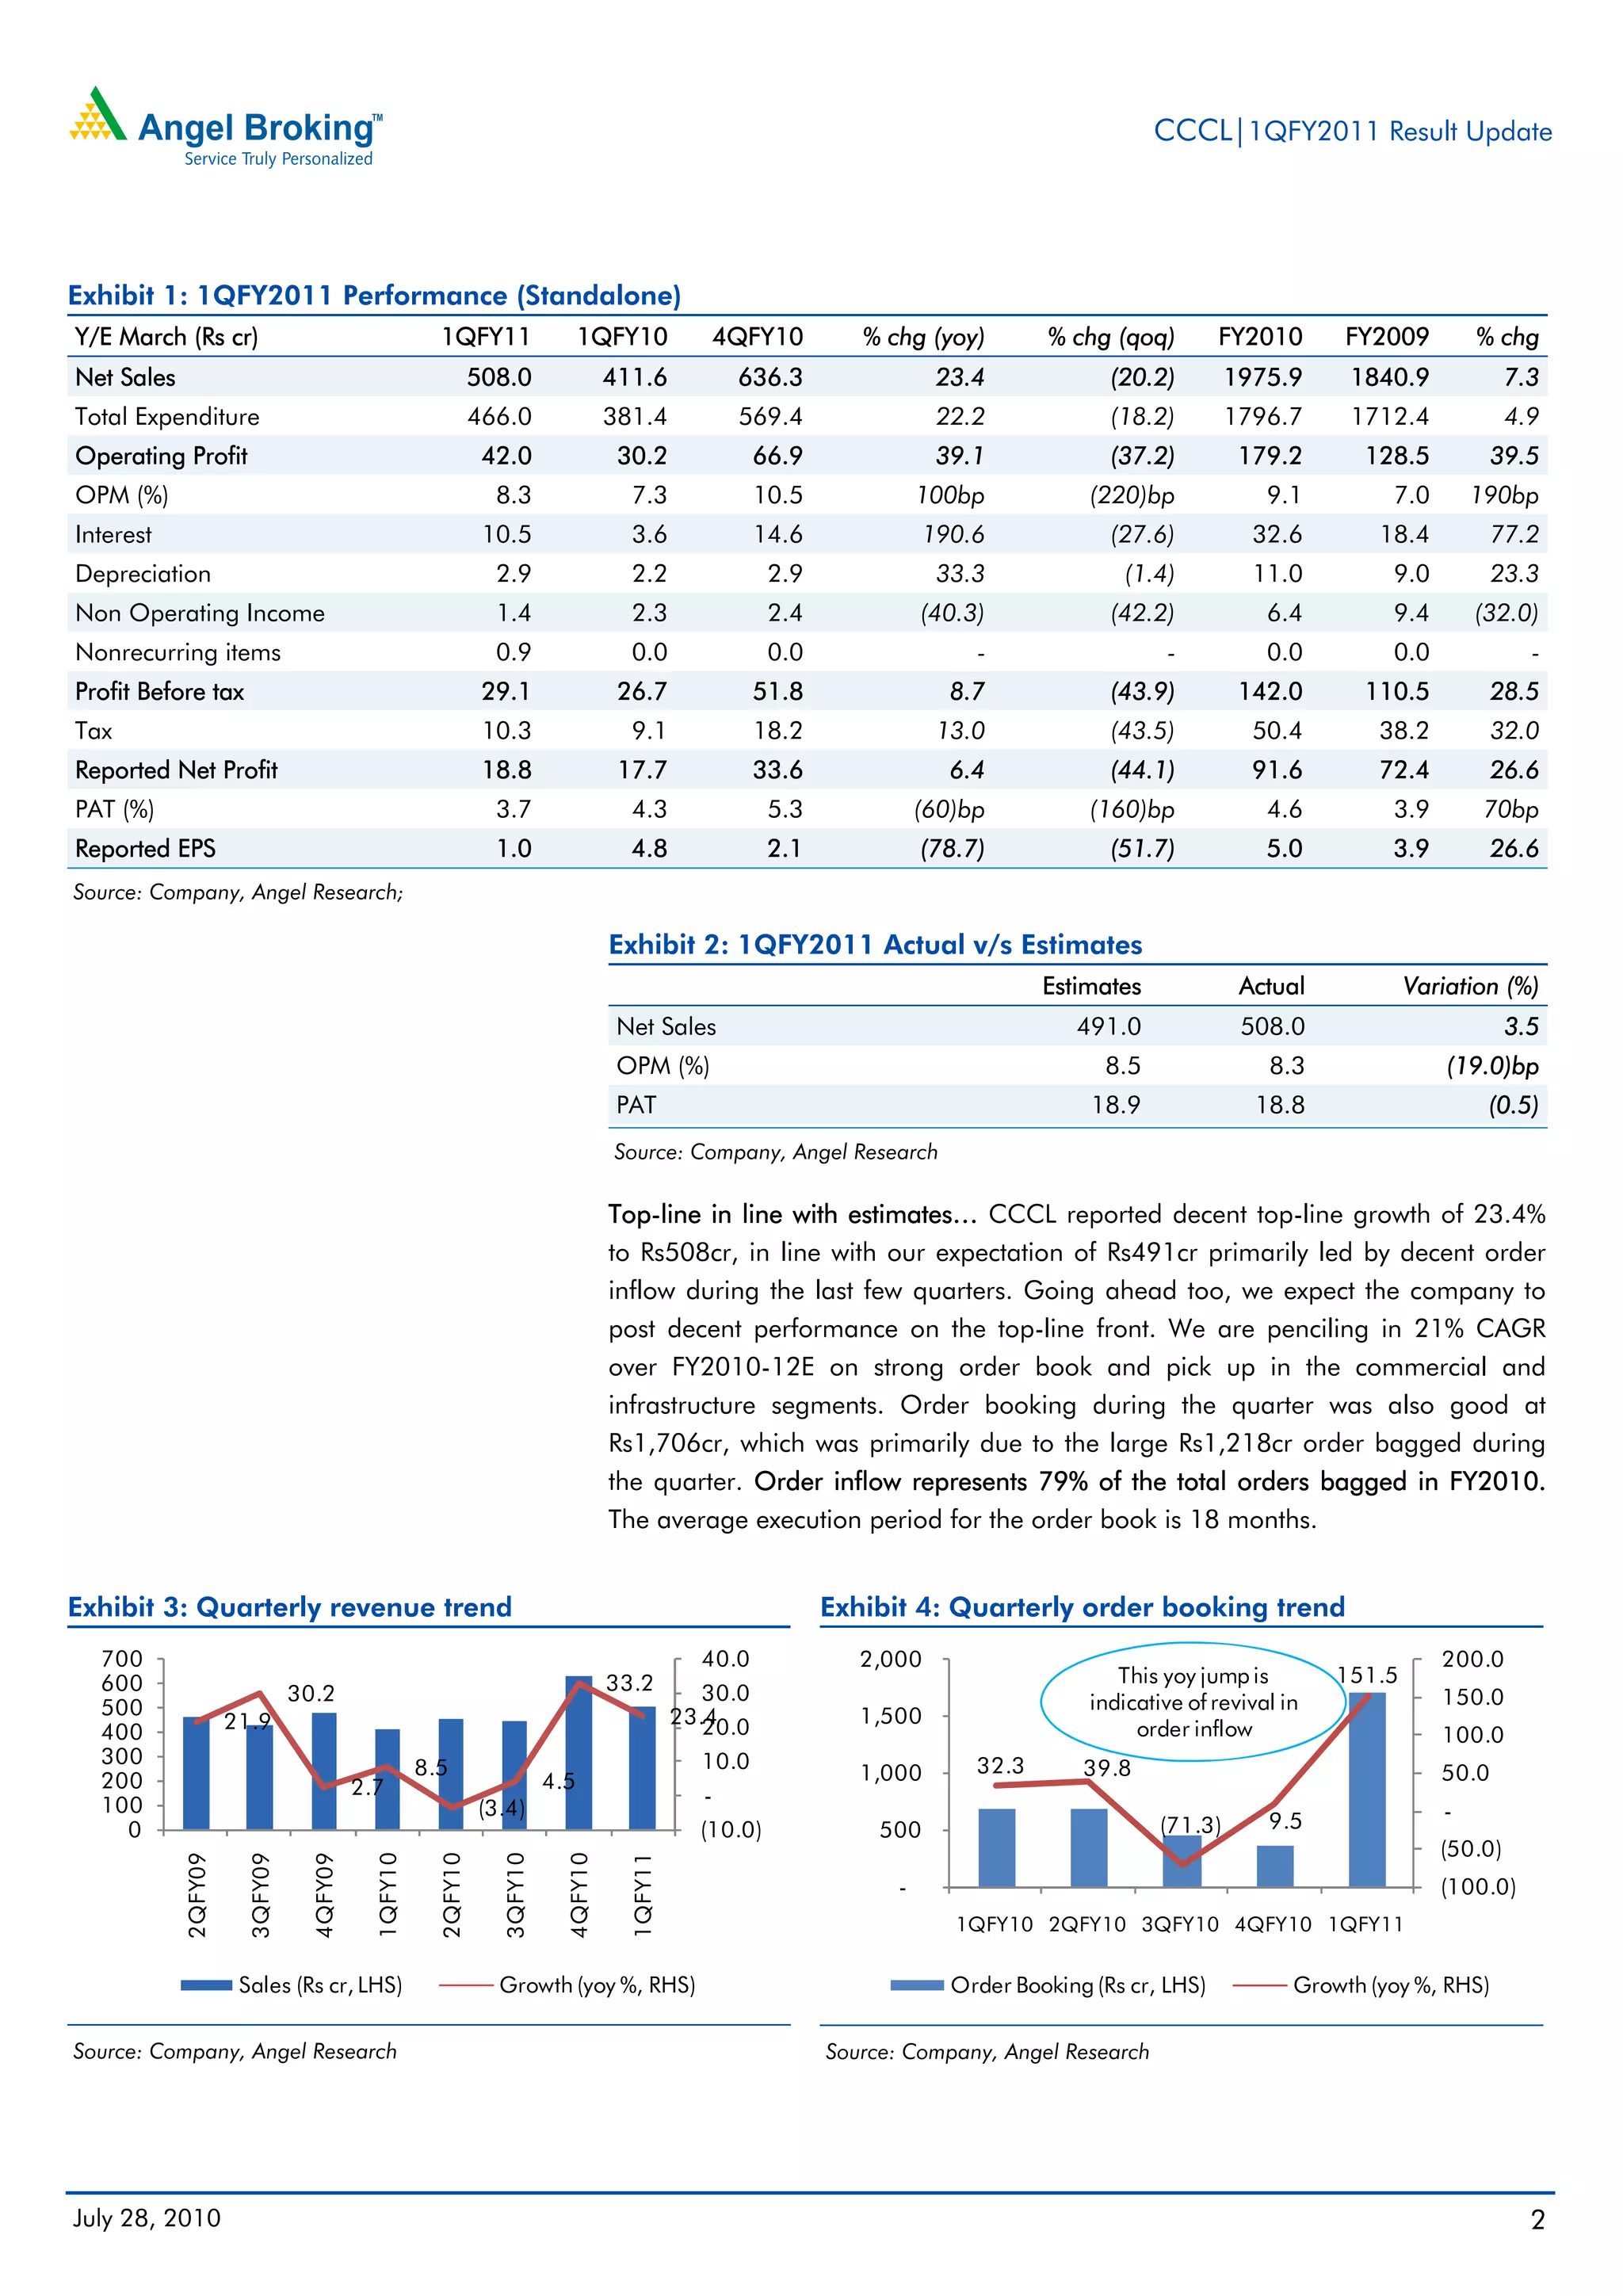
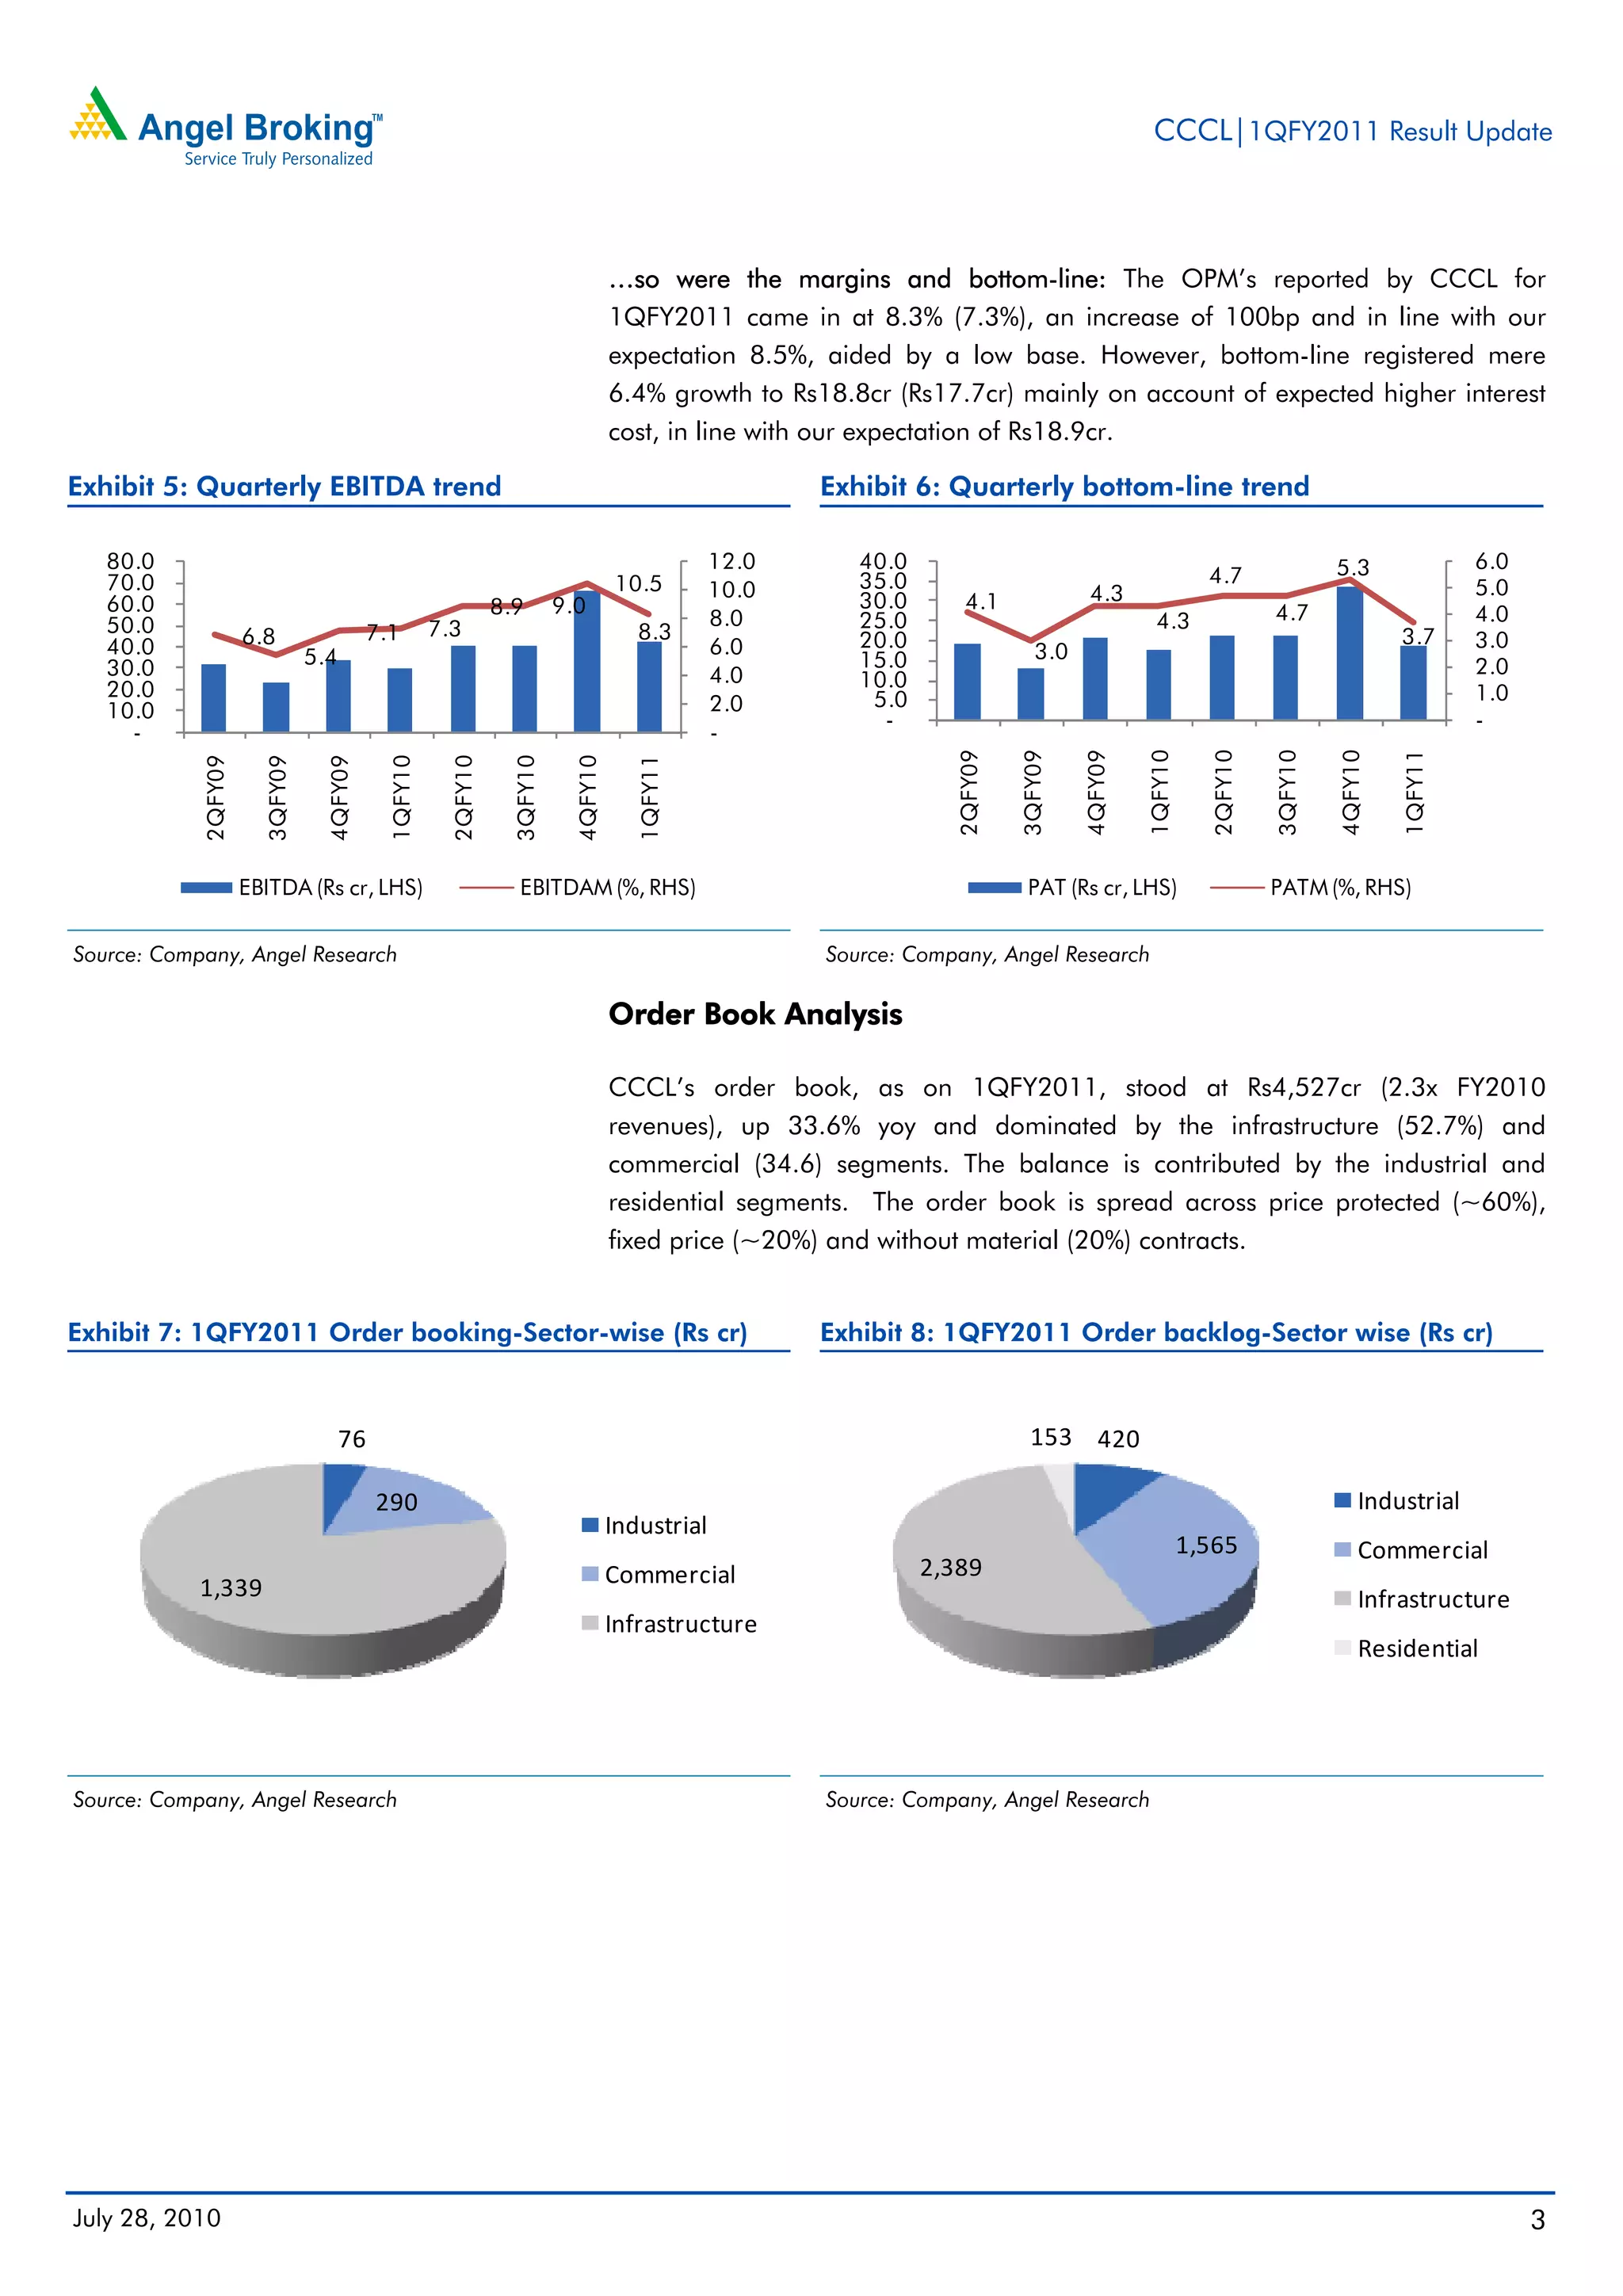
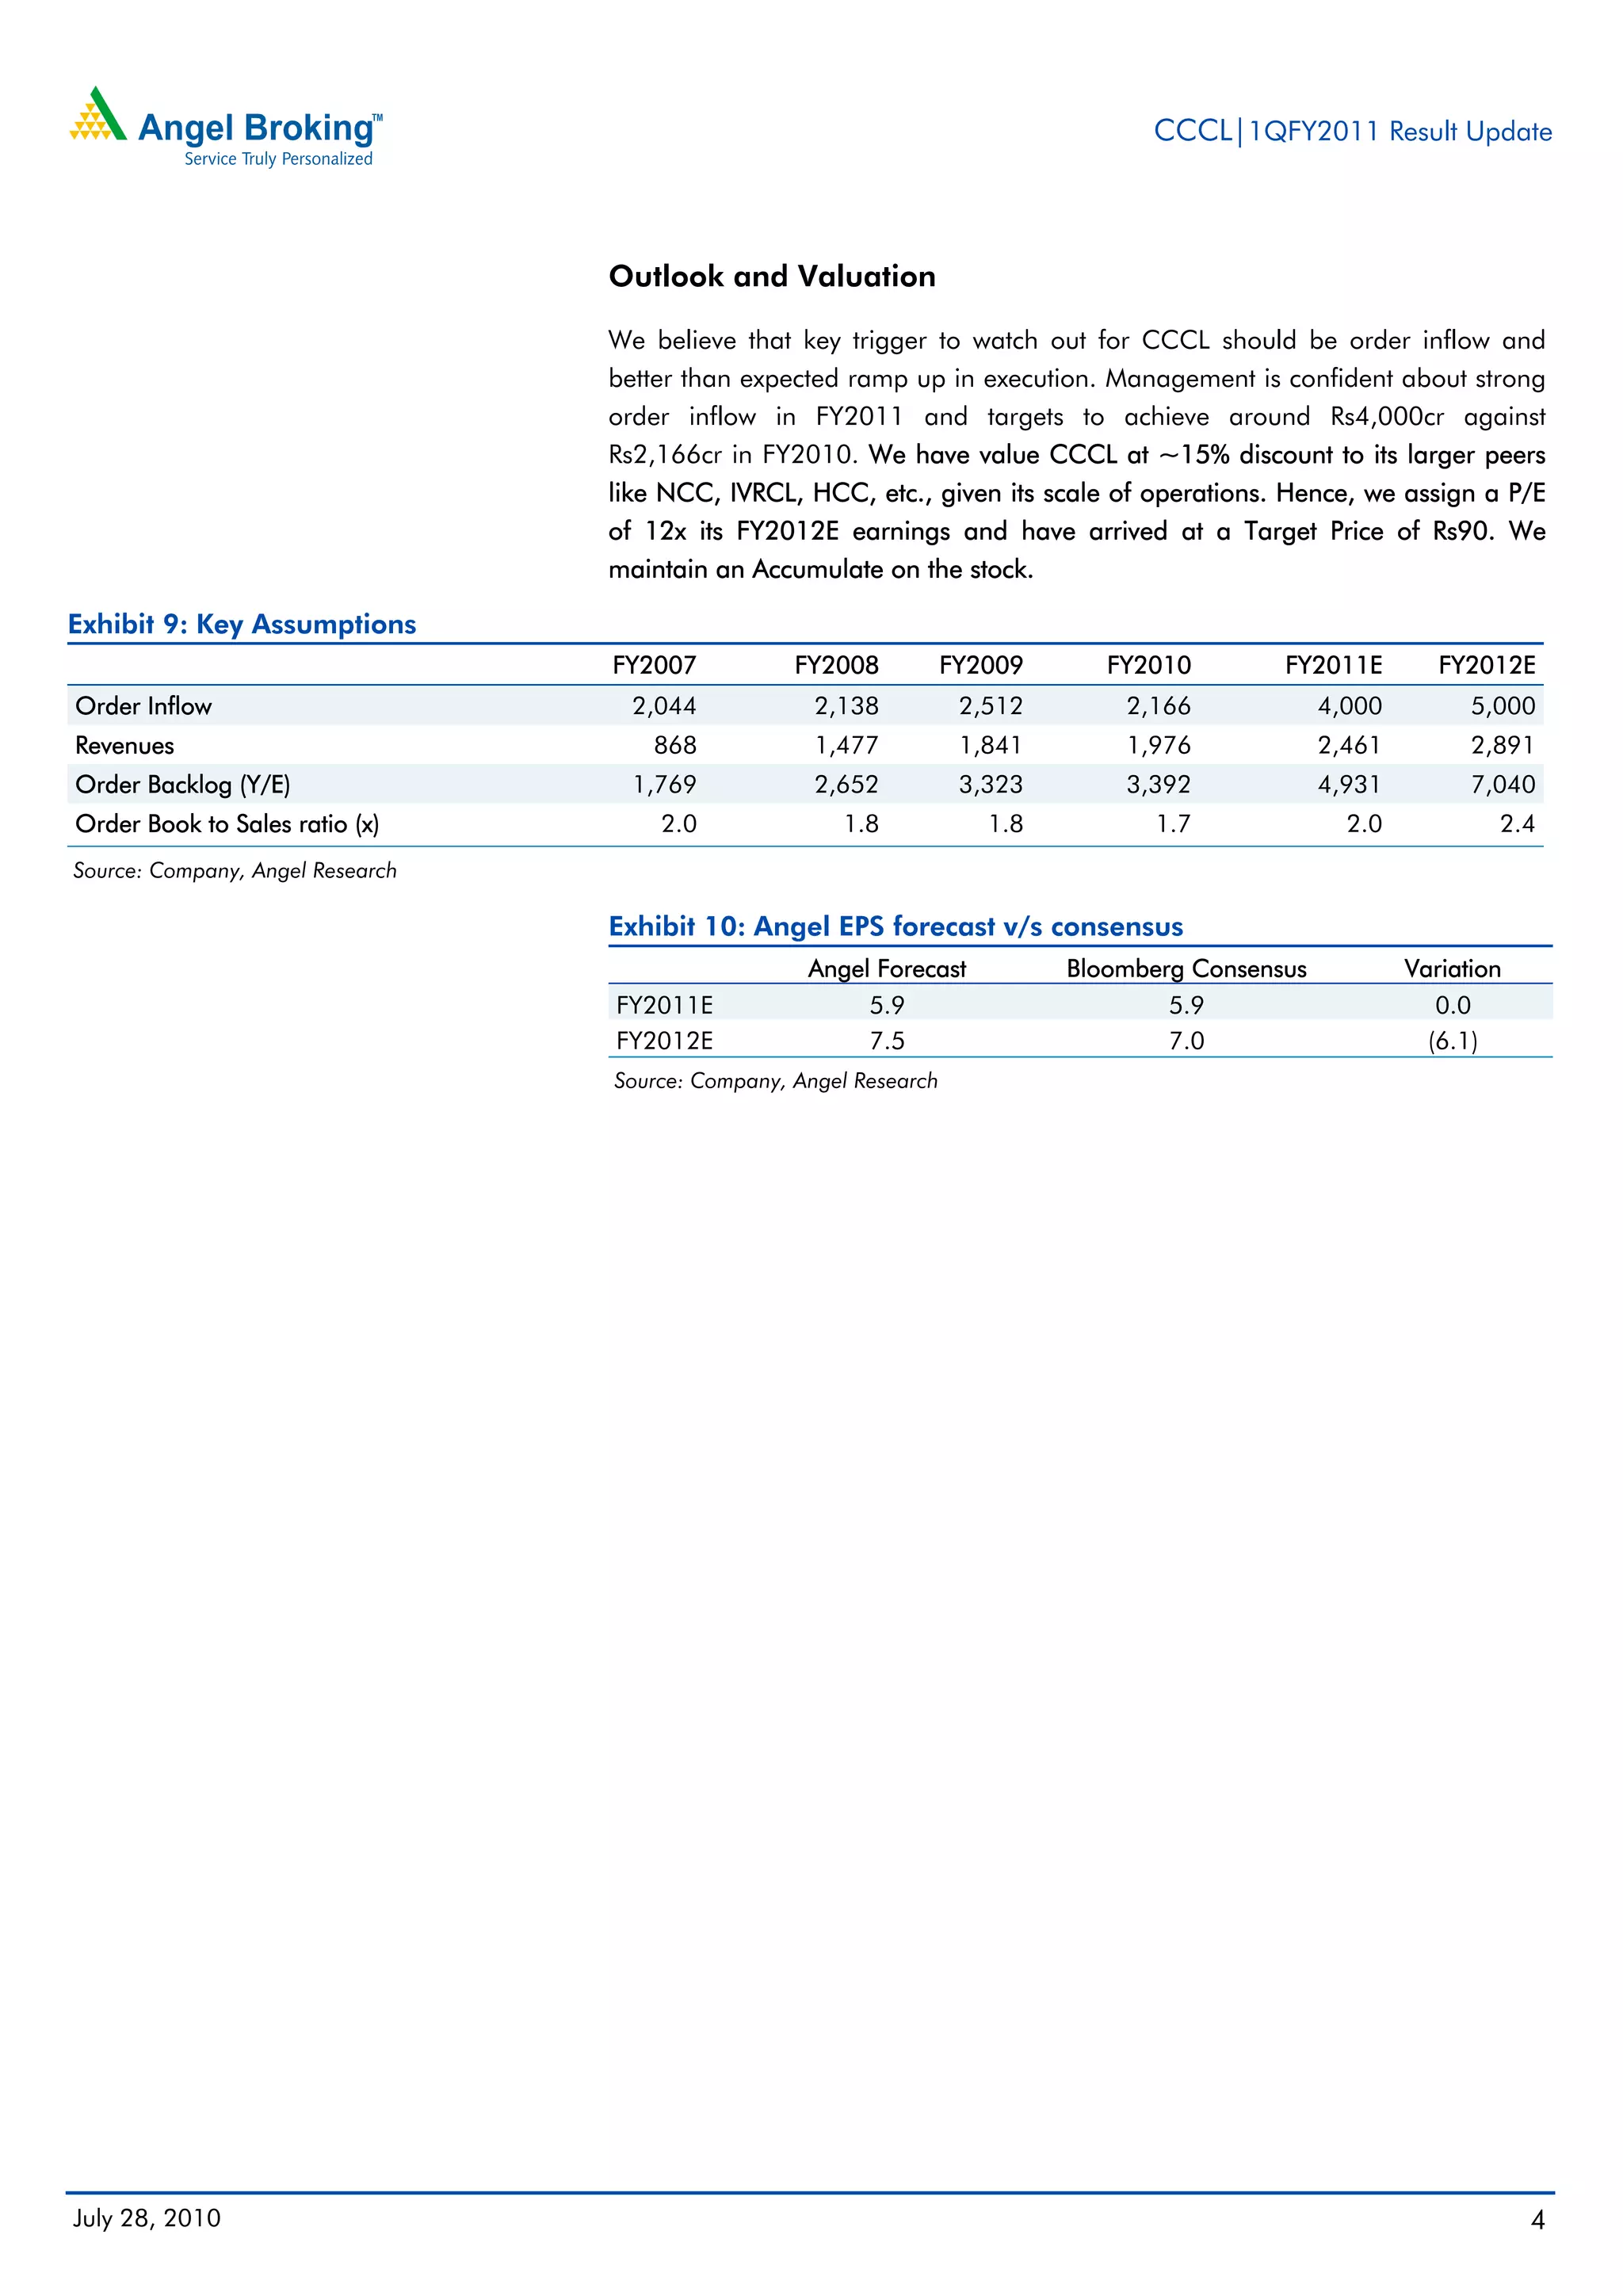
SlideShare a Scribd company logo
1QFY2011 Result Update | Infrastructure
                                                                                                                               July 28, 2010


     Consolidated Construction Consortium                                                     ACCUMULATE
                                                                                              CMP                                      Rs83
     Performance Highlights                                                                   Target Price                             Rs89


 Y/E March (Rs cr)            1QFY11       1QFY10 % chg (yoy) 4QFY10         % chg (qoq)      Investment Period                12 Months

 Net Sales                         508.0    411.6          23.4    636.3          (20.2)      Stock Info
 Operating Profit                   42.0     30.2          39.1     66.9          (37.2)      Sector                            Infrastructure
                                                                                              Market Cap (Rs cr)                       1,542
 Net Profit                         18.8     17.7            6.4    33.6          (44.1)
                                                                                              Beta                                       0.64
 Source: Company, Angel Research
                                                                                              52 Week High / Low                      98/46.1


 Consolidated construction consortium (CCCL) reported in-line net sales for                   Avg. Daily Volume                       23,223
 1QFY2011 led primarily by decent order inflow during the last few quarters. The              Face Value (Rs)                               2
 operating margins and earnings were also in line with our expectations. Order                BSE Sensex                              17,992
 inflow stood at Rs1,706cr during 1QFY2011, a yoy jump of ~152%, which we                     Nifty                                    5,409
 believe is indication of revival in the commercial and infrastructure segments.              Reuters Code                        CCON.BO
 CCCL’s order book at 2.3x FY2010 revenues, gives revenue visibility for the next             Bloomberg Code                     CCCL@IN
 couple of years. In light of the improving order inflow scenario, earnings CAGR of
 ~20% over FY2010-12E and decent return ratios, we maintain an Accumulate on
 the stock.                                                                                   Shareholding Pattern (%)
                                                                                              Promoters                                 50.6
 In-line results: CCCL reported decent top-line growth of 23.4% to Rs508cr in line            MF / Banks / Indian Fls                   10.9
 with our expectations of Rs491cr. OPM’s came in at 8.3% (7.3%), up by 100bp in               FII / NRIs / OCBs                         17.9
 line with our expectation of 8.5%, aided by a low base. However, bottom-line
                                                                                              Indian Public / Others                    20.6
 registered mere 6.4% yoy growth to Rs18.8cr (Rs17.7cr) mainly on account of the
 expected higher interest cost, in line with our expectation of Rs18.9cr.
                                                                                              Abs. (%)                  3m      1yr       3yr
 Outlook and Valuation: We believe the key triggers to watch out for CCCL should
                                                                                              Sensex                    2.2    17.6      (5.6)
 be order inflow and better-than-expected ramp up in execution. Management is
                                                                                              CCCL                     (5.8)   61.3     (47.4)
 confident about strong order inflow in FY2011 and targets to achieve around
 Rs4,000cr as against Rs2,166cr in FY2010. We value CCCL at ~15% discount to
 its larger peers like NCC, IVRCL, HCC, etc., given its scale of operations. Hence,
 we assign a P/E of 12x its FY2012E earnings and have arrived at a Target Price of
 Rs89. We maintain an Accumulate on the stock.

 Key Financials (Consolidated)
     Y/E March (Rs cr)                     FY2009       FY2010     FY2011E       FY2012E
     Net Sales (incl op. income)           1,840.9      1,975.9     2,461.3       2,891.0
     % chg                                    24.6           7.3      24.6           17.5
     Adj. Net Profit                          72.4         91.6      109.0          137.7
     % chg                                   (18.9)        26.6       19.0           26.3
     FDEPS (Rs)                                3.9           5.0           5.9        7.5
     EBITDA Margin (%)                         7.0           9.1           8.9        9.5
     P/E (x)                                  21.1         16.7       14.0           11.1    Shailesh Kanani
     RoAE (%)                                 14.9         16.6       17.1           18.4    022-40403800 Ext: 321
     RoACE (%)                                17.5         19.3       19.5           21.2    shailesh.kanani@angeltrade.com

     P/BV (x)                                  3.0           2.6           2.2        1.9
                                                                                             Aniruddha Mate
     EV/Sales (x)                              0.9           0.9           0.7        0.6
                                                                                             022-40403800 Ext: 335
     EV/EBITDA (x)                            12.4           9.5           7.8        6.4    aniruddha.mate@angeltrade.com


Please refer to important disclosures at the end of this report                                                                             1
CCCL|1QFY2011 Result Update


Exhibit 1: 1QFY2011 Performance (Standalone)
Y/E March (Rs cr)                                     1QFY11                    1QFY10                4QFY10        % chg (yoy)        % chg (qoq)         FY2010       FY2009        % chg
Net Sales                                                      508.0                 411.6             636.3                 23.4             (20.2)         1975.9     1840.9             7.3
Total Expenditure                                              466.0                 381.4             569.4                 22.2             (18.2)         1796.7     1712.4             4.9
Operating Profit                                                42.0                  30.2                66.9               39.1             (37.2)          179.2      128.5           39.5
OPM (%)                                                          8.3                   7.3                10.5             100bp            (220)bp             9.1         7.0       190bp
Interest                                                        10.5                   3.6                14.6              190.6             (27.6)           32.6        18.4          77.2
Depreciation                                                     2.9                   2.2                 2.9               33.3               (1.4)          11.0         9.0          23.3
Non Operating Income                                             1.4                   2.3                 2.4             (40.3)             (42.2)            6.4         9.4       (32.0)
Nonrecurring items                                               0.9                   0.0                 0.0                  -                   -           0.0         0.0              -
Profit Before tax                                               29.1                  26.7                51.8                8.7             (43.9)          142.0      110.5           28.5
Tax                                                             10.3                   9.1                18.2               13.0             (43.5)           50.4        38.2          32.0
Reported Net Profit                                             18.8                  17.7                33.6                6.4             (44.1)           91.6        72.4          26.6
PAT (%)                                                          3.7                   4.3                 5.3             (60)bp           (160)bp             4.6         3.9        70bp
Reported EPS                                                     1.0                   4.8                 2.1             (78.7)             (51.7)            5.0         3.9          26.6
Source: Company, Angel Research;

                                                                                     Exhibit 2: 1QFY2011 Actual v/s Estimates
                                                                                                                                       Estimates              Actual           Variation (%)
                                                                                      Net Sales                                           491.0               508.0                        3.5
                                                                                      OPM (%)                                                8.5                8.3                (19.0)bp
                                                                                      PAT                                                   18.9               18.8                    (0.5)
                                                                                     Source: Company, Angel Research

                                                                                     Top-line in line with estimates… CCCL reported decent top-line growth of 23.4%
                                                                                     to Rs508cr, in line with our expectation of Rs491cr primarily led by decent order
                                                                                     inflow during the last few quarters. Going ahead too, we expect the company to
                                                                                     post decent performance on the top-line front. We are penciling in 21% CAGR
                                                                                     over FY2010-12E on strong order book and pick up in the commercial and
                                                                                     infrastructure segments. Order booking during the quarter was also good at
                                                                                     Rs1,706cr, which was primarily due to the large Rs1,218cr order bagged during
                                                                                     the quarter. Order inflow represents 79% of the total orders bagged in FY2010.
                                                                                     The average execution period for the order book is 18 months.


Exhibit 3: Quarterly revenue trend                                                                               Exhibit 4: Quarterly order booking trend
  700                                                                                             40.0              2,000                                                         200.0
  600                                                                                33.2                                                      This yoy jump is        151.5
                               30.2                                                                30.0                                     indicative of revival in              150.0
  500                                                                                           23.4                1,500
  400                21.9                                                                          20.0                                          order inflow                     100.0
  300                                                                                             10.0                          32.3
                                                    8.5                                                             1,000                  39.8                                   50.0
  200                                    2.7                              4.5
  100                                                                                             -
                                                               (3.4)                                                                                                              -
    0                                                                                             (10.0)              500                           (71.3)      9.5
                                                                                                                                                                                  (50.0)
            2QFY09

                      3QFY09

                                4QFY09

                                           1QFY10

                                                      2QFY10

                                                                 3QFY10

                                                                            4QFY10

                                                                                       1QFY11


                                                                                                                       -                                                          (100.0)
                                                                                                                              1QFY10 2QFY10 3QFY10 4QFY10 1QFY11

                      Sales (Rs cr, LHS)                         Growth (yoy %, RHS)                                          Order Booking (Rs cr, LHS)           Growth (yoy %, RHS)

Source: Company, Angel Research                                                                                  Source: Company, Angel Research


July 28, 2010                                                                                                                                                                                2
CCCL|1QFY2011 Result Update


                                                                                   …so were the margins and bottom-line: The OPM’s reported by CCCL for
                                                                                   1QFY2011 came in at 8.3% (7.3%), an increase of 100bp and in line with our
                                                                                   expectation 8.5%, aided by a low base. However, bottom-line registered mere
                                                                                   6.4% growth to Rs18.8cr (Rs17.7cr) mainly on account of expected higher interest
                                                                                   cost, in line with our expectation of Rs18.9cr.

Exhibit 5: Quarterly EBITDA trend                                                                     Exhibit 6: Quarterly bottom-line trend

   80.0                                                                                        12.0      40.0                                                              5.3               6.0
   70.0                                                                            10.5                  35.0                                            4.7
                                                                                               10.0                                   4.3                                                    5.0
   60.0                                                        8.9       9.0                             30.0        4.1
                                                                                               8.0       25.0                                   4.3               4.7                        4.0
   50.0                                   7.1        7.3                              8.3
   40.0              6.8                                                                       6.0       20.0                                                                       3.7      3.0
                                5.4                                                                      15.0                  3.0
   30.0                                                                                        4.0                                                                                           2.0
   20.0                                                                                                  10.0
                                                                                               2.0        5.0                                                                                1.0
   10.0                                                                                                    -                                                                                 -
     -                                                                                         -


                                                                                                                   2QFY09

                                                                                                                            3QFY09

                                                                                                                                     4QFY09

                                                                                                                                              1QFY10

                                                                                                                                                         2QFY10

                                                                                                                                                                  3QFY10

                                                                                                                                                                           4QFY10

                                                                                                                                                                                    1QFY11
            2QFY09

                       3QFY09

                                 4QFY09

                                            1QFY10

                                                      2QFY10

                                                                3QFY10

                                                                          4QFY10

                                                                                      1QFY11


                     EBITDA (Rs cr, LHS)                         EBITDAM (%, RHS)                                             PAT (Rs cr, LHS)                    PATM (%, RHS)

Source: Company, Angel Research                                                                       Source: Company, Angel Research

                                                                                   Order Book Analysis

                                                                                   CCCL’s order book, as on 1QFY2011, stood at Rs4,527cr (2.3x FY2010
                                                                                   revenues), up 33.6% yoy and dominated by the infrastructure (52.7%) and
                                                                                   commercial (34.6) segments. The balance is contributed by the industrial and
                                                                                   residential segments. The order book is spread across price protected (~60%),
                                                                                   fixed price (~20%) and without material (20%) contracts.


Exhibit 7: 1QFY2011 Order booking-Sector-wise (Rs cr)                                                 Exhibit 8: 1QFY2011 Order backlog-Sector wise (Rs cr)


                                      76                                                                                      153  420 

                                            290                                                                                                                                Industrial 
                                                                                   Industrial 
                                                                                                                                                       1,565                   Commercial 
                                                                                   Commercial                   2,389 
            1,339                                                                                                                                                              Infrastructure 
                                                                                   Infrastructure 
                                                                                                                                                                               Residential


Source: Company, Angel Research                                                                       Source: Company, Angel Research


July 28, 2010                                                                                                                                                                                      3
CCCL|1QFY2011 Result Update


                                  Outlook and Valuation

                                  We believe that key trigger to watch out for CCCL should be order inflow and
                                  better than expected ramp up in execution. Management is confident about strong
                                  order inflow in FY2011 and targets to achieve around Rs4,000cr against
                                  Rs2,166cr in FY2010. We have value CCCL at ~15% discount to its larger peers
                                  like NCC, IVRCL, HCC, etc., given its scale of operations. Hence, we assign a P/E
                                  of 12x its FY2012E earnings and have arrived at a Target Price of Rs90. We
                                  maintain an Accumulate on the stock.

Exhibit 9: Key Assumptions
                                  FY2007           FY2008           FY2009      FY2010        FY2011E         FY2012E
Order Inflow                        2,044            2,138           2,512       2,166             4,000         5,000
Revenues                             868             1,477           1,841       1,976             2,461         2,891
Order Backlog (Y/E)                 1,769            2,652           3,323       3,392             4,931         7,040
Order Book to Sales ratio (x)         2.0              1.8             1.8          1.7              2.0           2.4
Source: Company, Angel Research

                                  Exhibit 10: Angel EPS forecast v/s consensus
                                                    Angel Forecast           Bloomberg Consensus           Variation
                                  FY2011E                5.9                         5.9                      0.0
                                  FY2012E                7.5                         7.0                     (6.1)
                                  Source: Company, Angel Research


July 28, 2010                                                                                                          4
CCCL|1QFY2011 Result Update


                Investment Argument

                Pure construction play: CCCL provides turn-key construction services in the
                infrastructure, industrial, commercial and residential segments of the construction
                industry. The company has executed and is in the process of executing projects
                across several states and union territories in India. CCCL, over the years, has built
                strong credibility in the commercial / hospitality and industrial contracting space. It
                is reputed for high quality execution within challenging time schedules along with
                strong management credentials. Further, in the past, CCCL has executed a
                number of projects and nurtured strong relationships with many clients including IT
                firms like Infosys and HCL Technology. Around 50% of CCCL's order book
                constitutes repeat orders from existing clients. We believe that CCCL's strong
                relationship with the blue chips will help it to continue on growth path going
                forward.


July 28, 2010                                                                                        5
CCCL|1QFY2011 Result Update


Exhibit 11: Recommendation Summary
 Company        CMP      TP          Rating                         Top-line                                      EPS (Rs)                            Adj. P/E (x)                OB/
                 (Rs)   (Rs)                       FY10         FY11E         FY12E CAGR (%)        FY10      FY11E       FY12E CAGR (%)    FY10        FY11E        FY12E Sale (x)
 CCCL            84      89 Accumulate             1,976         2,444        2,871         20.5        5.0     6.0         7.5      22.5   17.2          14.4           11.5     2.3
 Gammon         214        -        Neutral        4,489         5,575        6,607         21.3        8.4    10.0        12.1      20.0   13.0          11.0            9.0     2.5
 HCC            133        -        Neutral        3,629         4,146        4,900         16.2        2.7     3.2         3.8      18.8   21.6          18.4           15.3     4.7
 IRB Infra      263     275         Neutral        1,705         2,778        3,580         44.9    11.6       12.3        14.5      11.8   22.2          20.8           17.7          -
 IVRCL          176     216            Buy         5,492         6,663        8,294         22.9        7.8     9.6        12.0      23.9   16.3          13.3           10.6     4.3
 JP Assoc.      121     178            Buy     10,316           13,281    17,843            31.5        4.7     5.2         7.7      28.5   26.0          23.2           15.8          -
 Punj           130     170            Buy     10,539           11,088    13,407            12.8   (11.1)       8.3        12.2         -         -       15.8           10.7     2.8
 NCC            178        -        Neutral        4,778         5,913        6,758         18.9        7.8    10.0        10.7      17.4   22.8          17.8           16.6     3.6
 Sadbhav       1,290       -        Neutral        1,257         1,560        1,911         23.3    43.0       57.5        69.5      27.1   20.3          15.2           12.5     5.4
 SI.            476     570            Buy         4,555         5,535        6,428         18.8    25.7       31.9        40.7      25.9   18.5          14.9           11.7     2.5
 PEL            409     563            Buy         3,081         3,685        4,297         18.1    23.4       31.2        32.9      18.6   13.1           9.8            9.3     3.5
 MPL            157     190            Buy         1,308         1,701        2,120         27.3        5.8     6.4         9.8      29.8    9.3           8.4            5.5     3.1
 L&T           1,863       -        Neutral    37,035           44,047    55,519            22.4    47.5       55.1        68.9      20.4   30.9          26.7           21.3     2.7

 Source: Company, Angel Research


Exhibit 12: Recommendation Summary - SOTP break up
 Company                        Core Const.                     Real Estate                Road BOT             Invst. In Subsidiaries                    Others                Total
                               Rs    % to TP               Rs      % to TP            Rs     % to TP              Rs              % to TP    Rs          % to TP                   Rs
 CCCL                      89            100                -                          -                              -                       -                                   89
 Gammon India            121                  54            -                          -                              -                     104                  46              225
 HCC                       53                 41       59                46       16               13                 -                       -                      -           128
 IRB Infra               113                  41           3             1       154               56                 5                2      -                                  275
 IVRCL                   168                  78            -                          -                          48                  22      -                                  216
 Punj Lloyd              170             100                -                          -                              -                       -                                  170
 NCC                     152                  82       18                10       16               8                  -                       -                                  186
 Simplex In.             570             100                -                          -                              -                       -                                  570
 Patel Engg              460                  82      103                18            -            -                 -                       -                                  563
 Madhucon                  98                 52           4             2             -            -             88                  46      -                                  190
 L&T                    1,447                 79            -                          -                        394                   21      -                                 1,841
 Source: Company, Angel Research


July 28, 2010                                                                                                                                                                      6
CCCL|1QFY2011 Result Update


                Profit & Loss Statement (Consolidated)
                Y/E March (Rs cr)                  FY2007 FY2008 FY2009 FY2010 FY2011E FY2012E
                Net Sales                            868    1,477    1,841    1,976   2,461   2,891
                Other operating income                  -       -         -       -       -        -
                Total operating income               868    1,477    1,841    1,976   2,461   2,891
                % chg                               103.6    70.1      24.6     7.3    24.6    17.5
                Total Expenditure                    794    1,308    1,712    1,797   2,242   2,617
                Net Raw Materials                    713     959     1,439    1,545   1,702   2,015
                Other Mfg costs                         -    217        47        -    255     264
                Personnel                             40      71       106     114     137     173
                Other                                 40      61       120     138     148     165
                EBITDA                                75     169       128     179     219     274
                % chg                               113.4   126.8    (24.1)    39.5    22.4    24.9
                (% of Net Sales)                      8.6    11.5       7.0     9.1     8.9     9.5
                Dep. & Amortisation                    4       6         9      11      15      19
                EBIT                                  71     164       120     168     204     255
                % chg                               114.6   130.6    (27.0)    40.7    21.4    24.8
                (% of Net Sales)                      8.2    11.1       6.5     8.5     8.3     8.8
                Interest & other Charges               7      12        18      33      45      52
                Other Income (pft from Ass/JV)          -      8         9       6       6         6
                (% of PBT)                              -     4.9       8.5     4.5     3.3     2.6
                Recurring PBT                         64     160       111     142     165     209
                % chg                               120.9   149.5    (31.0)    28.5    16.3    26.3
                Extraordinary Expense/(Inc.)            -      0          -       -       -        -
                PBT (reported)                        64     160       111     142     165     209
                Tax                                   16      45        38      50      56      71
                (% of PBT)                           25.7    28.3      34.5    35.5    34.0    34.0
                PAT (reported)                        48     115        72      92     109     138
                Add: Share of earnings of ass.
                Less: Minority interest (MI)            -       -         -       -       -        -
                Prior period items                      -       -         -       -       -        -
                PAT after MI (reported)               48     115        72      92     109     138
                ADJ. PAT                              48      89        72      92     109     138
                % chg                               147.1    87.2    (18.9)    26.6    19.0    26.3
                (% of Net Sales)                      5.5     6.0       3.9     4.6     4.4     4.8
                Basic EPS (Rs) (Reported)             7.2     6.2       3.9     5.0     5.9     7.5
                Fully Diluted EPS (Rs) (Diluted)      2.6     4.8       3.9     5.0     5.9     7.5
                % chg                                        87.2    (18.9)    26.6    19.0    26.3


July 28, 2010                                                                                  7
CCCL|1QFY2011 Result Update


                Balance Sheet (Consolidated)
                Y/E March (Rs cr)           FY2007 FY2008 FY2009     FY2010 FY2011E FY2012E
                SOURCES OF FUNDS
                Equity Share Capital          13.3    37.0    37.0     37.0     37.0      37.0
                Preference Capital               -       -       -        -         -         -
                Reserves& Surplus            174.0   416.8   479.1    552.3    649.4     775.2
                Shareholders’ Funds          187.3   453.8   516.1    589.2    686.3     812.2
                Minority Interest                -       -       -        -         -         -
                Total Loans                  115.4   125.5   197.6    338.8    365.7     420.6
                Deferred Tax Liability        16.6    29.6    44.2     59.5     59.5      59.5
                Total Liabilities            319.3   608.8   757.8    987.6   1,111.6   1,292.3
                APPLICATION OF FUNDS
                Gross Block                   59.2    94.3   160.6    189.7    259.7     329.7
                Less: Acc. Depreciation        8.0    13.4    22.1     33.1     48.2      67.4
                Net Block                     51.2    80.9   138.4    156.6    211.5     262.3
                Capital Work-in-Progress       2.6     2.1     6.4     15.5     15.5      15.5
                Investments                    0.1    99.1    56.9      9.4       9.4       9.4
                Current Assets               504.4   865.2 1,089.4 1,358.4    1,599.4   1,854.0
                Inventories                  339.2   632.7   807.0 1,020.1    1,215.5   1,427.7
                Sundry Debtors                 4.5    12.5     8.8     12.0     11.8      13.9
                Cash                          88.9    87.7   129.9    170.1    179.9     186.7
                Loans & Advances              71.9   132.2   143.7    156.2    192.2     225.7
                Other                            -       -       -        -         -         -
                Current liabilities          240.6   452.4   545.7    553.8    725.6     850.4
                Net Current Assets           263.8   412.8   543.7    804.6    873.7    1,003.6
                Mis. Exp. not written off      1.6    14.2    12.4      1.4       1.4       1.4
                Total Assets                 319.3   609.1   757.8    987.6   1,111.6   1,292.3


July 28, 2010                                                                                8
CCCL|1QFY2011 Result Update


                Cash Flow Statement (Consolidated)
                Y/E March (Rs cr)                FY2007 FY2008 FY2009 FY2010 FY2011E FY2012E
                Profit before tax (excluding MI)   64.2 159.9 110.5 142.0      165.2   208.6
                Depreciation                     3.6      5.6       9.0     11.0     15.1     19.2
                Change in Working Capital      102.0    159.0      88.8    220.6     59.4    123.0
                Less: Other income                  -     7.9       9.4      6.4      5.5      5.5
                Direct taxes paid                7.8     32.2      23.6     37.7     56.2     70.9
                Cash Flow from Operations      (41.9)   (33.7)     (2.2) (111.7)     59.2     28.4
                (Inc.)/ Dec. in Fixed Assets   (40.6)   (36.7)    (70.6)   (38.2)   (70.0)   (70.0)
                (Inc.)/ Dec. in Investments     (0.1)   (99.1)     42.2     47.5         -         -
                Other income                        -     7.9       9.4      6.4      5.5      5.5
                Cash Flow from Investing       (40.7) (127.9)     (18.9)    15.6    (64.5)   (64.5)
                Issue of Equity                  1.4    188.7          -        -        -         -
                Inc./(Dec.) in loans            86.2     10.0      72.1    141.2     26.9     54.9
                Dividend Paid (Incl. Tax)        5.2     10.8       9.2     10.8     11.9     11.9
                Others                            (1)     (28)        0        6         -         -
                Cash Flow from Financing        81.7    160.4      63.3    136.3     15.0     43.0
                Inc./(Dec.) in Cash             (0.9)    (1.2)     42.2     40.3      9.7      6.8
                Opening Cash balances           89.8     88.9      87.7    129.9    170.1    179.9
                Closing Cash balances           88.9     87.7     129.9    170.1    179.9    186.7


July 28, 2010                                                                                  9
CCCL|1QFY2011 Result Update


                Key Ratios
                Y/E March                  FY2007 FY2008 FY2009   FY2010 FY2011E FY2012E
                Valuation Ratio (x)
                P/E (on FDEPS)               32.0   17.1   21.1     16.7    14.0    11.1
                P/CEPS                       29.7   16.1   18.8     14.9    12.3    10.1
                P/BV                          8.1    3.4    3.0      2.6     2.2     1.9
                Dividend yield (%)            1.2    0.6    0.6      0.8     0.8     0.8
                EV/Sales                      1.8    1.1    0.9      0.9     0.7     0.6
                EV/EBITDA                    20.8    9.2   12.4      9.5     7.8     6.6
                EV / Total Assets             4.9    2.6    2.1      1.7     1.5     1.4
                Per Share Data (Rs)
                EPS (Basic)                   7.2    6.2    3.9      5.0     5.9     7.5
                EPS (fully diluted)           2.6    4.8    3.9      5.0     5.9     7.5
                Cash EPS                      2.8    5.1    4.4      5.6     6.7     8.5
                DPS                           1.0    0.5    0.5      0.7     0.7     0.7
                Book Value                   10.1   24.6   27.9     31.9    37.1    44.0
                Dupont Analysis
                EBIT margin                   8.2   11.1    6.5      8.5     8.3     8.8
                Tax retention ratio           0.7    0.7    0.7      0.6     0.7     0.7
                Asset turnover (x)            3.8    3.9    3.2      2.7     2.8     2.8
                ROIC (Post-tax)              22.9   31.3   13.6     15.0    15.4    16.5
                Cost of Debt (Post Tax)       4.4    6.9    7.5      7.8     8.4     8.7
                Leverage (x)                  0.1    0.1    0.1      0.2     0.3     0.3
                Operating ROE                25.5   33.7   14.3     16.5    17.4    18.7
                Returns (%)
                ROACE (Pre-tax)              22.2   35.3   17.5     19.3    19.5    21.2
                Angel ROIC (Pre-tax)         30.8   43.6   20.8     23.3    23.4    25.0
                ROAE                         25.5   27.8   14.9     16.6    17.1    18.4
                Turnover ratios (x)
                Asset Turnover (Gross
                                             14.7   19.2   14.4     11.3    11.0     9.8
                Block)
                Inventory / Sales (days)     143    120     143     169     166      167
                Receivables (days)             2      2       2       2       2        2
                Payables (days)               63     77      93     100      93       98
                WC cycle (ex-cash)
                                             73.5   61.8   73.3     96.8    98.5    95.4
                (days)
                Solvency ratios (x)
                Net debt to equity            0.1    0.1    0.1      0.3     0.3     0.3
                Net debt to EBITDA            0.4    0.2    0.5      0.9     0.8     0.9
                Interest Coverage (EBIT
                                             10.3   14.2    6.5      5.2     4.6     4.9
                / Interest)


July 28, 2010                                                                         10
CCCL|1QFY2011 Result Update


  Research Team Tel: 022 - 4040 3800                E-mail: research@angeltrade.com                   Website: www.angeltrade.com

  DISCLAIMER
  This document is solely for the personal information of the recipient, and must not be singularly used as the basis of any investment
  decision. Nothing in this document should be construed as investment or financial advice. Each recipient of this document should make
  such investigations as they deem necessary to arrive at an independent evaluation of an investment in the securities of the companies
  referred to in this document (including the merits and risks involved), and should consult their own advisors to determine the merits and
  risks of such an investment.

  Angel Broking Limited, its affiliates, directors, its proprietary trading and investment businesses may, from time to time, make
  investment decisions that are inconsistent with or contradictory to the recommendations expressed herein. The views contained in this
  document are those of the analyst, and the company may or may not subscribe to all the views expressed within.

  Reports based on technical and derivative analysis center on studying charts of a stock's price movement, outstanding positions and
  trading volume, as opposed to focusing on a company's fundamentals and, as such, may not match with a report on a company's
  fundamentals.

  The information in this document has been printed on the basis of publicly available information, internal data and other reliable
  sources believed to be true, but we do not represent that it is accurate or complete and it should not be relied on as such, as this
  document is for general guidance only. Angel Broking Limited or any of its affiliates/ group companies shall not be in any way
  responsible for any loss or damage that may arise to any person from any inadvertent error in the information contained in this report.
  Angel Broking Limited has not independently verified all the information contained within this document. Accordingly, we cannot testify,
  nor make any representation or warranty, express or implied, to the accuracy, contents or data contained within this document. While
  Angel Broking Limited endeavours to update on a reasonable basis the information discussed in this material, there may be regulatory,
  compliance, or other reasons that prevent us from doing so.
  This document is being supplied to you solely for your information, and its contents, information or data may not be reproduced,
  redistributed or passed on, directly or indirectly.

  Angel Broking Limited and its affiliates may seek to provide or have engaged in providing corporate finance, investment banking or
  other advisory services in a merger or specific transaction to the companies referred to in this report, as on the date of this report or in
  the past.

  Neither Angel Broking Limited, nor its directors, employees or affiliates shall be liable for any loss or damage that may arise from or in
  connection with the use of this information.

  Note: Please refer to the important `Stock Holding Disclosure' report on the Angel website (Research Section). Also, please
  refer to the latest update on respective stocks for the disclosure status in respect of those stocks. Angel Broking Limited and
  its affiliates may have investment positions in the stocks recommended in this report.


 Disclosure of Interest Statement                                                  CCCL
 1. Analyst ownership of the stock                                                  No
 2. Angel and its Group companies ownership of the stock                            No
 3. Angel and its Group companies' Directors ownership of the stock                 No
 4. Broking relationship with company covered                                       No

 Note: We have not considered any Exposure below Rs 1 lakh for Angel, its Group companies and Directors.


 Ratings (Returns):              Buy (> 15%)                      Accumulate (5% to 15%)                 Neutral (-5 to 5%)
                                 Reduce (-5% to 15%)              Sell (< -15%)


July 28, 2010                                                                                                                             11

More Related Content

What's hot

L&T - Result Update RU2QFY2011
L&T - Result Update RU2QFY2011L&T - Result Update RU2QFY2011
L&T - Result Update RU2QFY2011Angel Broking
 
Dlf ru4 qfy2010-17052010
Dlf  ru4 qfy2010-17052010Dlf  ru4 qfy2010-17052010
Dlf ru4 qfy2010-17052010Angel Broking
 
Sail steel ru4 qfy2010-310510
Sail steel ru4 qfy2010-310510Sail steel ru4 qfy2010-310510
Sail steel ru4 qfy2010-310510Angel Broking
 
Bhel 020212
Bhel 020212Bhel 020212
Bhel 020212
Varun Mathur
 
Concor -Result Update
Concor -Result UpdateConcor -Result Update
Concor -Result UpdateAngel Broking
 
McNally Result Update 4qfy2010-180510
McNally Result Update 4qfy2010-180510McNally Result Update 4qfy2010-180510
McNally Result Update 4qfy2010-180510Angel Broking
 
All cargo result update 1 qcy2010 050510
All cargo result update 1 qcy2010 050510All cargo result update 1 qcy2010 050510
All cargo result update 1 qcy2010 050510Angel Broking
 
Exide 2 qfy2011ru-121010
Exide 2 qfy2011ru-121010Exide 2 qfy2011ru-121010
Exide 2 qfy2011ru-121010Angel Broking
 
Hcl tech 1 qfy2011-211010
Hcl tech  1 qfy2011-211010Hcl tech  1 qfy2011-211010
Hcl tech 1 qfy2011-211010Angel Broking
 

What's hot (20)

L&T - Result Update RU2QFY2011
L&T - Result Update RU2QFY2011L&T - Result Update RU2QFY2011
L&T - Result Update RU2QFY2011
 
Dlf ru4 qfy2010-17052010
Dlf  ru4 qfy2010-17052010Dlf  ru4 qfy2010-17052010
Dlf ru4 qfy2010-17052010
 
Sail steel ru4 qfy2010-310510
Sail steel ru4 qfy2010-310510Sail steel ru4 qfy2010-310510
Sail steel ru4 qfy2010-310510
 
Bhel 020212
Bhel 020212Bhel 020212
Bhel 020212
 
Concor -Result Update
Concor -Result UpdateConcor -Result Update
Concor -Result Update
 
McNally Result Update 4qfy2010-180510
McNally Result Update 4qfy2010-180510McNally Result Update 4qfy2010-180510
McNally Result Update 4qfy2010-180510
 
Bosch
BoschBosch
Bosch
 
All cargo result update 1 qcy2010 050510
All cargo result update 1 qcy2010 050510All cargo result update 1 qcy2010 050510
All cargo result update 1 qcy2010 050510
 
Exide
Exide Exide
Exide
 
Deccan Chronicle
Deccan Chronicle Deccan Chronicle
Deccan Chronicle
 
Jyoti Structures
Jyoti Structures  Jyoti Structures
Jyoti Structures
 
GDL
GDLGDL
GDL
 
Exide 2 qfy2011ru-121010
Exide 2 qfy2011ru-121010Exide 2 qfy2011ru-121010
Exide 2 qfy2011ru-121010
 
SAIL
SAILSAIL
SAIL
 
Hcl tech 1 qfy2011-211010
Hcl tech  1 qfy2011-211010Hcl tech  1 qfy2011-211010
Hcl tech 1 qfy2011-211010
 
Mphasis
MphasisMphasis
Mphasis
 
Wipro
Wipro  Wipro
Wipro
 
Idea Cellular
Idea  CellularIdea  Cellular
Idea Cellular
 
RIL - result Update
RIL - result UpdateRIL - result Update
RIL - result Update
 
Exide Industries
Exide IndustriesExide Industries
Exide Industries
 

Similar to CCCl (20)

Tcs Result Update
Tcs  Result UpdateTcs  Result Update
Tcs Result Update
 
Ashok leyland ru4 qfy2010-300410
Ashok leyland ru4 qfy2010-300410Ashok leyland ru4 qfy2010-300410
Ashok leyland ru4 qfy2010-300410
 
JP Associates
JP AssociatesJP Associates
JP Associates
 
Kec International
Kec International Kec International
Kec International
 
Bharat forge ru4 qfy2010-210510
Bharat forge ru4 qfy2010-210510Bharat forge ru4 qfy2010-210510
Bharat forge ru4 qfy2010-210510
 
NCC
NCCNCC
NCC
 
Hcl tech ru3 qfy2010-22042010
Hcl tech ru3 qfy2010-22042010Hcl tech ru3 qfy2010-22042010
Hcl tech ru3 qfy2010-22042010
 
HCC
HCCHCC
HCC
 
Larsen & Tourbo
Larsen & TourboLarsen & Tourbo
Larsen & Tourbo
 
Crompton Greaves
Crompton Greaves Crompton Greaves
Crompton Greaves
 
Blue Star
Blue StarBlue Star
Blue Star
 
FAG Bearing
FAG BearingFAG Bearing
FAG Bearing
 
Hindalco Novelis
Hindalco Novelis Hindalco Novelis
Hindalco Novelis
 
Persistent systems
Persistent systemsPersistent systems
Persistent systems
 
Cesc
Cesc Cesc
Cesc
 
Elecon
EleconElecon
Elecon
 
Elecon
EleconElecon
Elecon
 
Cipla
Cipla Cipla
Cipla
 
Ivrcl
Ivrcl Ivrcl
Ivrcl
 
Rallis
RallisRallis
Rallis
 

More from Angel Broking

Market outlook 110612
Market outlook 110612Market outlook 110612
Market outlook 110612Angel Broking
 
Axis%20 bank ru1qfy2012-220711
Axis%20 bank ru1qfy2012-220711Axis%20 bank ru1qfy2012-220711
Axis%20 bank ru1qfy2012-220711Angel Broking
 
Electrosteel castings
Electrosteel castingsElectrosteel castings
Electrosteel castingsAngel Broking
 
Derivative report 19th July 2011
Derivative report 19th July 2011Derivative report 19th July 2011
Derivative report 19th July 2011Angel Broking
 
Market outlook 19th July 2011
Market outlook 19th July 2011Market outlook 19th July 2011
Market outlook 19th July 2011Angel Broking
 
Weekly Report 18th July 2011
Weekly Report 18th July 2011Weekly Report 18th July 2011
Weekly Report 18th July 2011Angel Broking
 
Derivative Report 18th July 2011
Derivative Report 18th July 2011Derivative Report 18th July 2011
Derivative Report 18th July 2011Angel Broking
 
Technical Report 18th July 2011
Technical Report 18th July 2011Technical Report 18th July 2011
Technical Report 18th July 2011Angel Broking
 
Market Outlook 18th July 2011
Market Outlook 18th July 2011Market Outlook 18th July 2011
Market Outlook 18th July 2011Angel Broking
 
Bajaj auto Result Updated
Bajaj auto Result UpdatedBajaj auto Result Updated
Bajaj auto Result UpdatedAngel Broking
 
Tata consultancy services
Tata consultancy services Tata consultancy services
Tata consultancy services Angel Broking
 
Derivatives Report 15th July 2011
Derivatives Report 15th July 2011Derivatives Report 15th July 2011
Derivatives Report 15th July 2011Angel Broking
 
Technical Report 15th July 2011
Technical Report 15th July 2011Technical Report 15th July 2011
Technical Report 15th July 2011Angel Broking
 
Infosys Result Updated
Infosys Result UpdatedInfosys Result Updated
Infosys Result UpdatedAngel Broking
 
Derivative Report 13th July 2011
Derivative Report 13th July 2011Derivative Report 13th July 2011
Derivative Report 13th July 2011Angel Broking
 
Technical Report 13th July 2011
Technical Report 13th July 2011Technical Report 13th July 2011
Technical Report 13th July 2011Angel Broking
 

More from Angel Broking (20)

Market outlook 110612
Market outlook 110612Market outlook 110612
Market outlook 110612
 
Axis%20 bank ru1qfy2012-220711
Axis%20 bank ru1qfy2012-220711Axis%20 bank ru1qfy2012-220711
Axis%20 bank ru1qfy2012-220711
 
Electrosteel castings
Electrosteel castingsElectrosteel castings
Electrosteel castings
 
Ht media
Ht mediaHt media
Ht media
 
Derivative report 19th July 2011
Derivative report 19th July 2011Derivative report 19th July 2011
Derivative report 19th July 2011
 
Market outlook 19th July 2011
Market outlook 19th July 2011Market outlook 19th July 2011
Market outlook 19th July 2011
 
Telecom sector
Telecom sectorTelecom sector
Telecom sector
 
Weekly Report 18th July 2011
Weekly Report 18th July 2011Weekly Report 18th July 2011
Weekly Report 18th July 2011
 
Derivative Report 18th July 2011
Derivative Report 18th July 2011Derivative Report 18th July 2011
Derivative Report 18th July 2011
 
Technical Report 18th July 2011
Technical Report 18th July 2011Technical Report 18th July 2011
Technical Report 18th July 2011
 
Market Outlook 18th July 2011
Market Outlook 18th July 2011Market Outlook 18th July 2011
Market Outlook 18th July 2011
 
South Indian Bank
 South Indian Bank South Indian Bank
South Indian Bank
 
Bajaj auto Result Updated
Bajaj auto Result UpdatedBajaj auto Result Updated
Bajaj auto Result Updated
 
Tata consultancy services
Tata consultancy services Tata consultancy services
Tata consultancy services
 
Fc4 e63c4d01
Fc4 e63c4d01Fc4 e63c4d01
Fc4 e63c4d01
 
Derivatives Report 15th July 2011
Derivatives Report 15th July 2011Derivatives Report 15th July 2011
Derivatives Report 15th July 2011
 
Technical Report 15th July 2011
Technical Report 15th July 2011Technical Report 15th July 2011
Technical Report 15th July 2011
 
Infosys Result Updated
Infosys Result UpdatedInfosys Result Updated
Infosys Result Updated
 
Derivative Report 13th July 2011
Derivative Report 13th July 2011Derivative Report 13th July 2011
Derivative Report 13th July 2011
 
Technical Report 13th July 2011
Technical Report 13th July 2011Technical Report 13th July 2011
Technical Report 13th July 2011
 

Recently uploaded

一比一原版Birmingham毕业证伯明翰大学|学院毕业证成绩单如何办理
一比一原版Birmingham毕业证伯明翰大学|学院毕业证成绩单如何办理一比一原版Birmingham毕业证伯明翰大学|学院毕业证成绩单如何办理
一比一原版Birmingham毕业证伯明翰大学|学院毕业证成绩单如何办理
betoozp
 
Scope Of Macroeconomics introduction and basic theories
Scope Of Macroeconomics introduction and basic theoriesScope Of Macroeconomics introduction and basic theories
Scope Of Macroeconomics introduction and basic theories
nomankalyar153
 
how to sell pi coins in South Korea profitably.
how to sell pi coins in South Korea profitably.how to sell pi coins in South Korea profitably.
how to sell pi coins in South Korea profitably.
DOT TECH
 
Isios-2024-Professional-Independent-Trustee-Survey.pdf
Isios-2024-Professional-Independent-Trustee-Survey.pdfIsios-2024-Professional-Independent-Trustee-Survey.pdf
Isios-2024-Professional-Independent-Trustee-Survey.pdf
Henry Tapper
 
how to sell pi coins effectively (from 50 - 100k pi)
how to sell pi coins effectively (from 50 - 100k  pi)how to sell pi coins effectively (from 50 - 100k  pi)
how to sell pi coins effectively (from 50 - 100k pi)
DOT TECH
 
Webinar Exploring DORA for Fintechs - Simont Braun
Webinar Exploring DORA for Fintechs - Simont BraunWebinar Exploring DORA for Fintechs - Simont Braun
Webinar Exploring DORA for Fintechs - Simont Braun
FinTech Belgium
 
NO1 Uk Black Magic Specialist Expert In Sahiwal, Okara, Hafizabad, Mandi Bah...
NO1 Uk Black Magic Specialist Expert In Sahiwal, Okara, Hafizabad,  Mandi Bah...NO1 Uk Black Magic Specialist Expert In Sahiwal, Okara, Hafizabad,  Mandi Bah...
NO1 Uk Black Magic Specialist Expert In Sahiwal, Okara, Hafizabad, Mandi Bah...
Amil Baba Dawood bangali
 
一比一原版BCU毕业证伯明翰城市大学毕业证成绩单如何办理
一比一原版BCU毕业证伯明翰城市大学毕业证成绩单如何办理一比一原版BCU毕业证伯明翰城市大学毕业证成绩单如何办理
一比一原版BCU毕业证伯明翰城市大学毕业证成绩单如何办理
ydubwyt
 
Intro_Economics_ GPresentation Week 4.pptx
Intro_Economics_ GPresentation Week 4.pptxIntro_Economics_ GPresentation Week 4.pptx
Intro_Economics_ GPresentation Week 4.pptx
shetivia
 
PF-Wagner's Theory of Public Expenditure.pptx
PF-Wagner's Theory of Public Expenditure.pptxPF-Wagner's Theory of Public Expenditure.pptx
PF-Wagner's Theory of Public Expenditure.pptx
GunjanSharma28848
 
Proposer Builder Separation Problem in Ethereum
Proposer Builder Separation Problem in EthereumProposer Builder Separation Problem in Ethereum
Proposer Builder Separation Problem in Ethereum
RasoulRamezanian1
 
Which Crypto to Buy Today for Short-Term in May-June 2024.pdf
Which Crypto to Buy Today for Short-Term in May-June 2024.pdfWhich Crypto to Buy Today for Short-Term in May-June 2024.pdf
Which Crypto to Buy Today for Short-Term in May-June 2024.pdf
Kezex (KZX)
 
Empowering the Unbanked: The Vital Role of NBFCs in Promoting Financial Inclu...
Empowering the Unbanked: The Vital Role of NBFCs in Promoting Financial Inclu...Empowering the Unbanked: The Vital Role of NBFCs in Promoting Financial Inclu...
Empowering the Unbanked: The Vital Role of NBFCs in Promoting Financial Inclu...
Vighnesh Shashtri
 
Introduction to Indian Financial System ()
Introduction to Indian Financial System ()Introduction to Indian Financial System ()
Introduction to Indian Financial System ()
Avanish Goel
 
how to sell pi coins on Binance exchange
how to sell pi coins on Binance exchangehow to sell pi coins on Binance exchange
how to sell pi coins on Binance exchange
DOT TECH
 
how to sell pi coins on Bitmart crypto exchange
how to sell pi coins on Bitmart crypto exchangehow to sell pi coins on Bitmart crypto exchange
how to sell pi coins on Bitmart crypto exchange
DOT TECH
 
MERCHANTBANKING-PDF complete picture.pdf
MERCHANTBANKING-PDF complete picture.pdfMERCHANTBANKING-PDF complete picture.pdf
MERCHANTBANKING-PDF complete picture.pdf
Sudarshan Dakuru
 
how can I sell my pi coins for cash in a pi APP
how can I sell my pi coins for cash in a pi APPhow can I sell my pi coins for cash in a pi APP
how can I sell my pi coins for cash in a pi APP
DOT TECH
 
Chương 6. Ancol - phenol - ether (1).pdf
Chương 6. Ancol - phenol - ether (1).pdfChương 6. Ancol - phenol - ether (1).pdf
Chương 6. Ancol - phenol - ether (1).pdf
va2132004
 
how to sell pi coins at high rate quickly.
how to sell pi coins at high rate quickly.how to sell pi coins at high rate quickly.
how to sell pi coins at high rate quickly.
DOT TECH
 

Recently uploaded (20)

一比一原版Birmingham毕业证伯明翰大学|学院毕业证成绩单如何办理
一比一原版Birmingham毕业证伯明翰大学|学院毕业证成绩单如何办理一比一原版Birmingham毕业证伯明翰大学|学院毕业证成绩单如何办理
一比一原版Birmingham毕业证伯明翰大学|学院毕业证成绩单如何办理
 
Scope Of Macroeconomics introduction and basic theories
Scope Of Macroeconomics introduction and basic theoriesScope Of Macroeconomics introduction and basic theories
Scope Of Macroeconomics introduction and basic theories
 
how to sell pi coins in South Korea profitably.
how to sell pi coins in South Korea profitably.how to sell pi coins in South Korea profitably.
how to sell pi coins in South Korea profitably.
 
Isios-2024-Professional-Independent-Trustee-Survey.pdf
Isios-2024-Professional-Independent-Trustee-Survey.pdfIsios-2024-Professional-Independent-Trustee-Survey.pdf
Isios-2024-Professional-Independent-Trustee-Survey.pdf
 
how to sell pi coins effectively (from 50 - 100k pi)
how to sell pi coins effectively (from 50 - 100k  pi)how to sell pi coins effectively (from 50 - 100k  pi)
how to sell pi coins effectively (from 50 - 100k pi)
 
Webinar Exploring DORA for Fintechs - Simont Braun
Webinar Exploring DORA for Fintechs - Simont BraunWebinar Exploring DORA for Fintechs - Simont Braun
Webinar Exploring DORA for Fintechs - Simont Braun
 
NO1 Uk Black Magic Specialist Expert In Sahiwal, Okara, Hafizabad, Mandi Bah...
NO1 Uk Black Magic Specialist Expert In Sahiwal, Okara, Hafizabad,  Mandi Bah...NO1 Uk Black Magic Specialist Expert In Sahiwal, Okara, Hafizabad,  Mandi Bah...
NO1 Uk Black Magic Specialist Expert In Sahiwal, Okara, Hafizabad, Mandi Bah...
 
一比一原版BCU毕业证伯明翰城市大学毕业证成绩单如何办理
一比一原版BCU毕业证伯明翰城市大学毕业证成绩单如何办理一比一原版BCU毕业证伯明翰城市大学毕业证成绩单如何办理
一比一原版BCU毕业证伯明翰城市大学毕业证成绩单如何办理
 
Intro_Economics_ GPresentation Week 4.pptx
Intro_Economics_ GPresentation Week 4.pptxIntro_Economics_ GPresentation Week 4.pptx
Intro_Economics_ GPresentation Week 4.pptx
 
PF-Wagner's Theory of Public Expenditure.pptx
PF-Wagner's Theory of Public Expenditure.pptxPF-Wagner's Theory of Public Expenditure.pptx
PF-Wagner's Theory of Public Expenditure.pptx
 
Proposer Builder Separation Problem in Ethereum
Proposer Builder Separation Problem in EthereumProposer Builder Separation Problem in Ethereum
Proposer Builder Separation Problem in Ethereum
 
Which Crypto to Buy Today for Short-Term in May-June 2024.pdf
Which Crypto to Buy Today for Short-Term in May-June 2024.pdfWhich Crypto to Buy Today for Short-Term in May-June 2024.pdf
Which Crypto to Buy Today for Short-Term in May-June 2024.pdf
 
Empowering the Unbanked: The Vital Role of NBFCs in Promoting Financial Inclu...
Empowering the Unbanked: The Vital Role of NBFCs in Promoting Financial Inclu...Empowering the Unbanked: The Vital Role of NBFCs in Promoting Financial Inclu...
Empowering the Unbanked: The Vital Role of NBFCs in Promoting Financial Inclu...
 
Introduction to Indian Financial System ()
Introduction to Indian Financial System ()Introduction to Indian Financial System ()
Introduction to Indian Financial System ()
 
how to sell pi coins on Binance exchange
how to sell pi coins on Binance exchangehow to sell pi coins on Binance exchange
how to sell pi coins on Binance exchange
 
how to sell pi coins on Bitmart crypto exchange
how to sell pi coins on Bitmart crypto exchangehow to sell pi coins on Bitmart crypto exchange
how to sell pi coins on Bitmart crypto exchange
 
MERCHANTBANKING-PDF complete picture.pdf
MERCHANTBANKING-PDF complete picture.pdfMERCHANTBANKING-PDF complete picture.pdf
MERCHANTBANKING-PDF complete picture.pdf
 
how can I sell my pi coins for cash in a pi APP
how can I sell my pi coins for cash in a pi APPhow can I sell my pi coins for cash in a pi APP
how can I sell my pi coins for cash in a pi APP
 
Chương 6. Ancol - phenol - ether (1).pdf
Chương 6. Ancol - phenol - ether (1).pdfChương 6. Ancol - phenol - ether (1).pdf
Chương 6. Ancol - phenol - ether (1).pdf
 
how to sell pi coins at high rate quickly.
how to sell pi coins at high rate quickly.how to sell pi coins at high rate quickly.
how to sell pi coins at high rate quickly.
 

CCCl

  • 1. 1QFY2011 Result Update | Infrastructure July 28, 2010 Consolidated Construction Consortium ACCUMULATE CMP Rs83 Performance Highlights Target Price Rs89   Y/E March (Rs cr) 1QFY11 1QFY10 % chg (yoy) 4QFY10 % chg (qoq) Investment Period 12 Months Net Sales 508.0 411.6 23.4 636.3 (20.2) Stock Info Operating Profit 42.0 30.2 39.1 66.9 (37.2) Sector Infrastructure Market Cap (Rs cr) 1,542 Net Profit 18.8 17.7 6.4 33.6 (44.1) Beta 0.64 Source: Company, Angel Research 52 Week High / Low 98/46.1   Consolidated construction consortium (CCCL) reported in-line net sales for Avg. Daily Volume 23,223 1QFY2011 led primarily by decent order inflow during the last few quarters. The Face Value (Rs) 2 operating margins and earnings were also in line with our expectations. Order BSE Sensex 17,992 inflow stood at Rs1,706cr during 1QFY2011, a yoy jump of ~152%, which we Nifty 5,409 believe is indication of revival in the commercial and infrastructure segments. Reuters Code CCON.BO CCCL’s order book at 2.3x FY2010 revenues, gives revenue visibility for the next Bloomberg Code CCCL@IN couple of years. In light of the improving order inflow scenario, earnings CAGR of ~20% over FY2010-12E and decent return ratios, we maintain an Accumulate on the stock. Shareholding Pattern (%) Promoters 50.6 In-line results: CCCL reported decent top-line growth of 23.4% to Rs508cr in line MF / Banks / Indian Fls 10.9 with our expectations of Rs491cr. OPM’s came in at 8.3% (7.3%), up by 100bp in FII / NRIs / OCBs 17.9 line with our expectation of 8.5%, aided by a low base. However, bottom-line Indian Public / Others 20.6 registered mere 6.4% yoy growth to Rs18.8cr (Rs17.7cr) mainly on account of the expected higher interest cost, in line with our expectation of Rs18.9cr. Abs. (%) 3m 1yr 3yr Outlook and Valuation: We believe the key triggers to watch out for CCCL should Sensex 2.2 17.6 (5.6) be order inflow and better-than-expected ramp up in execution. Management is CCCL (5.8) 61.3 (47.4) confident about strong order inflow in FY2011 and targets to achieve around Rs4,000cr as against Rs2,166cr in FY2010. We value CCCL at ~15% discount to its larger peers like NCC, IVRCL, HCC, etc., given its scale of operations. Hence, we assign a P/E of 12x its FY2012E earnings and have arrived at a Target Price of Rs89. We maintain an Accumulate on the stock. Key Financials (Consolidated) Y/E March (Rs cr) FY2009 FY2010 FY2011E FY2012E Net Sales (incl op. income) 1,840.9 1,975.9 2,461.3 2,891.0 % chg 24.6 7.3 24.6 17.5 Adj. Net Profit 72.4 91.6 109.0 137.7 % chg (18.9) 26.6 19.0 26.3 FDEPS (Rs) 3.9 5.0 5.9 7.5 EBITDA Margin (%) 7.0 9.1 8.9 9.5 P/E (x) 21.1 16.7 14.0 11.1 Shailesh Kanani RoAE (%) 14.9 16.6 17.1 18.4 022-40403800 Ext: 321 RoACE (%) 17.5 19.3 19.5 21.2 shailesh.kanani@angeltrade.com P/BV (x) 3.0 2.6 2.2 1.9 Aniruddha Mate EV/Sales (x) 0.9 0.9 0.7 0.6 022-40403800 Ext: 335 EV/EBITDA (x) 12.4 9.5 7.8 6.4 aniruddha.mate@angeltrade.com Please refer to important disclosures at the end of this report 1
  • 2. CCCL|1QFY2011 Result Update Exhibit 1: 1QFY2011 Performance (Standalone) Y/E March (Rs cr) 1QFY11 1QFY10 4QFY10 % chg (yoy) % chg (qoq) FY2010 FY2009 % chg Net Sales 508.0 411.6 636.3 23.4 (20.2) 1975.9 1840.9 7.3 Total Expenditure 466.0 381.4 569.4 22.2 (18.2) 1796.7 1712.4 4.9 Operating Profit 42.0 30.2 66.9 39.1 (37.2) 179.2 128.5 39.5 OPM (%) 8.3 7.3 10.5 100bp (220)bp 9.1 7.0 190bp Interest 10.5 3.6 14.6 190.6 (27.6) 32.6 18.4 77.2 Depreciation 2.9 2.2 2.9 33.3 (1.4) 11.0 9.0 23.3 Non Operating Income 1.4 2.3 2.4 (40.3) (42.2) 6.4 9.4 (32.0) Nonrecurring items 0.9 0.0 0.0 - - 0.0 0.0 - Profit Before tax 29.1 26.7 51.8 8.7 (43.9) 142.0 110.5 28.5 Tax 10.3 9.1 18.2 13.0 (43.5) 50.4 38.2 32.0 Reported Net Profit 18.8 17.7 33.6 6.4 (44.1) 91.6 72.4 26.6 PAT (%) 3.7 4.3 5.3 (60)bp (160)bp 4.6 3.9 70bp Reported EPS 1.0 4.8 2.1 (78.7) (51.7) 5.0 3.9 26.6 Source: Company, Angel Research; Exhibit 2: 1QFY2011 Actual v/s Estimates Estimates Actual Variation (%) Net Sales 491.0 508.0 3.5 OPM (%) 8.5 8.3 (19.0)bp PAT 18.9 18.8 (0.5) Source: Company, Angel Research Top-line in line with estimates… CCCL reported decent top-line growth of 23.4% to Rs508cr, in line with our expectation of Rs491cr primarily led by decent order inflow during the last few quarters. Going ahead too, we expect the company to post decent performance on the top-line front. We are penciling in 21% CAGR over FY2010-12E on strong order book and pick up in the commercial and infrastructure segments. Order booking during the quarter was also good at Rs1,706cr, which was primarily due to the large Rs1,218cr order bagged during the quarter. Order inflow represents 79% of the total orders bagged in FY2010. The average execution period for the order book is 18 months. Exhibit 3: Quarterly revenue trend Exhibit 4: Quarterly order booking trend 700 40.0 2,000 200.0 600 33.2 This yoy jump is 151.5 30.2 30.0 indicative of revival in 150.0 500 23.4 1,500 400 21.9 20.0 order inflow 100.0 300 10.0 32.3 8.5 1,000 39.8 50.0 200 2.7 4.5 100 - (3.4) - 0 (10.0) 500 (71.3) 9.5 (50.0) 2QFY09 3QFY09 4QFY09 1QFY10 2QFY10 3QFY10 4QFY10 1QFY11 - (100.0) 1QFY10 2QFY10 3QFY10 4QFY10 1QFY11 Sales (Rs cr, LHS) Growth (yoy %, RHS) Order Booking (Rs cr, LHS) Growth (yoy %, RHS) Source: Company, Angel Research Source: Company, Angel Research July 28, 2010 2
  • 3. CCCL|1QFY2011 Result Update …so were the margins and bottom-line: The OPM’s reported by CCCL for 1QFY2011 came in at 8.3% (7.3%), an increase of 100bp and in line with our expectation 8.5%, aided by a low base. However, bottom-line registered mere 6.4% growth to Rs18.8cr (Rs17.7cr) mainly on account of expected higher interest cost, in line with our expectation of Rs18.9cr. Exhibit 5: Quarterly EBITDA trend Exhibit 6: Quarterly bottom-line trend 80.0 12.0 40.0 5.3 6.0 70.0 10.5 35.0 4.7 10.0 4.3 5.0 60.0 8.9 9.0 30.0 4.1 8.0 25.0 4.3 4.7 4.0 50.0 7.1 7.3 8.3 40.0 6.8 6.0 20.0 3.7 3.0 5.4 15.0 3.0 30.0 4.0 2.0 20.0 10.0 2.0 5.0 1.0 10.0 - - - - 2QFY09 3QFY09 4QFY09 1QFY10 2QFY10 3QFY10 4QFY10 1QFY11 2QFY09 3QFY09 4QFY09 1QFY10 2QFY10 3QFY10 4QFY10 1QFY11 EBITDA (Rs cr, LHS) EBITDAM (%, RHS) PAT (Rs cr, LHS) PATM (%, RHS) Source: Company, Angel Research Source: Company, Angel Research Order Book Analysis CCCL’s order book, as on 1QFY2011, stood at Rs4,527cr (2.3x FY2010 revenues), up 33.6% yoy and dominated by the infrastructure (52.7%) and commercial (34.6) segments. The balance is contributed by the industrial and residential segments. The order book is spread across price protected (~60%), fixed price (~20%) and without material (20%) contracts. Exhibit 7: 1QFY2011 Order booking-Sector-wise (Rs cr) Exhibit 8: 1QFY2011 Order backlog-Sector wise (Rs cr) 76  153  420  290  Industrial  Industrial  1,565  Commercial  Commercial  2,389  1,339  Infrastructure  Infrastructure  Residential Source: Company, Angel Research Source: Company, Angel Research July 28, 2010 3
  • 4. CCCL|1QFY2011 Result Update Outlook and Valuation We believe that key trigger to watch out for CCCL should be order inflow and better than expected ramp up in execution. Management is confident about strong order inflow in FY2011 and targets to achieve around Rs4,000cr against Rs2,166cr in FY2010. We have value CCCL at ~15% discount to its larger peers like NCC, IVRCL, HCC, etc., given its scale of operations. Hence, we assign a P/E of 12x its FY2012E earnings and have arrived at a Target Price of Rs90. We maintain an Accumulate on the stock. Exhibit 9: Key Assumptions FY2007 FY2008 FY2009 FY2010 FY2011E FY2012E Order Inflow 2,044 2,138 2,512 2,166 4,000 5,000 Revenues 868 1,477 1,841 1,976 2,461 2,891 Order Backlog (Y/E) 1,769 2,652 3,323 3,392 4,931 7,040 Order Book to Sales ratio (x) 2.0 1.8 1.8 1.7 2.0 2.4 Source: Company, Angel Research Exhibit 10: Angel EPS forecast v/s consensus Angel Forecast Bloomberg Consensus Variation FY2011E 5.9 5.9 0.0 FY2012E 7.5 7.0 (6.1) Source: Company, Angel Research July 28, 2010 4
  • 5. CCCL|1QFY2011 Result Update Investment Argument Pure construction play: CCCL provides turn-key construction services in the infrastructure, industrial, commercial and residential segments of the construction industry. The company has executed and is in the process of executing projects across several states and union territories in India. CCCL, over the years, has built strong credibility in the commercial / hospitality and industrial contracting space. It is reputed for high quality execution within challenging time schedules along with strong management credentials. Further, in the past, CCCL has executed a number of projects and nurtured strong relationships with many clients including IT firms like Infosys and HCL Technology. Around 50% of CCCL's order book constitutes repeat orders from existing clients. We believe that CCCL's strong relationship with the blue chips will help it to continue on growth path going forward. July 28, 2010 5
  • 6. CCCL|1QFY2011 Result Update Exhibit 11: Recommendation Summary Company CMP TP Rating Top-line EPS (Rs) Adj. P/E (x) OB/ (Rs) (Rs) FY10 FY11E FY12E CAGR (%) FY10 FY11E FY12E CAGR (%) FY10 FY11E FY12E Sale (x) CCCL 84 89 Accumulate 1,976 2,444 2,871 20.5 5.0 6.0 7.5 22.5 17.2 14.4 11.5 2.3 Gammon 214 - Neutral 4,489 5,575 6,607 21.3 8.4 10.0 12.1 20.0 13.0 11.0 9.0 2.5 HCC 133 - Neutral 3,629 4,146 4,900 16.2 2.7 3.2 3.8 18.8 21.6 18.4 15.3 4.7 IRB Infra 263 275 Neutral 1,705 2,778 3,580 44.9 11.6 12.3 14.5 11.8 22.2 20.8 17.7 - IVRCL 176 216 Buy 5,492 6,663 8,294 22.9 7.8 9.6 12.0 23.9 16.3 13.3 10.6 4.3 JP Assoc. 121 178 Buy 10,316 13,281 17,843 31.5 4.7 5.2 7.7 28.5 26.0 23.2 15.8 - Punj 130 170 Buy 10,539 11,088 13,407 12.8 (11.1) 8.3 12.2 - - 15.8 10.7 2.8 NCC 178 - Neutral 4,778 5,913 6,758 18.9 7.8 10.0 10.7 17.4 22.8 17.8 16.6 3.6 Sadbhav 1,290 - Neutral 1,257 1,560 1,911 23.3 43.0 57.5 69.5 27.1 20.3 15.2 12.5 5.4 SI. 476 570 Buy 4,555 5,535 6,428 18.8 25.7 31.9 40.7 25.9 18.5 14.9 11.7 2.5 PEL 409 563 Buy 3,081 3,685 4,297 18.1 23.4 31.2 32.9 18.6 13.1 9.8 9.3 3.5 MPL 157 190 Buy 1,308 1,701 2,120 27.3 5.8 6.4 9.8 29.8 9.3 8.4 5.5 3.1 L&T 1,863 - Neutral 37,035 44,047 55,519 22.4 47.5 55.1 68.9 20.4 30.9 26.7 21.3 2.7 Source: Company, Angel Research Exhibit 12: Recommendation Summary - SOTP break up Company Core Const. Real Estate Road BOT Invst. In Subsidiaries Others Total Rs % to TP Rs % to TP Rs % to TP Rs % to TP Rs % to TP Rs CCCL 89 100 - - - - 89 Gammon India 121 54 - - - 104 46 225 HCC 53 41 59 46 16 13 - - - 128 IRB Infra 113 41 3 1 154 56 5 2 - 275 IVRCL 168 78 - - 48 22 - 216 Punj Lloyd 170 100 - - - - 170 NCC 152 82 18 10 16 8 - - 186 Simplex In. 570 100 - - - - 570 Patel Engg 460 82 103 18 - - - - 563 Madhucon 98 52 4 2 - - 88 46 - 190 L&T 1,447 79 - - 394 21 - 1,841 Source: Company, Angel Research July 28, 2010 6
  • 7. CCCL|1QFY2011 Result Update Profit & Loss Statement (Consolidated) Y/E March (Rs cr) FY2007 FY2008 FY2009 FY2010 FY2011E FY2012E Net Sales 868 1,477 1,841 1,976 2,461 2,891 Other operating income - - - - - - Total operating income 868 1,477 1,841 1,976 2,461 2,891 % chg 103.6 70.1 24.6 7.3 24.6 17.5 Total Expenditure 794 1,308 1,712 1,797 2,242 2,617 Net Raw Materials 713 959 1,439 1,545 1,702 2,015 Other Mfg costs - 217 47 - 255 264 Personnel 40 71 106 114 137 173 Other 40 61 120 138 148 165 EBITDA 75 169 128 179 219 274 % chg 113.4 126.8 (24.1) 39.5 22.4 24.9 (% of Net Sales) 8.6 11.5 7.0 9.1 8.9 9.5 Dep. & Amortisation 4 6 9 11 15 19 EBIT 71 164 120 168 204 255 % chg 114.6 130.6 (27.0) 40.7 21.4 24.8 (% of Net Sales) 8.2 11.1 6.5 8.5 8.3 8.8 Interest & other Charges 7 12 18 33 45 52 Other Income (pft from Ass/JV) - 8 9 6 6 6 (% of PBT) - 4.9 8.5 4.5 3.3 2.6 Recurring PBT 64 160 111 142 165 209 % chg 120.9 149.5 (31.0) 28.5 16.3 26.3 Extraordinary Expense/(Inc.) - 0 - - - - PBT (reported) 64 160 111 142 165 209 Tax 16 45 38 50 56 71 (% of PBT) 25.7 28.3 34.5 35.5 34.0 34.0 PAT (reported) 48 115 72 92 109 138 Add: Share of earnings of ass. Less: Minority interest (MI) - - - - - - Prior period items - - - - - - PAT after MI (reported) 48 115 72 92 109 138 ADJ. PAT 48 89 72 92 109 138 % chg 147.1 87.2 (18.9) 26.6 19.0 26.3 (% of Net Sales) 5.5 6.0 3.9 4.6 4.4 4.8 Basic EPS (Rs) (Reported) 7.2 6.2 3.9 5.0 5.9 7.5 Fully Diluted EPS (Rs) (Diluted) 2.6 4.8 3.9 5.0 5.9 7.5 % chg 87.2 (18.9) 26.6 19.0 26.3 July 28, 2010 7
  • 8. CCCL|1QFY2011 Result Update Balance Sheet (Consolidated) Y/E March (Rs cr) FY2007 FY2008 FY2009 FY2010 FY2011E FY2012E SOURCES OF FUNDS Equity Share Capital 13.3 37.0 37.0 37.0 37.0 37.0 Preference Capital - - - - - - Reserves& Surplus 174.0 416.8 479.1 552.3 649.4 775.2 Shareholders’ Funds 187.3 453.8 516.1 589.2 686.3 812.2 Minority Interest - - - - - - Total Loans 115.4 125.5 197.6 338.8 365.7 420.6 Deferred Tax Liability 16.6 29.6 44.2 59.5 59.5 59.5 Total Liabilities 319.3 608.8 757.8 987.6 1,111.6 1,292.3 APPLICATION OF FUNDS Gross Block 59.2 94.3 160.6 189.7 259.7 329.7 Less: Acc. Depreciation 8.0 13.4 22.1 33.1 48.2 67.4 Net Block 51.2 80.9 138.4 156.6 211.5 262.3 Capital Work-in-Progress 2.6 2.1 6.4 15.5 15.5 15.5 Investments 0.1 99.1 56.9 9.4 9.4 9.4 Current Assets 504.4 865.2 1,089.4 1,358.4 1,599.4 1,854.0 Inventories 339.2 632.7 807.0 1,020.1 1,215.5 1,427.7 Sundry Debtors 4.5 12.5 8.8 12.0 11.8 13.9 Cash 88.9 87.7 129.9 170.1 179.9 186.7 Loans & Advances 71.9 132.2 143.7 156.2 192.2 225.7 Other - - - - - - Current liabilities 240.6 452.4 545.7 553.8 725.6 850.4 Net Current Assets 263.8 412.8 543.7 804.6 873.7 1,003.6 Mis. Exp. not written off 1.6 14.2 12.4 1.4 1.4 1.4 Total Assets 319.3 609.1 757.8 987.6 1,111.6 1,292.3 July 28, 2010 8
  • 9. CCCL|1QFY2011 Result Update Cash Flow Statement (Consolidated) Y/E March (Rs cr) FY2007 FY2008 FY2009 FY2010 FY2011E FY2012E Profit before tax (excluding MI) 64.2 159.9 110.5 142.0 165.2 208.6 Depreciation 3.6 5.6 9.0 11.0 15.1 19.2 Change in Working Capital 102.0 159.0 88.8 220.6 59.4 123.0 Less: Other income - 7.9 9.4 6.4 5.5 5.5 Direct taxes paid 7.8 32.2 23.6 37.7 56.2 70.9 Cash Flow from Operations (41.9) (33.7) (2.2) (111.7) 59.2 28.4 (Inc.)/ Dec. in Fixed Assets (40.6) (36.7) (70.6) (38.2) (70.0) (70.0) (Inc.)/ Dec. in Investments (0.1) (99.1) 42.2 47.5 - - Other income - 7.9 9.4 6.4 5.5 5.5 Cash Flow from Investing (40.7) (127.9) (18.9) 15.6 (64.5) (64.5) Issue of Equity 1.4 188.7 - - - - Inc./(Dec.) in loans 86.2 10.0 72.1 141.2 26.9 54.9 Dividend Paid (Incl. Tax) 5.2 10.8 9.2 10.8 11.9 11.9 Others (1) (28) 0 6 - - Cash Flow from Financing 81.7 160.4 63.3 136.3 15.0 43.0 Inc./(Dec.) in Cash (0.9) (1.2) 42.2 40.3 9.7 6.8 Opening Cash balances 89.8 88.9 87.7 129.9 170.1 179.9 Closing Cash balances 88.9 87.7 129.9 170.1 179.9 186.7 July 28, 2010 9
  • 10. CCCL|1QFY2011 Result Update Key Ratios Y/E March FY2007 FY2008 FY2009 FY2010 FY2011E FY2012E Valuation Ratio (x) P/E (on FDEPS) 32.0 17.1 21.1 16.7 14.0 11.1 P/CEPS 29.7 16.1 18.8 14.9 12.3 10.1 P/BV 8.1 3.4 3.0 2.6 2.2 1.9 Dividend yield (%) 1.2 0.6 0.6 0.8 0.8 0.8 EV/Sales 1.8 1.1 0.9 0.9 0.7 0.6 EV/EBITDA 20.8 9.2 12.4 9.5 7.8 6.6 EV / Total Assets 4.9 2.6 2.1 1.7 1.5 1.4 Per Share Data (Rs) EPS (Basic) 7.2 6.2 3.9 5.0 5.9 7.5 EPS (fully diluted) 2.6 4.8 3.9 5.0 5.9 7.5 Cash EPS 2.8 5.1 4.4 5.6 6.7 8.5 DPS 1.0 0.5 0.5 0.7 0.7 0.7 Book Value 10.1 24.6 27.9 31.9 37.1 44.0 Dupont Analysis EBIT margin 8.2 11.1 6.5 8.5 8.3 8.8 Tax retention ratio 0.7 0.7 0.7 0.6 0.7 0.7 Asset turnover (x) 3.8 3.9 3.2 2.7 2.8 2.8 ROIC (Post-tax) 22.9 31.3 13.6 15.0 15.4 16.5 Cost of Debt (Post Tax) 4.4 6.9 7.5 7.8 8.4 8.7 Leverage (x) 0.1 0.1 0.1 0.2 0.3 0.3 Operating ROE 25.5 33.7 14.3 16.5 17.4 18.7 Returns (%) ROACE (Pre-tax) 22.2 35.3 17.5 19.3 19.5 21.2 Angel ROIC (Pre-tax) 30.8 43.6 20.8 23.3 23.4 25.0 ROAE 25.5 27.8 14.9 16.6 17.1 18.4 Turnover ratios (x) Asset Turnover (Gross 14.7 19.2 14.4 11.3 11.0 9.8 Block) Inventory / Sales (days) 143 120 143 169 166 167 Receivables (days) 2 2 2 2 2 2 Payables (days) 63 77 93 100 93 98 WC cycle (ex-cash) 73.5 61.8 73.3 96.8 98.5 95.4 (days) Solvency ratios (x) Net debt to equity 0.1 0.1 0.1 0.3 0.3 0.3 Net debt to EBITDA 0.4 0.2 0.5 0.9 0.8 0.9 Interest Coverage (EBIT 10.3 14.2 6.5 5.2 4.6 4.9 / Interest) July 28, 2010 10
  • 11. CCCL|1QFY2011 Result Update Research Team Tel: 022 - 4040 3800 E-mail: research@angeltrade.com Website: www.angeltrade.com DISCLAIMER This document is solely for the personal information of the recipient, and must not be singularly used as the basis of any investment decision. Nothing in this document should be construed as investment or financial advice. Each recipient of this document should make such investigations as they deem necessary to arrive at an independent evaluation of an investment in the securities of the companies referred to in this document (including the merits and risks involved), and should consult their own advisors to determine the merits and risks of such an investment. Angel Broking Limited, its affiliates, directors, its proprietary trading and investment businesses may, from time to time, make investment decisions that are inconsistent with or contradictory to the recommendations expressed herein. The views contained in this document are those of the analyst, and the company may or may not subscribe to all the views expressed within. Reports based on technical and derivative analysis center on studying charts of a stock's price movement, outstanding positions and trading volume, as opposed to focusing on a company's fundamentals and, as such, may not match with a report on a company's fundamentals. The information in this document has been printed on the basis of publicly available information, internal data and other reliable sources believed to be true, but we do not represent that it is accurate or complete and it should not be relied on as such, as this document is for general guidance only. Angel Broking Limited or any of its affiliates/ group companies shall not be in any way responsible for any loss or damage that may arise to any person from any inadvertent error in the information contained in this report. Angel Broking Limited has not independently verified all the information contained within this document. Accordingly, we cannot testify, nor make any representation or warranty, express or implied, to the accuracy, contents or data contained within this document. While Angel Broking Limited endeavours to update on a reasonable basis the information discussed in this material, there may be regulatory, compliance, or other reasons that prevent us from doing so. This document is being supplied to you solely for your information, and its contents, information or data may not be reproduced, redistributed or passed on, directly or indirectly. Angel Broking Limited and its affiliates may seek to provide or have engaged in providing corporate finance, investment banking or other advisory services in a merger or specific transaction to the companies referred to in this report, as on the date of this report or in the past. Neither Angel Broking Limited, nor its directors, employees or affiliates shall be liable for any loss or damage that may arise from or in connection with the use of this information. Note: Please refer to the important `Stock Holding Disclosure' report on the Angel website (Research Section). Also, please refer to the latest update on respective stocks for the disclosure status in respect of those stocks. Angel Broking Limited and its affiliates may have investment positions in the stocks recommended in this report. Disclosure of Interest Statement CCCL 1. Analyst ownership of the stock No 2. Angel and its Group companies ownership of the stock No 3. Angel and its Group companies' Directors ownership of the stock No 4. Broking relationship with company covered No Note: We have not considered any Exposure below Rs 1 lakh for Angel, its Group companies and Directors. Ratings (Returns): Buy (> 15%) Accumulate (5% to 15%) Neutral (-5 to 5%) Reduce (-5% to 15%) Sell (< -15%) July 28, 2010 11