SlideShare a Scribd company logo
1 of 9
Download to read offline
4QFY2010 Result Update I Cement
                                                                                                                             May 6, 2010


  India Cements                                                                          BUY
                                                                                         CMP                                    Rs119
  Performance Highlights                                                                 Target Price                           Rs138

  India Cements (INC) posted an 8.6% yoy growth in the Top-line during                   Investment Period                   12 Months
  4QFY2010 to Rs974cr. The revenue from the cement business stood at
  Rs920cr. The growth in the Top-line was primarily on account of a healthy              Stock Info
  26.5% yoy increase in the sales volume, even as the realisation declined by
                                                                                         Sector                                 Cement
  19.4% yoy to Rs2,488/tonne. On the operating front, the margins of the
  company declined by 941bp yoy to 15.2%, on account of a surge in the raw               Market Cap (Rs cr)                      3,651
  material and freight costs. The Net profit declined by 59.2% yoy to Rs38cr,
  primarily on account of a poor operating performance. We recommend a                   Beta                                       1.0
  Buy on the stock.                                                                      52 WK High / Low                       180/97

  A steep decline in realisations drags the net profit: INC’s 4QFY2010 net sales         Avg. Daily Volume                     481907
  were up by 8.6% to Rs974cr (Rs897cr), in-line with our estimates. The growth           Face Value (Rs)                            10
  in the top-line was on account of a 26.5% yoy growth in cement sales
  volumes to 2.9mn tonnes. However, the realisation was down by 19.4% yoy                BSE Sensex                             16,987
  to Rs2,488/tonne, on account of over capacity in the southern region,                  Nifty                                   5,091
  coupled with poor demand. The OPM was down by 941bp yoy, on account of
  the fall in realisations, and higher raw material and freight costs. The raw           Reuters Code                         ICMN.BO
  material costs were up by 52.1%, while the freight costs increased by 50.7%
                                                                                         Bloomberg Code                       ICEM@IN
  yoy, on account of the increase in the fuel costs and higher dispatches to the
  East and North-East regions. Employee expenses were also up by 30.9% yoy,              Shareholding Pattern (%)
  primarily on account of a provision of Rs13cr made under AS-15. On the
  Bottom-line front, the company reported a net profit of Rs38cr, down 59.2%             Promoters                                25.2
  yoy. The company made a forex translation gain of Rs12cr on outstanding                MF/Banks/Indian FIs                      33.7
  FCCBs during the quarter (as against a forex translation loss of Rs14.9cr
  made during 4QFY2009), which bolstered its bottom-line to an extent.                   FII/NRIs/OCBs                            32.2

                                                                                         Indian Public                              8.9
  Valuation
                                                                                         Abs. (%)          3m          1yr         3yr
  At the CMP of Rs119, India Cements is trading at an EV/EBITDA of 5.7x and
                                                                                         Sensex            6.7      42.1          21.9
  an EV/tonne of US $68/tonne, according to its FY2012E estimates. We have
  arrived at a Target Price of Rs138/share for the stock, by valuing its Cement
                                                                                         INC               6.2      15.2         (35.5)
  business at an average of a Target EV/EBITDA of 5x and Target EV/Tonne of
  US $65. Hence, we recommend a Buy on the stock.

   Key Financials
   Y/E March (Rs cr)                  FY2009       FY2010E        FY2011E    FY2012E
   Net Sales                            3,427          3,771        4,479      5,050
   % chg                                  12.1          10.1         18.8       12.7
   Net Profit                             432            354         310        357
   % chg                                (32.2)         (18.0)       (12.4)      15.1
   OPM (%)                                29.1          21.9         19.4       18.9
   EPS (Rs)                               15.3          11.5         10.1       11.6
   P/E (x)                                 7.8          10.3         11.8       10.2
   P/BV (x)                                1.1           1.0          0.9        0.9   Rupesh Sankhe
   RoE (%)                                14.7           9.0          7.1        7.7   Tel: 022 – 4040 3800 Ext: 319
   RoCE (%)                               14.1           9.6          8.5        8.9   E-mail: rupeshd.sankhe@angeltrade.com
   EV/Sales (x)                            1.5           1.4          1.2        1.1
                                                                                       V Srinivasan
   EV/EBITDA (x)                           5.3           6.6          6.4        5.7
                                                                                       Tel: 022 – 4040 3800 Ext: 330
   Installed Capacity (mtpa)              14.3          14.3         15.8       15.8
                                                                                       E-mail: v.srinivasan@angeltrade.com
  Source: Company, Angel Research

                                                                                                                                         1
Please refer to important disclosures at the end of this report                           Sebi Registration No: INB 010996539
India Cements I 4QFY2010 Result Update


               Exhibit 1: 4QFY2010 Performance
               Y/E March (Rs cr)                            4QFY10     4QFY09         % chg       FY10      FY09    % chg
               Net Sales                                     974.3       897.3          8.6      3,805     3,472      9.6
               Consumption of Raw Material                   154.1       101.3         52.1      479.9     356.5     34.6
               (% of Net Sales)                               15.8           11.3                  12.6     10.3
               Power and Fuel                                261.0       233.9         11.6      999.9     891.6     12.1
               (% of Net Sales)                               26.8           26.1                  26.3     25.7
               Staff Costs                                    80.2           61.3      30.9      250.0     198.3     26.0
               (% of Net Sales)                                8.2            6.8                   6.6      5.7
               Freight & Forwarding                          190.8       126.6         50.7      643.1     486.0     32.3
               (% of Net Sales)                               19.6           14.1                  16.9     14.0
               Other expenses                                140.0       153.3         (8.7)     528.4     578.7     (8.7)
               (% of Net Sales)                               14.4           17.1                  13.9     16.7
               Total Expenditure                             826.1       676.4         22.1      2,901     2,511     15.5
               Operating Profit                              148.2       220.9        (32.9)     904.3     960.8     (5.9)
               OPM (%)                                        15.2           24.6                  23.8     27.7
               Interest                                       36.9           35.0       5.4      142.6     112.2     27.2
               Depreciation                                   61.6           53.3      15.5      233.1     203.3     14.7
               Other Income                                    2.8            2.8                   2.8      3.0     (5.4)
               Profit before Tax                              52.6       135.4        (61.2)     531.3     648.3    (18.0)
               Current Tax                                    14.3           41.5                177.0     216.1    (18.1)
               (% of PBT)                                     27.1           30.7                  33.3     33.3
               Profit after Tax                               38.3           93.8     (59.2)     354.3     432.2    (18.0)
               PAT Margin                                      3.9           10.5                   9.3     12.4
               EPS (Rs)                                        1.2            3.3     (62.5)      11.5      15.3    (24.6)
              Source: Company, Angel Research


                          Operational Highlights

                          The company’s per tonne cement realisation was down by 19.4% yoy during the
                          quarter, and stood at Rs2,488. The decline in realisation was on account of excess
                          capacity and a slowdown in demand in the southern region. The company’s per
                          tonne raw material cost was up by 20.1% yoy, while the freight and forwarding costs
                          were up by 19% yoy. The power and fuel costs were down by 11.9% yoy. The
                          company’s operating profit per tonne stood at Rs435 during the quarter, down
                          53.8% yoy.

                          Exhibit 2: Per tonne analysis (Rs)
                                                                                                          yoy chg      qoq
                                                                4QFY10         3QFY10          4QFY09
                                                                                                              (%)   chg (%)
                            Realisation/tonne                        2,488          2,410       3,087      (19.4)       3.2
                            Raw Material Cost/tonne                   531            488        442.3       20.1        9.0
                            Power & Fuel Cost /tonne                  900            981        1,021      (11.9)      (8.3)
                            Freight & Forwarding Cost/tonne           658            687          553       19.0       (4.2)
                            Operating Profit/tonne                    435            467          943      (53.8)      (6.8)
                            Depreciation/tonne                        212            224        232.8       (8.8)      (5.3)
                            Net Profit/tonne                          132            136        409.8      (67.8)      (2.9)
                          Source: Company, Angel Research
May 6, 2010                                                                                                                  2
India Cements I 4QFY2010 Result Update


              Capacity expansions well on track

              The company is currently setting up a 1.5mtpa green-field plant at Rajasthan,
              through its subsidiary, Indo Zinc Ltd. The plant is at an advanced stage of
              completion and is expected to be commissioned in 2QFY2011. The company is also
              in the process of setting up two captive power plants of 50MW each in Tamil Nadu
              and in Andhra Pradesh. While the Tamil Nadu Plant is expected to be operational in
              1QFY2012, the Andhra Pradesh plant is expected to be operational in 3QFY2012.
              INC has also completed the formalities for obtaining coal mining rights in
              Indonesia, to meet the requirement of coal for power generation and cement
              manufacturing. INC has planned for a total capex of Rs1,300cr over the next three
              years.

              Exhibit 3: Capacity Ramp-up

                       20
                                                                            15.8        15.8
                                                   14.3         14.3
                       15
              (mtpa)


                       10     8.5           9.1


                        5


                        0
                             FY07          FY08    FY09        FY10E       FY11E       FY12E
              Source: Company, Angel Research

              Key Developments

              QIP Issue: India Cements raised US $65mn (Rs295.62cr) via the QIP route, during
              the quarter. The QIP involved an issue of 2,45,94,000 equity shares at a price of
              Rs120.2. The company expects to utilise the money raised for repaying its existing
              debt, for capital expenditure and for general corporate purposes.

              IPL auction: India Cements acquired its Indian Premier League (IPL) franchisee,
              Chennai Super Kings, for US $91mn in 2008, for a 10-year period. During the
              quarter, the governing board of the IPL completed the auction for including two
              more new teams in the league. The two franchisees for Pune and Kochi were
              auctioned for US $370mn and US $333mn, respectively, well above the fixed base
              price of US $250mn.


May 6, 2010                                                                                    3
India Cements I 4QFY2010 Result Update


              Outlook and Valuation

              All the frontline states in the southern region, like Andhra Pradesh, Tamil Nadu and
              Karnataka, had been witnessing low demand in the recent months. The industry had
              also witnessed aggressive inter-regional stock movement, pending the expansions in
              the other regions, which exerted pressure on the prices and profitability. Overall, the
              cement companies have been reporting strong sales volumes, on the back of new
              capacities coming on stream, which has enabled most of the cement manufacturers
              to increase their total cement production. Cement capacity addition in India during
              FY2010 stood at 27mn tonnes, taking the total capacity of the sector to around
              252mtpa at the end of FY2010. Going ahead, we expect the industry to add around
              76mn tonnes of capacity through FY2010-12E.

              All-India demand is expected to remain robust, but accelerated capacity additions
              and the stabilisation of new capacities would exert pressure on prices after May
              2010.

               Exhibit 4: Valuation based on EV/EBITDA multiple and Asset Replacement (FY12E)

               Target EV/EBITDA (x)                 5       Target EV/tonne (US $)             65

               EV (Rs cr)                        4,770      EV (Rs cr)                      5,229
                                                            CPP (100MW)                       400
               Market Cap (Rs cr)                4,089
                                                            Market Cap (Rs cr)              4,390
               No. of shares (cr)                 30.7      No. of shares (cr)               30.7

               Fair Price (Rs)                    133       Fair Price (Rs)                   143
               Source: Company, Angel Research

              At the CMP of Rs119, India Cements is trading at an EV/EBITDA of 5.7x and an
              EV/tonne of US $68/tonne, according to its FY2012E estimates. We have arrived at
              a Target Price of Rs138/share for the stock, by valuing its Cement business at an
              average of a Target EV/EBITDA of 5x and Target EV/Tonne of US $65. We
              recommend a Buy on the stock.


May 6, 2010                                                                                         4
India Cements I 4QFY2010 Result Update


              Exhibit 5: 1-year forward EV/EBITDA band


                           10,200                                                                11x

                              8,200
                                                                                                  8x


              EV (Rs cr)
                              6,200

                              4,200                                                               5x


                              2,200
                                                                                                  2x
                               200
                                 Apr-05        Apr-06    Apr-07      Apr-08      Apr-09     Apr-10


              Source: Company, Angel Research


              Exhibit 6: 1-year forward EV/tonne band

                              12,000


                               9,000
                                                                                                     $110
                 EV (Rs cr)


                                                                                                  $90
                               6,000
                                                                                                     $70

                                                                                                     $50
                               3,000


                                      0
                                      Apr-05    Apr-06    Apr-07      Apr-08     Apr-09      Apr-10


              Source: Company, Angel Research


May 6, 2010                                                                                            5
India Cements I 4QFY2010 Result Update


              Profit & Loss Statement (Standalone)                                                      (Rs cr)
              Y/E March                              FY2007    FY2008   FY2009    FY2010    FY2011E    FY2012E
              Net Sales                               2,255     3,058    3,427     3,771      4,479      5,050
              Other operating income                       -        -         -         -          -          -
              Total operating income                  2,255     3,058    3,427     3,771      4,479      5,050
              % chg                                     46.3     35.6     12.1      10.1       18.8       12.7
              Total Expenditure                       1,521     1,965    2,431     2,945      3,611      4,096
              Net Raw Materials                         238      283       357       480       495         533
              Other Mfg costs                           549      691       892     1,000      1,279      1,442
              Personnel                                 103      188       198       250       275         308
              Other                                     631      804       984     1,215      1,562      1,813
              EBITDA                                    734     1,093      996       827       869         954
              % chg                                   181.4      48.8     (8.8)    (17.0)       5.1         9.8
              (% of Net Sales)                          32.6     35.7     29.1      21.9       19.4       18.9
              Depreciation& Amortisation                103      128       203       233       303         346
              EBIT                                      632      965       793       593       565         608
              % chg                                   246.9      52.8    (17.8)    (25.2)      (4.7)        7.6
              (% of Net Sales)                           28       32        23        16         13         12
              Interest & other Charges                  150      110       112       143       149         143
              Other Income                               10       28        47        81         54         76
              (% of PBT)                                  2        3         7        15         11         14
              Share in profit of Associates                -        -         -         -          -          -
              Recurring PBT                             492      883       728       531       470         541
              % chg                                   1,117       79       (18)      (27)       (12)        15
              Extraordinary Expense/(Inc.)                 -      38        79          -          -          -
              PBT (reported)                            492      845       648       531       470         541
              Tax                                        13      207       216       177       160         184
              (% of PBT)                                 2.7     24.5     33.3      33.3       34.0       34.0
              PAT (reported)                            479      638       432       354       310         357
              ADJ. PAT                                  479      676       512       354       310         357
              % chg                                  1,239.5     41.1    (24.3)    (30.7)     (12.4)      15.1
              (% of Net Sales)                           21       22        15         9          7           7
              Basic EPS (Rs)                           18.4      22.6     15.3      11.5       10.1       11.6
              Fully Diluted EPS (Rs)                   18.4      22.6     15.3      11.5       10.1       11.6
              % chg                                     832       23       (32)      (25)       (12)        15


May 6, 2010                                                                                                       6
India Cements I 4QFY2010 Result Update


                Balance Sheet (Standalone)                                                                (Rs cr)
              Y/E March                          FY2007     FY2008     FY2009     FY2010E     FY2011E     FY2012E
              SOURCES OF FUNDS
              Equity Share Capital                  260        282        282         307         307         307
              Preference Capital                      -          -          -           -           -           -
              Reserves& Surplus                   1,948      3,039      3,349       3,942       4,221       4,442
              Shareholders Funds                  2,209      3,321      3,631       4,249       4,528       4,749
              Total Loans                         2,059      1,812      1,988       1,988       1,988       1,848
              Deferred Tax Liability                 43        226        274         274         274         274
              Total Liabilities                   4,310      5,358      5,893       6,511       6,790       6,871
              APPLICATION OF FUNDS
              Gross Block                         3,856      4,709      5,314       5,614       6,064       6,914
              Less: Acc. Depreciation             1,060      1,244      1,505       1,738       2,042       2,387
              Net Block                           2,796      3,464      3,808       3,875       4,022       4,526
              Capital Work-in-Progress              143        575        904       1,054       1,154         554
              Goodwill                                -          -          -           -           -           -
              Investments                            55        129        159         159         159         159
              Current Assets                      1,718      2,149      2,152       2,370       2,277       2,478
              Cash                                  230        426         93         219          39          73
              Loans & Advances                      979      1,062      1,313       1,313       1,213       1,213
              Other                                 509        662        745         838       1,024       1,191
              Current liabilities                   434        984      1,153         971         845         870
              Net Current Assets                  1,284      1,166        998       1,399       1,431       1,608
              Mis. Exp. not written off              33         24         24          24          24          24
              Total Assets                        4,310      5,358      5,893       6,511       6,790       6,871


              Cash Flow Statement (Standalone)                                                             (Rs cr)
              Y/E March                          FY2007     FY2008     FY2009     FY2010E     FY2011E     FY2012E
              Profit before tax                     492        845        648         531         470          541
              Depreciation                          103        128        203         233         303          346
              Change in Working Capital             125        576          (8)        (99)        (58)      (104)
              Less: Other income                      10         28         47          81          54          76
              Direct taxes paid                       13       207        216         177         160         184
              Cash Flow from Operations             697      1,314         581        408         501          522
              (Inc)/ Decin Fixed Assets            (965)    (1,285)      (934)       (450)       (550)       (250)
              (Inc)/ Dec in Investments              (20)       (74)       (30)           -           -          -
              (Inc)/ Dec in loans and advances
              Other income                           10          28         47         81           54          76
              Cash Flow from Investing             (975)    (1,332)      (917)       (369)       (496)       (174)
              Issue of Equity                        81        601           5        296            -           -
              Inc./(Dec.) in loans                  534       (247)        177           -           -       (140)
              Dividend Paid (Incl. Tax)                -         30         66         66           35          31
              Others                                150         110        112        143          149         143
              Cash Flow from Financing              465         213          4         87        (185)       (315)
              Inc./(Dec.) in Cash                   187        195       (332)        125        (179)          34
              Opening Cash balances                  44         230        426         93          219          39
              Closing Cash balances                 230         426         93        219           39          73


May 6, 2010                                                                                                          7
India Cements I 4QFY2010 Result Update


              Key Ratios
              Y/E March                         FY2007   FY2008   FY2009   FY2010E   FY2011E   FY2012E
              Valuation Ratio (x)
              P/E (on FDEPS)                       6.5      5.3      7.8      10.3      11.8      10.2
              P/CEPS                               5.3      4.4      5.3       6.2       5.9       5.2
              P/BV                                 2.2      1.3      1.1       1.0       0.9       0.9
              Dividend yield (%)                     -      0.9      2.0       1.8       1.0       0.9
              EV/Sales                             2.2      1.5      1.5       1.4       1.2       1.1
              EV/EBITDA                            6.7      4.3      5.3       6.6       6.4       5.7
              EV / Total Assets                    1.1      0.9      0.9       0.8       0.8       0.8
              Per Share Data (Rs)
              EPS (Basic)                         18.4     22.6     15.3      11.5      10.1      11.6
              EPS (fully diluted)                 18.4     22.6     15.3      11.5      10.1      11.6
              Cash EPS                            22.3     27.2     22.5      19.1      20.0      22.9
              DPS                                    -      1.1      2.3       2.2       1.2       1.0
              Book Value                          54.8     92.1    105.0     116.7     125.8     133.0
              Dupont Analysis (%)
              EBIT margin                         28.0     31.6     23.1      15.7      12.6      12.0
              Tax retention ratio                 97.3     75.5     66.7      66.7      66.0      66.0
              Asset turnover (x)                   0.6      0.7      0.6       0.6       0.7       0.7
              ROIC (Post-tax)                     16.7     16.2      9.9       6.6       5.7       5.9
              Cost of Debt (Post Tax)              8.1      4.3      3.9       4.8       5.0       4.9
              Leverage (x)                         0.8      0.6      0.5       0.5       0.4       0.4
              Operating ROE                       23.9     23.6     12.6       7.4       6.1       6.3
              Returns (%)
              ROCE (Pre-tax)                      16.5     20.0     14.1       9.6       8.5       8.9
              Angel ROIC (Pre-tax)                17.6     23.3     17.2      11.7      10.4      10.3
              ROE                                 24.2     24.4     14.7       9.0       7.1       7.7
              Turnover ratios (x)
              Asset Turnover (Gross Block)         0.7      0.7      0.7       0.7       0.8       0.8
              Inventory / Sales (days)            34.1     33.3     37.3      41.3      44.3      46.5
              Receivables (days)                  40.5     34.1     35.4      33.4      29.9      32.1
              Payables (days)                     96.8    131.7    160.4     131.6      91.8      76.4
              Working capital cycle (ex-cash)
                                                 173.9    107.0     87.6     100.9     104.8     105.8
              (days)
              Solvency ratios (x)
              Net debt to equity                   0.8      0.4      0.5       0.4       0.4       0.4
              Net debt to EBITDA                   2.5      1.3      1.9       2.1       2.2       1.9
              Interest Coverage (EBIT /
                                                   4.2      8.8      7.1       4.2       3.8       4.2
              Interest)


May 6, 2010                                                                                         8
India Cements I 4QFY2010 Result Update


Research Team Tel: 022-4040 3800                                          E-mail: research@angeltrade.com                                       Website: www.angeltrade.com


DISCLAIMER

This document is solely for the personal information of the recipient, and must not be singularly used as the basis of any investment decision. Nothing in this
document should be construed as investment or financial advice. Each recipient of this document should make such investigations as they deem necessary to
arrive at an independent evaluation of an investment in the securities of the companies referred to in this document (including the merits and risks involved),
and should consult their own advisors to determine the merits and risks of such an investment.

Angel Securities Limited, its affiliates, directors, its proprietary trading and investment businesses may, from time to time, make investment decisions that are
inconsistent with or contradictory to the recommendations expressed herein. The views contained in this document are those of the analyst, and the company
may or may not subscribe to all the views expressed within.

Reports based on technical and derivative analysis center on studying charts of a stock's price movement, outstanding positions and trading volume, as
opposed to focusing on a company's fundamentals and, as such, may not match with a report on a company's fundamentals.

The information in this document has been printed on the basis of publicly available information, internal data and other reliable sources believed to be true,
and is for general guidance only. Angel Securities Limited has not independently verified all the information contained within this document. Accordingly, we
cannot testify, nor make any representation or warranty, express or implied, to the accuracy, contents or data contained within this document. While Angel
Securities Limited endeavours to update on a reasonable basis the information discussed in this material, there may be regulatory, compliance, or other
reasons that prevent us from doing so.

This document is being supplied to you solely for your information, and its contents, information or data may not be reproduced, redistributed or passed on,
directly or indirectly.

Angel Securities Limited and its affiliates may seek to provide or have engaged in providing corporate finance, investment banking or other advisory services
in a merger or specific transaction to the companies referred to in this report, as on the date of this report or in the past.

Neither Angel Securities Limited, nor its directors, employees or affiliates shall be liable for any loss or damage that may arise from or in connection with the
use of this information.
Note: Please refer to the important `Stock Holding Disclosure' report on the Angel website (Research Section).


 Disclosure of Interest Statement                                                        India Cement
 1.    Analyst ownership of the stock                                                           No
 2.    Angel and its Group companies ownership of the stock                                     No
 3.    Angel and its Group companies’ Directors ownership of the stock                          No
 4.    Broking relationship with company covered                                                No
 Note: We have not considered any Exposure below Rs 1 lakh for Angel and its Group companies.


                                Address: Acme Plaza, ‘A’ Wing, 3rd Floor, M.V. Road, Opp. Sangam Cinema, Andheri (E), Mumbai - 400 059.
                                                                    Tel : (022) 3952 4568 / 4040 3800


    Angel Broking Ltd: BSE Sebi Regn No : INB 010996539 / CDSL Regn No: IN - DP - CDSL - 234 - 2004 / PMS Regn Code: PM/INP000001546 Angel Securities Ltd:BSE: INB010994639/INF010994639 NSE:
    INB230994635/INF230994635 Membership numbers: BSE 028/NSE:09946
    Angel Capital & Debt Market Ltd: INB 231279838 / NSE FNO: INF 231279838 / NSE Member code -12798 Angel Commodities Broking (P) Ltd: MCX Member ID: 12685 / FMC Regn No: MCX / TCM /
    CORP / 0037 NCDEX : Member ID 00220 / FMC Regn No: NCDEX / TCM / CORP / 0302


May 6, 2010                                                                                                                                                                                 9

More Related Content

What's hot

Pantaloon Retail Result Update
Pantaloon Retail Result UpdatePantaloon Retail Result Update
Pantaloon Retail Result Update
Angel Broking
 
Bajaj auto ru4 qfy2010-140510
Bajaj auto ru4 qfy2010-140510Bajaj auto ru4 qfy2010-140510
Bajaj auto ru4 qfy2010-140510
Angel Broking
 
Concor Result Update
Concor Result UpdateConcor Result Update
Concor Result Update
Angel Broking
 
Bharti airtel result update 4 qfy2010
Bharti airtel  result update 4 qfy2010Bharti airtel  result update 4 qfy2010
Bharti airtel result update 4 qfy2010
Angel Broking
 
Shoppers stop result update 4 qfy2010 040510
Shoppers stop result update 4 qfy2010 040510Shoppers stop result update 4 qfy2010 040510
Shoppers stop result update 4 qfy2010 040510
Angel Broking
 
Punj lloyd ru4 qfy2010-310510
Punj lloyd ru4 qfy2010-310510Punj lloyd ru4 qfy2010-310510
Punj lloyd ru4 qfy2010-310510
Angel Broking
 
TV today ru4 qfy2010-250510
TV today ru4 qfy2010-250510TV today ru4 qfy2010-250510
TV today ru4 qfy2010-250510
Angel Broking
 
Maruti suzuki Result Update
Maruti suzuki Result UpdateMaruti suzuki Result Update
Maruti suzuki Result Update
Angel Broking
 
Balaji ru4 qfy2010e-290410
Balaji  ru4 qfy2010e-290410Balaji  ru4 qfy2010e-290410
Balaji ru4 qfy2010e-290410
Angel Broking
 
Concor -Result Update
Concor -Result UpdateConcor -Result Update
Concor -Result Update
Angel Broking
 
Sadbhav engg ru4 qfy2010-240510
Sadbhav engg ru4 qfy2010-240510Sadbhav engg ru4 qfy2010-240510
Sadbhav engg ru4 qfy2010-240510
Angel Broking
 
Bharat forge ru4 qfy2010-210510
Bharat forge ru4 qfy2010-210510Bharat forge ru4 qfy2010-210510
Bharat forge ru4 qfy2010-210510
Angel Broking
 
Ptc ru4 qfy2010-300410
Ptc ru4 qfy2010-300410Ptc ru4 qfy2010-300410
Ptc ru4 qfy2010-300410
Angel Broking
 
R com ru4-qfy2010-180510
R com ru4-qfy2010-180510R com ru4-qfy2010-180510
R com ru4-qfy2010-180510
Angel Broking
 
TCS 4QFY2010 Results Update
TCS 4QFY2010 Results UpdateTCS 4QFY2010 Results Update
TCS 4QFY2010 Results Update
Angel Broking
 
Sail steel ru4 qfy2010-310510
Sail steel ru4 qfy2010-310510Sail steel ru4 qfy2010-310510
Sail steel ru4 qfy2010-310510
Angel Broking
 

What's hot (18)

Pantaloon Retail Result Update
Pantaloon Retail Result UpdatePantaloon Retail Result Update
Pantaloon Retail Result Update
 
Bajaj auto ru4 qfy2010-140510
Bajaj auto ru4 qfy2010-140510Bajaj auto ru4 qfy2010-140510
Bajaj auto ru4 qfy2010-140510
 
Concor Result Update
Concor Result UpdateConcor Result Update
Concor Result Update
 
Bharti airtel result update 4 qfy2010
Bharti airtel  result update 4 qfy2010Bharti airtel  result update 4 qfy2010
Bharti airtel result update 4 qfy2010
 
BRCM
BRCMBRCM
BRCM
 
Shoppers stop result update 4 qfy2010 040510
Shoppers stop result update 4 qfy2010 040510Shoppers stop result update 4 qfy2010 040510
Shoppers stop result update 4 qfy2010 040510
 
Punj lloyd ru4 qfy2010-310510
Punj lloyd ru4 qfy2010-310510Punj lloyd ru4 qfy2010-310510
Punj lloyd ru4 qfy2010-310510
 
TV today ru4 qfy2010-250510
TV today ru4 qfy2010-250510TV today ru4 qfy2010-250510
TV today ru4 qfy2010-250510
 
Maruti suzuki Result Update
Maruti suzuki Result UpdateMaruti suzuki Result Update
Maruti suzuki Result Update
 
Balaji ru4 qfy2010e-290410
Balaji  ru4 qfy2010e-290410Balaji  ru4 qfy2010e-290410
Balaji ru4 qfy2010e-290410
 
Concor -Result Update
Concor -Result UpdateConcor -Result Update
Concor -Result Update
 
Sadbhav engg ru4 qfy2010-240510
Sadbhav engg ru4 qfy2010-240510Sadbhav engg ru4 qfy2010-240510
Sadbhav engg ru4 qfy2010-240510
 
Bharat forge ru4 qfy2010-210510
Bharat forge ru4 qfy2010-210510Bharat forge ru4 qfy2010-210510
Bharat forge ru4 qfy2010-210510
 
Ptc ru4 qfy2010-300410
Ptc ru4 qfy2010-300410Ptc ru4 qfy2010-300410
Ptc ru4 qfy2010-300410
 
R com ru4-qfy2010-180510
R com ru4-qfy2010-180510R com ru4-qfy2010-180510
R com ru4-qfy2010-180510
 
TCS 4QFY2010 Results Update
TCS 4QFY2010 Results UpdateTCS 4QFY2010 Results Update
TCS 4QFY2010 Results Update
 
Sail steel ru4 qfy2010-310510
Sail steel ru4 qfy2010-310510Sail steel ru4 qfy2010-310510
Sail steel ru4 qfy2010-310510
 
Prakash Indutries
Prakash Indutries Prakash Indutries
Prakash Indutries
 

Viewers also liked

Glaxo - Result Update
Glaxo - Result UpdateGlaxo - Result Update
Glaxo - Result Update
Angel Broking
 
Market Outlook - July 13, 2010
Market Outlook - July 13, 2010Market Outlook - July 13, 2010
Market Outlook - July 13, 2010
Angel Broking
 
Gdl result update 4 qfy2010-300410
Gdl  result update 4 qfy2010-300410Gdl  result update 4 qfy2010-300410
Gdl result update 4 qfy2010-300410
Angel Broking
 
Arbl ru2 qfy2011-251010
Arbl ru2 qfy2011-251010Arbl ru2 qfy2011-251010
Arbl ru2 qfy2011-251010
Angel Broking
 
Technical Report - 12 October 2010
Technical Report - 12 October 2010Technical Report - 12 October 2010
Technical Report - 12 October 2010
Angel Broking
 
Market outlook 26 10 10
Market outlook 26 10 10Market outlook 26 10 10
Market outlook 26 10 10
Angel Broking
 
Sib ru2 qfy2011-221010
Sib ru2 qfy2011-221010Sib ru2 qfy2011-221010
Sib ru2 qfy2011-221010
Angel Broking
 
Technical Report - September 21, 2010
Technical Report - September 21, 2010Technical Report - September 21, 2010
Technical Report - September 21, 2010
Angel Broking
 
HDFC Bank - Result Update
HDFC Bank - Result UpdateHDFC Bank - Result Update
HDFC Bank - Result Update
Angel Broking
 
Avents ru3 qcy2010-281010
Avents ru3 qcy2010-281010Avents ru3 qcy2010-281010
Avents ru3 qcy2010-281010
Angel Broking
 
Ambuja ru3 qcy2010-221010
Ambuja ru3 qcy2010-221010Ambuja ru3 qcy2010-221010
Ambuja ru3 qcy2010-221010
Angel Broking
 
Weekly review 08-05-10
Weekly review   08-05-10Weekly review   08-05-10
Weekly review 08-05-10
Angel Broking
 
Derivatives report 26 oct-2010
Derivatives report 26 oct-2010Derivatives report 26 oct-2010
Derivatives report 26 oct-2010
Angel Broking
 
Technical Report - August 2,2010
Technical Report - August 2,2010Technical Report - August 2,2010
Technical Report - August 2,2010
Angel Broking
 
Monnet Ispat and Energy
Monnet Ispat and Energy  Monnet Ispat and Energy
Monnet Ispat and Energy
Angel Broking
 
Ril ru2 qfy2011-301010
Ril   ru2 qfy2011-301010Ril   ru2 qfy2011-301010
Ril ru2 qfy2011-301010
Angel Broking
 

Viewers also liked (20)

NTPC
NTPCNTPC
NTPC
 
Glaxo - Result Update
Glaxo - Result UpdateGlaxo - Result Update
Glaxo - Result Update
 
Ambuja Cement
Ambuja CementAmbuja Cement
Ambuja Cement
 
Market Outlook - July 13, 2010
Market Outlook - July 13, 2010Market Outlook - July 13, 2010
Market Outlook - July 13, 2010
 
Wipro
Wipro  Wipro
Wipro
 
Gdl result update 4 qfy2010-300410
Gdl  result update 4 qfy2010-300410Gdl  result update 4 qfy2010-300410
Gdl result update 4 qfy2010-300410
 
Arbl ru2 qfy2011-251010
Arbl ru2 qfy2011-251010Arbl ru2 qfy2011-251010
Arbl ru2 qfy2011-251010
 
RIL Result Update
RIL Result UpdateRIL Result Update
RIL Result Update
 
Technical Report - 12 October 2010
Technical Report - 12 October 2010Technical Report - 12 October 2010
Technical Report - 12 October 2010
 
Market outlook 26 10 10
Market outlook 26 10 10Market outlook 26 10 10
Market outlook 26 10 10
 
Sib ru2 qfy2011-221010
Sib ru2 qfy2011-221010Sib ru2 qfy2011-221010
Sib ru2 qfy2011-221010
 
Technical Report - September 21, 2010
Technical Report - September 21, 2010Technical Report - September 21, 2010
Technical Report - September 21, 2010
 
HDFC Bank - Result Update
HDFC Bank - Result UpdateHDFC Bank - Result Update
HDFC Bank - Result Update
 
Avents ru3 qcy2010-281010
Avents ru3 qcy2010-281010Avents ru3 qcy2010-281010
Avents ru3 qcy2010-281010
 
Ambuja ru3 qcy2010-221010
Ambuja ru3 qcy2010-221010Ambuja ru3 qcy2010-221010
Ambuja ru3 qcy2010-221010
 
Weekly review 08-05-10
Weekly review   08-05-10Weekly review   08-05-10
Weekly review 08-05-10
 
Derivatives report 26 oct-2010
Derivatives report 26 oct-2010Derivatives report 26 oct-2010
Derivatives report 26 oct-2010
 
Technical Report - August 2,2010
Technical Report - August 2,2010Technical Report - August 2,2010
Technical Report - August 2,2010
 
Monnet Ispat and Energy
Monnet Ispat and Energy  Monnet Ispat and Energy
Monnet Ispat and Energy
 
Ril ru2 qfy2011-301010
Ril   ru2 qfy2011-301010Ril   ru2 qfy2011-301010
Ril ru2 qfy2011-301010
 

Similar to India cements result update 4 qfy2010-060510

Madras cements ru4 qfy2010-250510
Madras cements ru4 qfy2010-250510Madras cements ru4 qfy2010-250510
Madras cements ru4 qfy2010-250510
Angel Broking
 
Madras cements ru4 qfy2010-250510
Madras cements ru4 qfy2010-250510Madras cements ru4 qfy2010-250510
Madras cements ru4 qfy2010-250510
Angel Broking
 
Grasim Result Update 4qfy2010 - 210510
Grasim Result Update 4qfy2010 - 210510Grasim Result Update 4qfy2010 - 210510
Grasim Result Update 4qfy2010 - 210510
Angel Broking
 
Crompton greaves ru4 qfy2010-180510
Crompton greaves ru4 qfy2010-180510Crompton greaves ru4 qfy2010-180510
Crompton greaves ru4 qfy2010-180510
Angel Broking
 
Sintex Result Update 4qfy2010-030510
Sintex Result Update 4qfy2010-030510Sintex Result Update 4qfy2010-030510
Sintex Result Update 4qfy2010-030510
Angel Broking
 
Ashok leyland ru4 qfy2010-300410
Ashok leyland ru4 qfy2010-300410Ashok leyland ru4 qfy2010-300410
Ashok leyland ru4 qfy2010-300410
Angel Broking
 
Ntpc ru4 qfy2010-190510
Ntpc ru4 qfy2010-190510Ntpc ru4 qfy2010-190510
Ntpc ru4 qfy2010-190510
Angel Broking
 
Gammon india ru4 qfy2010-190510
Gammon india ru4 qfy2010-190510Gammon india ru4 qfy2010-190510
Gammon india ru4 qfy2010-190510
Angel Broking
 
Tvs motor ru4 qfy2010-21042010
Tvs motor ru4 qfy2010-21042010Tvs motor ru4 qfy2010-21042010
Tvs motor ru4 qfy2010-21042010
Angel Broking
 
Igl ru4 qfy2010-260510
Igl ru4 qfy2010-260510Igl ru4 qfy2010-260510
Igl ru4 qfy2010-260510
Angel Broking
 
Dishman ru4 qfy2010-310510
Dishman ru4 qfy2010-310510Dishman ru4 qfy2010-310510
Dishman ru4 qfy2010-310510
Angel Broking
 
Hindalco Result Update 4 qfy2010-110510
Hindalco Result Update 4 qfy2010-110510Hindalco Result Update 4 qfy2010-110510
Hindalco Result Update 4 qfy2010-110510
Angel Broking
 
Cinemax ru4 qfy2010-270510
Cinemax ru4 qfy2010-270510Cinemax ru4 qfy2010-270510
Cinemax ru4 qfy2010-270510
Angel Broking
 

Similar to India cements result update 4 qfy2010-060510 (20)

Madras cements ru4 qfy2010-250510
Madras cements ru4 qfy2010-250510Madras cements ru4 qfy2010-250510
Madras cements ru4 qfy2010-250510
 
Madras cements ru4 qfy2010-250510
Madras cements ru4 qfy2010-250510Madras cements ru4 qfy2010-250510
Madras cements ru4 qfy2010-250510
 
Grasim Result Update 4qfy2010 - 210510
Grasim Result Update 4qfy2010 - 210510Grasim Result Update 4qfy2010 - 210510
Grasim Result Update 4qfy2010 - 210510
 
Crompton greaves ru4 qfy2010-180510
Crompton greaves ru4 qfy2010-180510Crompton greaves ru4 qfy2010-180510
Crompton greaves ru4 qfy2010-180510
 
Sintex Result Update 4qfy2010-030510
Sintex Result Update 4qfy2010-030510Sintex Result Update 4qfy2010-030510
Sintex Result Update 4qfy2010-030510
 
Ashok leyland ru4 qfy2010-300410
Ashok leyland ru4 qfy2010-300410Ashok leyland ru4 qfy2010-300410
Ashok leyland ru4 qfy2010-300410
 
Ntpc ru4 qfy2010-190510
Ntpc ru4 qfy2010-190510Ntpc ru4 qfy2010-190510
Ntpc ru4 qfy2010-190510
 
Gammon india ru4 qfy2010-190510
Gammon india ru4 qfy2010-190510Gammon india ru4 qfy2010-190510
Gammon india ru4 qfy2010-190510
 
Exide
Exide Exide
Exide
 
Exide Industries
Exide IndustriesExide Industries
Exide Industries
 
Tvs motor ru4 qfy2010-21042010
Tvs motor ru4 qfy2010-21042010Tvs motor ru4 qfy2010-21042010
Tvs motor ru4 qfy2010-21042010
 
Greenply
Greenply Greenply
Greenply
 
Igl ru4 qfy2010-260510
Igl ru4 qfy2010-260510Igl ru4 qfy2010-260510
Igl ru4 qfy2010-260510
 
Fag y2010-220410
Fag y2010-220410Fag y2010-220410
Fag y2010-220410
 
Dishman ru4 qfy2010-310510
Dishman ru4 qfy2010-310510Dishman ru4 qfy2010-310510
Dishman ru4 qfy2010-310510
 
Hindalco
Hindalco Hindalco
Hindalco
 
Madras Cements
Madras CementsMadras Cements
Madras Cements
 
Hindalco Result Update 4 qfy2010-110510
Hindalco Result Update 4 qfy2010-110510Hindalco Result Update 4 qfy2010-110510
Hindalco Result Update 4 qfy2010-110510
 
Tech Mahindra
Tech Mahindra Tech Mahindra
Tech Mahindra
 
Cinemax ru4 qfy2010-270510
Cinemax ru4 qfy2010-270510Cinemax ru4 qfy2010-270510
Cinemax ru4 qfy2010-270510
 

More from Angel Broking

Market outlook 110612
Market outlook 110612Market outlook 110612
Market outlook 110612
Angel Broking
 
Axis%20 bank ru1qfy2012-220711
Axis%20 bank ru1qfy2012-220711Axis%20 bank ru1qfy2012-220711
Axis%20 bank ru1qfy2012-220711
Angel Broking
 
Electrosteel castings
Electrosteel castingsElectrosteel castings
Electrosteel castings
Angel Broking
 
Derivative report 19th July 2011
Derivative report 19th July 2011Derivative report 19th July 2011
Derivative report 19th July 2011
Angel Broking
 
Market outlook 19th July 2011
Market outlook 19th July 2011Market outlook 19th July 2011
Market outlook 19th July 2011
Angel Broking
 
Weekly Report 18th July 2011
Weekly Report 18th July 2011Weekly Report 18th July 2011
Weekly Report 18th July 2011
Angel Broking
 
Derivative Report 18th July 2011
Derivative Report 18th July 2011Derivative Report 18th July 2011
Derivative Report 18th July 2011
Angel Broking
 
Technical Report 18th July 2011
Technical Report 18th July 2011Technical Report 18th July 2011
Technical Report 18th July 2011
Angel Broking
 
Market Outlook 18th July 2011
Market Outlook 18th July 2011Market Outlook 18th July 2011
Market Outlook 18th July 2011
Angel Broking
 
Bajaj auto Result Updated
Bajaj auto Result UpdatedBajaj auto Result Updated
Bajaj auto Result Updated
Angel Broking
 
Tata consultancy services
Tata consultancy services Tata consultancy services
Tata consultancy services
Angel Broking
 
Derivatives Report 15th July 2011
Derivatives Report 15th July 2011Derivatives Report 15th July 2011
Derivatives Report 15th July 2011
Angel Broking
 
Technical Report 15th July 2011
Technical Report 15th July 2011Technical Report 15th July 2011
Technical Report 15th July 2011
Angel Broking
 
Infosys Result Updated
Infosys Result UpdatedInfosys Result Updated
Infosys Result Updated
Angel Broking
 
Derivative Report 13th July 2011
Derivative Report 13th July 2011Derivative Report 13th July 2011
Derivative Report 13th July 2011
Angel Broking
 

More from Angel Broking (20)

Market outlook 110612
Market outlook 110612Market outlook 110612
Market outlook 110612
 
Axis%20 bank ru1qfy2012-220711
Axis%20 bank ru1qfy2012-220711Axis%20 bank ru1qfy2012-220711
Axis%20 bank ru1qfy2012-220711
 
Electrosteel castings
Electrosteel castingsElectrosteel castings
Electrosteel castings
 
Persistent systems
Persistent systemsPersistent systems
Persistent systems
 
Ht media
Ht mediaHt media
Ht media
 
Derivative report 19th July 2011
Derivative report 19th July 2011Derivative report 19th July 2011
Derivative report 19th July 2011
 
Market outlook 19th July 2011
Market outlook 19th July 2011Market outlook 19th July 2011
Market outlook 19th July 2011
 
Telecom sector
Telecom sectorTelecom sector
Telecom sector
 
Weekly Report 18th July 2011
Weekly Report 18th July 2011Weekly Report 18th July 2011
Weekly Report 18th July 2011
 
Derivative Report 18th July 2011
Derivative Report 18th July 2011Derivative Report 18th July 2011
Derivative Report 18th July 2011
 
Technical Report 18th July 2011
Technical Report 18th July 2011Technical Report 18th July 2011
Technical Report 18th July 2011
 
Market Outlook 18th July 2011
Market Outlook 18th July 2011Market Outlook 18th July 2011
Market Outlook 18th July 2011
 
South Indian Bank
 South Indian Bank South Indian Bank
South Indian Bank
 
Bajaj auto Result Updated
Bajaj auto Result UpdatedBajaj auto Result Updated
Bajaj auto Result Updated
 
Tata consultancy services
Tata consultancy services Tata consultancy services
Tata consultancy services
 
Fc4 e63c4d01
Fc4 e63c4d01Fc4 e63c4d01
Fc4 e63c4d01
 
Derivatives Report 15th July 2011
Derivatives Report 15th July 2011Derivatives Report 15th July 2011
Derivatives Report 15th July 2011
 
Technical Report 15th July 2011
Technical Report 15th July 2011Technical Report 15th July 2011
Technical Report 15th July 2011
 
Infosys Result Updated
Infosys Result UpdatedInfosys Result Updated
Infosys Result Updated
 
Derivative Report 13th July 2011
Derivative Report 13th July 2011Derivative Report 13th July 2011
Derivative Report 13th July 2011
 

India cements result update 4 qfy2010-060510

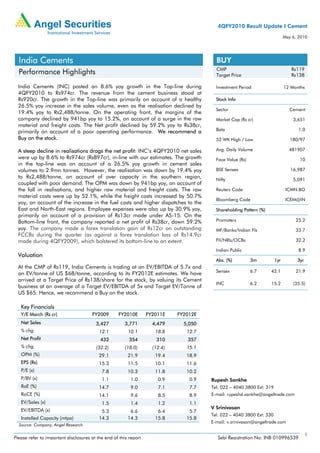
  • 1. 4QFY2010 Result Update I Cement May 6, 2010 India Cements BUY CMP Rs119 Performance Highlights Target Price Rs138 India Cements (INC) posted an 8.6% yoy growth in the Top-line during Investment Period 12 Months 4QFY2010 to Rs974cr. The revenue from the cement business stood at Rs920cr. The growth in the Top-line was primarily on account of a healthy Stock Info 26.5% yoy increase in the sales volume, even as the realisation declined by Sector Cement 19.4% yoy to Rs2,488/tonne. On the operating front, the margins of the company declined by 941bp yoy to 15.2%, on account of a surge in the raw Market Cap (Rs cr) 3,651 material and freight costs. The Net profit declined by 59.2% yoy to Rs38cr, primarily on account of a poor operating performance. We recommend a Beta 1.0 Buy on the stock. 52 WK High / Low 180/97 A steep decline in realisations drags the net profit: INC’s 4QFY2010 net sales Avg. Daily Volume 481907 were up by 8.6% to Rs974cr (Rs897cr), in-line with our estimates. The growth Face Value (Rs) 10 in the top-line was on account of a 26.5% yoy growth in cement sales volumes to 2.9mn tonnes. However, the realisation was down by 19.4% yoy BSE Sensex 16,987 to Rs2,488/tonne, on account of over capacity in the southern region, Nifty 5,091 coupled with poor demand. The OPM was down by 941bp yoy, on account of the fall in realisations, and higher raw material and freight costs. The raw Reuters Code ICMN.BO material costs were up by 52.1%, while the freight costs increased by 50.7% Bloomberg Code ICEM@IN yoy, on account of the increase in the fuel costs and higher dispatches to the East and North-East regions. Employee expenses were also up by 30.9% yoy, Shareholding Pattern (%) primarily on account of a provision of Rs13cr made under AS-15. On the Bottom-line front, the company reported a net profit of Rs38cr, down 59.2% Promoters 25.2 yoy. The company made a forex translation gain of Rs12cr on outstanding MF/Banks/Indian FIs 33.7 FCCBs during the quarter (as against a forex translation loss of Rs14.9cr made during 4QFY2009), which bolstered its bottom-line to an extent. FII/NRIs/OCBs 32.2 Indian Public 8.9 Valuation Abs. (%) 3m 1yr 3yr At the CMP of Rs119, India Cements is trading at an EV/EBITDA of 5.7x and Sensex 6.7 42.1 21.9 an EV/tonne of US $68/tonne, according to its FY2012E estimates. We have arrived at a Target Price of Rs138/share for the stock, by valuing its Cement INC 6.2 15.2 (35.5) business at an average of a Target EV/EBITDA of 5x and Target EV/Tonne of US $65. Hence, we recommend a Buy on the stock. Key Financials Y/E March (Rs cr) FY2009 FY2010E FY2011E FY2012E Net Sales 3,427 3,771 4,479 5,050 % chg 12.1 10.1 18.8 12.7 Net Profit 432 354 310 357 % chg (32.2) (18.0) (12.4) 15.1 OPM (%) 29.1 21.9 19.4 18.9 EPS (Rs) 15.3 11.5 10.1 11.6 P/E (x) 7.8 10.3 11.8 10.2 P/BV (x) 1.1 1.0 0.9 0.9 Rupesh Sankhe RoE (%) 14.7 9.0 7.1 7.7 Tel: 022 – 4040 3800 Ext: 319 RoCE (%) 14.1 9.6 8.5 8.9 E-mail: rupeshd.sankhe@angeltrade.com EV/Sales (x) 1.5 1.4 1.2 1.1 V Srinivasan EV/EBITDA (x) 5.3 6.6 6.4 5.7 Tel: 022 – 4040 3800 Ext: 330 Installed Capacity (mtpa) 14.3 14.3 15.8 15.8 E-mail: v.srinivasan@angeltrade.com Source: Company, Angel Research 1 Please refer to important disclosures at the end of this report Sebi Registration No: INB 010996539
  • 2. India Cements I 4QFY2010 Result Update Exhibit 1: 4QFY2010 Performance Y/E March (Rs cr) 4QFY10 4QFY09 % chg FY10 FY09 % chg Net Sales 974.3 897.3 8.6 3,805 3,472 9.6 Consumption of Raw Material 154.1 101.3 52.1 479.9 356.5 34.6 (% of Net Sales) 15.8 11.3 12.6 10.3 Power and Fuel 261.0 233.9 11.6 999.9 891.6 12.1 (% of Net Sales) 26.8 26.1 26.3 25.7 Staff Costs 80.2 61.3 30.9 250.0 198.3 26.0 (% of Net Sales) 8.2 6.8 6.6 5.7 Freight & Forwarding 190.8 126.6 50.7 643.1 486.0 32.3 (% of Net Sales) 19.6 14.1 16.9 14.0 Other expenses 140.0 153.3 (8.7) 528.4 578.7 (8.7) (% of Net Sales) 14.4 17.1 13.9 16.7 Total Expenditure 826.1 676.4 22.1 2,901 2,511 15.5 Operating Profit 148.2 220.9 (32.9) 904.3 960.8 (5.9) OPM (%) 15.2 24.6 23.8 27.7 Interest 36.9 35.0 5.4 142.6 112.2 27.2 Depreciation 61.6 53.3 15.5 233.1 203.3 14.7 Other Income 2.8 2.8 2.8 3.0 (5.4) Profit before Tax 52.6 135.4 (61.2) 531.3 648.3 (18.0) Current Tax 14.3 41.5 177.0 216.1 (18.1) (% of PBT) 27.1 30.7 33.3 33.3 Profit after Tax 38.3 93.8 (59.2) 354.3 432.2 (18.0) PAT Margin 3.9 10.5 9.3 12.4 EPS (Rs) 1.2 3.3 (62.5) 11.5 15.3 (24.6) Source: Company, Angel Research Operational Highlights The company’s per tonne cement realisation was down by 19.4% yoy during the quarter, and stood at Rs2,488. The decline in realisation was on account of excess capacity and a slowdown in demand in the southern region. The company’s per tonne raw material cost was up by 20.1% yoy, while the freight and forwarding costs were up by 19% yoy. The power and fuel costs were down by 11.9% yoy. The company’s operating profit per tonne stood at Rs435 during the quarter, down 53.8% yoy. Exhibit 2: Per tonne analysis (Rs) yoy chg qoq 4QFY10 3QFY10 4QFY09 (%) chg (%) Realisation/tonne 2,488 2,410 3,087 (19.4) 3.2 Raw Material Cost/tonne 531 488 442.3 20.1 9.0 Power & Fuel Cost /tonne 900 981 1,021 (11.9) (8.3) Freight & Forwarding Cost/tonne 658 687 553 19.0 (4.2) Operating Profit/tonne 435 467 943 (53.8) (6.8) Depreciation/tonne 212 224 232.8 (8.8) (5.3) Net Profit/tonne 132 136 409.8 (67.8) (2.9) Source: Company, Angel Research May 6, 2010 2
  • 3. India Cements I 4QFY2010 Result Update Capacity expansions well on track The company is currently setting up a 1.5mtpa green-field plant at Rajasthan, through its subsidiary, Indo Zinc Ltd. The plant is at an advanced stage of completion and is expected to be commissioned in 2QFY2011. The company is also in the process of setting up two captive power plants of 50MW each in Tamil Nadu and in Andhra Pradesh. While the Tamil Nadu Plant is expected to be operational in 1QFY2012, the Andhra Pradesh plant is expected to be operational in 3QFY2012. INC has also completed the formalities for obtaining coal mining rights in Indonesia, to meet the requirement of coal for power generation and cement manufacturing. INC has planned for a total capex of Rs1,300cr over the next three years. Exhibit 3: Capacity Ramp-up 20 15.8 15.8 14.3 14.3 15 (mtpa) 10 8.5 9.1 5 0 FY07 FY08 FY09 FY10E FY11E FY12E Source: Company, Angel Research Key Developments QIP Issue: India Cements raised US $65mn (Rs295.62cr) via the QIP route, during the quarter. The QIP involved an issue of 2,45,94,000 equity shares at a price of Rs120.2. The company expects to utilise the money raised for repaying its existing debt, for capital expenditure and for general corporate purposes. IPL auction: India Cements acquired its Indian Premier League (IPL) franchisee, Chennai Super Kings, for US $91mn in 2008, for a 10-year period. During the quarter, the governing board of the IPL completed the auction for including two more new teams in the league. The two franchisees for Pune and Kochi were auctioned for US $370mn and US $333mn, respectively, well above the fixed base price of US $250mn. May 6, 2010 3
  • 4. India Cements I 4QFY2010 Result Update Outlook and Valuation All the frontline states in the southern region, like Andhra Pradesh, Tamil Nadu and Karnataka, had been witnessing low demand in the recent months. The industry had also witnessed aggressive inter-regional stock movement, pending the expansions in the other regions, which exerted pressure on the prices and profitability. Overall, the cement companies have been reporting strong sales volumes, on the back of new capacities coming on stream, which has enabled most of the cement manufacturers to increase their total cement production. Cement capacity addition in India during FY2010 stood at 27mn tonnes, taking the total capacity of the sector to around 252mtpa at the end of FY2010. Going ahead, we expect the industry to add around 76mn tonnes of capacity through FY2010-12E. All-India demand is expected to remain robust, but accelerated capacity additions and the stabilisation of new capacities would exert pressure on prices after May 2010. Exhibit 4: Valuation based on EV/EBITDA multiple and Asset Replacement (FY12E) Target EV/EBITDA (x) 5 Target EV/tonne (US $) 65 EV (Rs cr) 4,770 EV (Rs cr) 5,229 CPP (100MW) 400 Market Cap (Rs cr) 4,089 Market Cap (Rs cr) 4,390 No. of shares (cr) 30.7 No. of shares (cr) 30.7 Fair Price (Rs) 133 Fair Price (Rs) 143 Source: Company, Angel Research At the CMP of Rs119, India Cements is trading at an EV/EBITDA of 5.7x and an EV/tonne of US $68/tonne, according to its FY2012E estimates. We have arrived at a Target Price of Rs138/share for the stock, by valuing its Cement business at an average of a Target EV/EBITDA of 5x and Target EV/Tonne of US $65. We recommend a Buy on the stock. May 6, 2010 4
  • 5. India Cements I 4QFY2010 Result Update Exhibit 5: 1-year forward EV/EBITDA band 10,200 11x 8,200 8x EV (Rs cr) 6,200 4,200 5x 2,200 2x 200 Apr-05 Apr-06 Apr-07 Apr-08 Apr-09 Apr-10 Source: Company, Angel Research Exhibit 6: 1-year forward EV/tonne band 12,000 9,000 $110 EV (Rs cr) $90 6,000 $70 $50 3,000 0 Apr-05 Apr-06 Apr-07 Apr-08 Apr-09 Apr-10 Source: Company, Angel Research May 6, 2010 5
  • 6. India Cements I 4QFY2010 Result Update Profit & Loss Statement (Standalone) (Rs cr) Y/E March FY2007 FY2008 FY2009 FY2010 FY2011E FY2012E Net Sales 2,255 3,058 3,427 3,771 4,479 5,050 Other operating income - - - - - - Total operating income 2,255 3,058 3,427 3,771 4,479 5,050 % chg 46.3 35.6 12.1 10.1 18.8 12.7 Total Expenditure 1,521 1,965 2,431 2,945 3,611 4,096 Net Raw Materials 238 283 357 480 495 533 Other Mfg costs 549 691 892 1,000 1,279 1,442 Personnel 103 188 198 250 275 308 Other 631 804 984 1,215 1,562 1,813 EBITDA 734 1,093 996 827 869 954 % chg 181.4 48.8 (8.8) (17.0) 5.1 9.8 (% of Net Sales) 32.6 35.7 29.1 21.9 19.4 18.9 Depreciation& Amortisation 103 128 203 233 303 346 EBIT 632 965 793 593 565 608 % chg 246.9 52.8 (17.8) (25.2) (4.7) 7.6 (% of Net Sales) 28 32 23 16 13 12 Interest & other Charges 150 110 112 143 149 143 Other Income 10 28 47 81 54 76 (% of PBT) 2 3 7 15 11 14 Share in profit of Associates - - - - - - Recurring PBT 492 883 728 531 470 541 % chg 1,117 79 (18) (27) (12) 15 Extraordinary Expense/(Inc.) - 38 79 - - - PBT (reported) 492 845 648 531 470 541 Tax 13 207 216 177 160 184 (% of PBT) 2.7 24.5 33.3 33.3 34.0 34.0 PAT (reported) 479 638 432 354 310 357 ADJ. PAT 479 676 512 354 310 357 % chg 1,239.5 41.1 (24.3) (30.7) (12.4) 15.1 (% of Net Sales) 21 22 15 9 7 7 Basic EPS (Rs) 18.4 22.6 15.3 11.5 10.1 11.6 Fully Diluted EPS (Rs) 18.4 22.6 15.3 11.5 10.1 11.6 % chg 832 23 (32) (25) (12) 15 May 6, 2010 6
  • 7. India Cements I 4QFY2010 Result Update Balance Sheet (Standalone) (Rs cr) Y/E March FY2007 FY2008 FY2009 FY2010E FY2011E FY2012E SOURCES OF FUNDS Equity Share Capital 260 282 282 307 307 307 Preference Capital - - - - - - Reserves& Surplus 1,948 3,039 3,349 3,942 4,221 4,442 Shareholders Funds 2,209 3,321 3,631 4,249 4,528 4,749 Total Loans 2,059 1,812 1,988 1,988 1,988 1,848 Deferred Tax Liability 43 226 274 274 274 274 Total Liabilities 4,310 5,358 5,893 6,511 6,790 6,871 APPLICATION OF FUNDS Gross Block 3,856 4,709 5,314 5,614 6,064 6,914 Less: Acc. Depreciation 1,060 1,244 1,505 1,738 2,042 2,387 Net Block 2,796 3,464 3,808 3,875 4,022 4,526 Capital Work-in-Progress 143 575 904 1,054 1,154 554 Goodwill - - - - - - Investments 55 129 159 159 159 159 Current Assets 1,718 2,149 2,152 2,370 2,277 2,478 Cash 230 426 93 219 39 73 Loans & Advances 979 1,062 1,313 1,313 1,213 1,213 Other 509 662 745 838 1,024 1,191 Current liabilities 434 984 1,153 971 845 870 Net Current Assets 1,284 1,166 998 1,399 1,431 1,608 Mis. Exp. not written off 33 24 24 24 24 24 Total Assets 4,310 5,358 5,893 6,511 6,790 6,871 Cash Flow Statement (Standalone) (Rs cr) Y/E March FY2007 FY2008 FY2009 FY2010E FY2011E FY2012E Profit before tax 492 845 648 531 470 541 Depreciation 103 128 203 233 303 346 Change in Working Capital 125 576 (8) (99) (58) (104) Less: Other income 10 28 47 81 54 76 Direct taxes paid 13 207 216 177 160 184 Cash Flow from Operations 697 1,314 581 408 501 522 (Inc)/ Decin Fixed Assets (965) (1,285) (934) (450) (550) (250) (Inc)/ Dec in Investments (20) (74) (30) - - - (Inc)/ Dec in loans and advances Other income 10 28 47 81 54 76 Cash Flow from Investing (975) (1,332) (917) (369) (496) (174) Issue of Equity 81 601 5 296 - - Inc./(Dec.) in loans 534 (247) 177 - - (140) Dividend Paid (Incl. Tax) - 30 66 66 35 31 Others 150 110 112 143 149 143 Cash Flow from Financing 465 213 4 87 (185) (315) Inc./(Dec.) in Cash 187 195 (332) 125 (179) 34 Opening Cash balances 44 230 426 93 219 39 Closing Cash balances 230 426 93 219 39 73 May 6, 2010 7
  • 8. India Cements I 4QFY2010 Result Update Key Ratios Y/E March FY2007 FY2008 FY2009 FY2010E FY2011E FY2012E Valuation Ratio (x) P/E (on FDEPS) 6.5 5.3 7.8 10.3 11.8 10.2 P/CEPS 5.3 4.4 5.3 6.2 5.9 5.2 P/BV 2.2 1.3 1.1 1.0 0.9 0.9 Dividend yield (%) - 0.9 2.0 1.8 1.0 0.9 EV/Sales 2.2 1.5 1.5 1.4 1.2 1.1 EV/EBITDA 6.7 4.3 5.3 6.6 6.4 5.7 EV / Total Assets 1.1 0.9 0.9 0.8 0.8 0.8 Per Share Data (Rs) EPS (Basic) 18.4 22.6 15.3 11.5 10.1 11.6 EPS (fully diluted) 18.4 22.6 15.3 11.5 10.1 11.6 Cash EPS 22.3 27.2 22.5 19.1 20.0 22.9 DPS - 1.1 2.3 2.2 1.2 1.0 Book Value 54.8 92.1 105.0 116.7 125.8 133.0 Dupont Analysis (%) EBIT margin 28.0 31.6 23.1 15.7 12.6 12.0 Tax retention ratio 97.3 75.5 66.7 66.7 66.0 66.0 Asset turnover (x) 0.6 0.7 0.6 0.6 0.7 0.7 ROIC (Post-tax) 16.7 16.2 9.9 6.6 5.7 5.9 Cost of Debt (Post Tax) 8.1 4.3 3.9 4.8 5.0 4.9 Leverage (x) 0.8 0.6 0.5 0.5 0.4 0.4 Operating ROE 23.9 23.6 12.6 7.4 6.1 6.3 Returns (%) ROCE (Pre-tax) 16.5 20.0 14.1 9.6 8.5 8.9 Angel ROIC (Pre-tax) 17.6 23.3 17.2 11.7 10.4 10.3 ROE 24.2 24.4 14.7 9.0 7.1 7.7 Turnover ratios (x) Asset Turnover (Gross Block) 0.7 0.7 0.7 0.7 0.8 0.8 Inventory / Sales (days) 34.1 33.3 37.3 41.3 44.3 46.5 Receivables (days) 40.5 34.1 35.4 33.4 29.9 32.1 Payables (days) 96.8 131.7 160.4 131.6 91.8 76.4 Working capital cycle (ex-cash) 173.9 107.0 87.6 100.9 104.8 105.8 (days) Solvency ratios (x) Net debt to equity 0.8 0.4 0.5 0.4 0.4 0.4 Net debt to EBITDA 2.5 1.3 1.9 2.1 2.2 1.9 Interest Coverage (EBIT / 4.2 8.8 7.1 4.2 3.8 4.2 Interest) May 6, 2010 8
  • 9. India Cements I 4QFY2010 Result Update Research Team Tel: 022-4040 3800 E-mail: research@angeltrade.com Website: www.angeltrade.com DISCLAIMER This document is solely for the personal information of the recipient, and must not be singularly used as the basis of any investment decision. Nothing in this document should be construed as investment or financial advice. Each recipient of this document should make such investigations as they deem necessary to arrive at an independent evaluation of an investment in the securities of the companies referred to in this document (including the merits and risks involved), and should consult their own advisors to determine the merits and risks of such an investment. Angel Securities Limited, its affiliates, directors, its proprietary trading and investment businesses may, from time to time, make investment decisions that are inconsistent with or contradictory to the recommendations expressed herein. The views contained in this document are those of the analyst, and the company may or may not subscribe to all the views expressed within. Reports based on technical and derivative analysis center on studying charts of a stock's price movement, outstanding positions and trading volume, as opposed to focusing on a company's fundamentals and, as such, may not match with a report on a company's fundamentals. The information in this document has been printed on the basis of publicly available information, internal data and other reliable sources believed to be true, and is for general guidance only. Angel Securities Limited has not independently verified all the information contained within this document. Accordingly, we cannot testify, nor make any representation or warranty, express or implied, to the accuracy, contents or data contained within this document. While Angel Securities Limited endeavours to update on a reasonable basis the information discussed in this material, there may be regulatory, compliance, or other reasons that prevent us from doing so. This document is being supplied to you solely for your information, and its contents, information or data may not be reproduced, redistributed or passed on, directly or indirectly. Angel Securities Limited and its affiliates may seek to provide or have engaged in providing corporate finance, investment banking or other advisory services in a merger or specific transaction to the companies referred to in this report, as on the date of this report or in the past. Neither Angel Securities Limited, nor its directors, employees or affiliates shall be liable for any loss or damage that may arise from or in connection with the use of this information. Note: Please refer to the important `Stock Holding Disclosure' report on the Angel website (Research Section). Disclosure of Interest Statement India Cement 1. Analyst ownership of the stock No 2. Angel and its Group companies ownership of the stock No 3. Angel and its Group companies’ Directors ownership of the stock No 4. Broking relationship with company covered No Note: We have not considered any Exposure below Rs 1 lakh for Angel and its Group companies. Address: Acme Plaza, ‘A’ Wing, 3rd Floor, M.V. Road, Opp. Sangam Cinema, Andheri (E), Mumbai - 400 059. Tel : (022) 3952 4568 / 4040 3800 Angel Broking Ltd: BSE Sebi Regn No : INB 010996539 / CDSL Regn No: IN - DP - CDSL - 234 - 2004 / PMS Regn Code: PM/INP000001546 Angel Securities Ltd:BSE: INB010994639/INF010994639 NSE: INB230994635/INF230994635 Membership numbers: BSE 028/NSE:09946 Angel Capital & Debt Market Ltd: INB 231279838 / NSE FNO: INF 231279838 / NSE Member code -12798 Angel Commodities Broking (P) Ltd: MCX Member ID: 12685 / FMC Regn No: MCX / TCM / CORP / 0037 NCDEX : Member ID 00220 / FMC Regn No: NCDEX / TCM / CORP / 0302 May 6, 2010 9