SlideShare a Scribd company logo
1QFY2011 Result Update | Auto Ancillary
                                                                                                                              July 13 2010


 Exide Industries                                                                             ACCUMULATE
                                                                                              CMP                                   Rs136
 Performance Highlights                                                                       Target Price                          Rs153
                                                                                              Investment Period               12 Months
 Y/E March (Rs cr)         1QFY11     1QFY10       % chg (yoy)    4QFY10    % chg (qoq)
 Net Sales                 1,152.1      903.5            27.5     1,030.3         11.8       Stock Info
 Operating Profit            263.2      209.5            25.7       217.5         21.0
                                                                                             Sector                          Auto Ancillary
 OPM (%)                      22.8       23.2           (33.8)       21.2        168.7
                                                                                             Market Cap (Rs cr)                     11,539
 Reported PAT                165.3      122.4            35.1       134.5         22.9
                                                                                             Beta                                       0.8
 Net sales up 27.5%; net profit up 35.1%: Exide Industries, India’s largest auto             52 Week High / Low                     137/64
 battery manufacturer, reported net profit growth of 35.1% yoy to Rs165.3cr for              Avg. Daily Volume                      430219
 1QFY2011, which came in above our estimate of Rs136cr. Growth came largely
                                                                                             Face Value (Rs)                             1
 on the back of the substantial 27.5% yoy jump in net sales to Rs1,152cr, which
 also exceeded our expectation, and higher other income of Rs6.2cr in                        BSE Sensex                             17,986
 1QFY2011.                                                                                   Nifty                                    5,401
 EBITDA margins better than expectation: During 1QFY2011, Exide witnessed a                  Reuters Code                           EXID.BO
 34bp yoy decline in EBITDA margin owing to the 69bp yoy increase in raw
                                                                                             Bloomberg Code                     EXID@IN
 material costs, which accounted for around 58.6% of sales (58% in 1QFY2010).
 However, on a qoq basis, the company recorded a substantial169bp rise in
 EBITDA margin, largely because of the significant decline in other expenditure.
 During the quarter, average lead prices which fell by 13% qoq to US                         Shareholding Pattern (%)
 $1,924/tonne helped the company to improve margins, while average lead                      Promoters                                46.0
 prices increased 28% yoy (from US $1,509/tonne in 1QFY2010).                                MF / Banks / Indian Fls                  28.8
 Outlook and Valuation: We estimate the company to clock around 14% CAGR in                  FII / NRIs / OCBs                        13.5
 volumes over FY2010-12E on the back of which top-line and bottom-line would
                                                                                             Indian Public / Others                   11.7
 post a CAGR of 19% and 22% respectively, in the mentioned period. We expect
 the prices of its main raw materials to be stable or increase marginally over the
 mentioned period (after the recent run-up in FY2010 and the current higher
 inventory levels at the LME), which will gradually be passed on. We have                    Abs. (%)                  3m     1yr       3yr
 upgraded our EPS estimates to Rs8 (Rs7.2 earlier) and to Rs9.4 (Rs8.9 earlier) for          Sensex                     1      34       18
 FY2011E and FY2012E respectively, owing to the better-than-expected
                                                                                             Exide Industries          14     111      198
 1QFY2011performance. At the CMP, the stock is quoting at 17x FY2011E and
 14.5x FY2012E earnings. We have valued the company’s stake in ING Vysya Life
 Insurance at Rs12/share on the FY2012E new business arrived profit (NBAP). At
 adjusted valuations of 15x FY2012E earnings for its core business, the stock is
 available at reasonable levels. Hence, we maintain an Accumulate on the stock,
 with a Target Price of Rs153.


 Key Financials
  Y/E March (Rs cr)                      FY2009       FY2010      FY2011E      FY2012E
  Net Sales                                3,393        3,794       4,617          5,359
  % chg                                     19.3         11.8        21.7           16.1
  Net Profit                               283.3        537.3       679.1          796.8
  % chg                                     14.2         89.7        26.4           17.3
  OPM (%)                                   16.1         23.5        23.7           23.6
  EPS (Rs)                                   3.6          6.3         8.0            9.4
                                                                                             Vaishali Jajoo
  P/E (x)                                   38.2         21.5        17.0           14.5
                                                                                             022-4040 3800 Ext: 344
  P/BV (x)                                   8.9          5.3         4.2            3.4
                                                                                             vaishali.jajoo@angeltrade.com
  RoE (%)                                   25.0         31.0        27.1           25.4
  RoCE (%)                                  31.7         40.8        37.8           35.4     Yaresh Kothari
  EV/Sales (x)                               3.3          2.9         2.4            2.0     022-4040 3800 Ext: 313
  EV/EBITDA (x)                             20.3         12.3        10.0            8.6     yareshb.kothari@angeltrade.com

 Source: Company, Angel Research

Please refer to important disclosures at the end of this report                                                                          1
Exide Industries | 1QFY2011 Result Update


               Exhibit 1: 1QFY2011 Performance
               Y/E March (Rs cr)          1QFY11        1QFY10    % Chg     FY10      FY09    % Chg
               Net Sales                   1,152.1        903.5    27.5   3,794.0   3,393.0    11.8
               Consumption of RM             675.7        523.7    29.0   2,174.7   2,236.2    (2.7)
               (% of Sales)                      58.6      58.0    68.5     57.3      65.9
               Staff Costs                       67.8      53.7    26.3    218.8     165.2     32.5
               (% of Sales)                       5.9       5.9               5.8       4.9
               Purchases of TG                   10.6       1.9   447.4       6.0     12.2    (50.5)
               (% of Sales)                       0.9       0.2               0.2       0.4
               Other Expenses                134.8        114.7    17.5    502.3     431.5     16.4
               (% of Sales)                      11.7      12.7             13.2      12.7
               Total Expenditure             888.9        694.0    28.1   2,901.9   2,845.1     2.0
               Operating Profit              263.2        209.5    25.7    892.1     548.0     62.8
               OPM (%)                           22.8      23.2             23.5      16.1
               Interest                           1.3       0.4   235.0     13.5      51.6    (73.8)
               Depreciation                      19.4      18.8     3.2     80.7      67.9     18.7
               Other Income                       6.2       0.9   592.1     12.4        6.8    83.6
               PBT (excl. Extr. Items)       248.6        191.1    30.1    810.4     435.2     86.2
               Extr. Income/(Expense)               -         -       -         -         -        -
               PBT (incl. Extr. Items)       248.6        191.1    30.1    810.4     435.2     86.2
               (% of Sales)                      21.6      21.2             21.4      12.8
               Provision for Taxation            83.3      68.7    21.1    273.3     150.8     81.2
               (% of PBT)                        33.5      36.0             33.7      34.7
               Reported PAT                  165.3        122.4    35.1    537.1     284.4     88.9
               PATM                              14.4      13.5             14.2        8.4
               Equity capital (cr)               85.0      80.0     6.3     85.0      80.0      6.3
               EPS (Rs)                           1.9       1.5    27.1       6.3       3.6    77.7

               Source: Company, Angel research


               Net sales up 27.5%; overall volumes up by around 18%: For 1QFY2011, Exide
               Industries clocked 27.5% yoy growth in net sales to Rs1,152cr (Rs904cr), which
               was above our estimate of Rs1,059cr. The company’s OE and replacement sales
               growth, which had started improving since the beginning of FY2010, extended the
               same to 1QFY2011. The improving growth in commercial vehicles (CV) and
               tractor replacement sales (up 14% yoy) and the significant 27% growth in the
               motorcycle battery segment aided the company to report higher growth in the auto
               battery segment during the quarter. This was also supported by the healthy growth
               registered by the industrial battery segment during the quarter. Overall, the
               company recorded around 18% yoy growth in volumes and higher lead price
               passed on to customers helped the company to clock better yoy growth in
               realisations.

               Lower raw material costs pump up margins qoq: During 1QFY2011, Exide
               witnessed a 34bp yoy decline in EBITDA margins owing to the 69bp yoy rise in raw
               material costs, which accounted for around 58.6% of sales (58% in 1QFY2010).
               However, on a qoq basis, the company registered a substantial169bp jump in
               EBITDA margins, largely because of the significant drop in other expenditure.
               During the quarter, average lead prices, which declined by 13% qoq to US
               $1,924/tonne, helped the company to improve margins, while average lead prices
               increased 28% yoy (US $1,509/tonne in 1QFY2010). This was also aided by a
               favourable rupee-dollar movement during the quarter. Exide registered net
               exchange gains of Rs4.8cr (Rs1cr) during the quarter. Further, a 100bp yoy decline
               in other expenditure also helped to arrest OPM contraction to a certain extent.

July 13 2010                                                                                       2
Exide Industries | 1QFY2011 Result Update


               Operating profit during the quarter grew by a robust 25.7% yoy to Rs263cr
               (Rs209cr).

               The strong earnings growth during 1QFY2011 can largely be attributed to the
               substantial improvement in EBITDA margins qoq to almost 22.8%, which were
               driven by an increase in the contribution of the in-house lead smelter to the total
               consumption of lead (almost 50%). Overall, the lead smelter acquisition has
               reduced the company’s dependence on imports and on the purchase of pure lead
               from the market, due to which management expects EBITDA margins to be in the
               range of 20-24%, going ahead.


               Exhibit 2: Lead price and EBITDA margin
                  (US $)
                  3,500                                                                                                                              30
                  3,000                                                                                                                              25
                  2,500
                                                                                                                                                     20
                  2,000
                                                                                                                                                     15
                  1,500
                                                                                                                                                     10
                  1,000
                    500                                                                                                                              5
                      0                                                                                                                              0
                           1QFY08

                                    2QFY08

                                             3QFY08

                                                        4QFY08

                                                                 1QFY09

                                                                          2QFY09

                                                                                   3QFY09

                                                                                            4QFY09

                                                                                                        1QFY10

                                                                                                                 2QFY10

                                                                                                                          3QFY10

                                                                                                                                   4QFY10

                                                                                                                                            1QFY11
                                                      Avg. Lead Price (LHS)                          EBITDA Margin (RHS)


               Source: Company, Angel research

               Bottom-line grows 35.1%: The company reported a 35.1% yoy increase in net
               profit to Rs165cr (Rs122cr) during the quarter. Higher other income of Rs6.2cr
               (Rs0.9cr), up 592% yoy helped the company to record substantial increase in net
               profit. Overall, Exide’s net profit margins improved by a healthy 80bp yoy on the
               back of robust growth in top-line, higher other income and reduction in other
               expenditure during the quarter.


July 13 2010                                                                                                                                              3
Exide Industries | 1QFY2011 Result Update


               Investment Arguments
                 Favourable outlook for the auto battery and industrial segments: Battery
                 demand is expected to remain robust on the back of a strong growth in the
                 auto battery replacement market. A better performance by the industrial
                 segment, especially in the railway and power sectors, also works in favour of
                 the company. For FY2010, in demand in the industrial segment grew by
                 around 10%, while the automotive segment recorded around 13% growth,
                 and the telecom segment de-grew by more than 35%. Going ahead, we
                 expect the demand for auto batteries (contribute almost 65% of Exide’s profit)
                 to record CAGR of around 15%, while the industrial battery segment is
                 expected to register a higher, 16-17% yoy growth over the next couple of
                 years.

                 Market leader, primary beneficiary from overall growth: Exide is a dominant
                 player across segments in which it is present ie. auto battery (OEM and
                 replacement) and industrial segment. The company has a market share of
                 approximately 72% in the auto OEM segment and around 72-73% in the auto
                 replacement segment, both of which enjoy superior hold owing to which the
                 company enjoys pricing power. The company is also garnering market share
                 in the industrial segment, which currently stands at 45%. The auto replacement
                 and Industrial segments are high-margins businesses and contribute to the
                 company’s superior performance.

                 Lead smelter acquisitions to boost margins: In FY2009, Exide acquired a 51%
                 shareholding in Leadage Alloys India, a lead smelter, at a total investment of
                 Rs33.4cr, to augment availability of indigenous raw materials. The acquisition
                 came on the heels of its buy-out of another unlisted lead-smelting company,
                 Tandon Metals, in October 2007 for Rs25cr.

                 These two acquisitions helped Exide to increase its use of recycled lead and
                 lead alloys for making storage batteries. This in turn, reduced the company's
                 dependence on imported lead in FY2010 to 32% (36% in FY2009), which is
                 the principal raw material for storage batteries. Exide would expand its lead
                 smelting capacity during the next 12-18 months to meet its increased lead
                 requirement. The company’s two smelters contributed around 50% of its lead
                 and lead alloy requirements during FY2010 (as against 35% in FY2009),
                 which it plans to increase to 70% by FY2012E. This has facilitated the
                 company in recycling scrap batteries as well as helped it clock better margins
                 despite the rise in lead prices.

                 Capex to meet long-term demand and improve company’s market reach:
                 Exide plans to increase its battery capacity at an investment of Rs350cr in
                 FY2011E. The company has been operating at almost a 100% capacity
                 utilisation level and was not able to keep pace with the surge in demand in the
                 automotive sector owing to which it lost some top-line growth due to capacity
                 limitations. The company is expanding its production capacities by setting up a
                 new plant at Ahmednagar, Maharashtra, to be on fast-track mode.


July 13 2010                                                                                  4
Exide Industries | 1QFY2011 Result Update


               Outlook and valuation
               We estimate the company to clock around 14% CAGR in volumes over
               FY2010-12E on the back of which top-line and bottom-line are estimated to post a
               CAGR of 19% and 22% respectively, in the mentioned period. We expect the prices
               of its main raw materials to be stable or increase marginally over the mentioned
               period (after the recent run-up in FY2010 and current higher inventory levels at
               LME), which will gradually be passed on.


               Exhibit 3: Lead price and inventory
                  (USD/tonne)                                                                                                                                                                                                                (
                   5,000                                                                                                                                                                                                                   250

                  4,000                                                                                                                                                                                                                    200

                  3,000                                                                                                                                                                                                                    150

                  2,000                                                                                                                                                                                                                    100

                  1,000                                                                                                                                                                                                                    50

                       0                                                                                                                                                                                                                   0
                                                                                 Oct-03


                                                                                                                                                                                             Oct-08
                                                                                                            Jan-05


                                                                                                                                                                                                                        Jan-10
                                                                                                                     Jun-05


                                                                                                                                                                                                                                 Jun-10
                           Apr-01
                                    Sep-01
                                             Feb-02


                                                               Dec-02


                                                                                          Mar-04
                                                                                                   Aug-04


                                                                                                                                                         Feb-07


                                                                                                                                                                           Dec-07


                                                                                                                                                                                                      Mar-09
                                                                                                                                                                                                               Aug-09
                                                      Jul-02


                                                                        May-03


                                                                                                                              Nov-05
                                                                                                                                       Apr-06
                                                                                                                                                Sep-06


                                                                                                                                                                  Jul-07


                                                                                                                                                                                    May-08
               Source: Bloomberg, Angel research

               We believe that growth will largely be driven by an increasing contribution from
               the industrial segment and replacement market in the automobile sector.
               Operating cost-to-sales ratio is expected to decline, with the company targeting to
               achieve higher operational efficiencies through its R&D efforts and increasing
               usage of recycled lead in batteries. Moreover, Exide's strong brand image has
               been creating value while continuously improving its RoCE due to better asset
               turnover on incremental capacities. We believe that on the back of its superior
               pricing power and declining input costs, Exide will continue to achieve higher
               return ratios and margins. A strong balance sheet and lower debt-equity ratio will
               aid the company in sustaining strong cash flows and meeting the challenges of the
               industry, going ahead.


               Exhibit 4: Change in estimates
               Y/E March (Rs cr)                                 Earlier Estimates                                              Revised Estimates                                                              % chg
                                                                         FY11E                          FY12E                          FY11E                         FY12E                            FY11E                      FY12E
                Net Sales                                                4,588                          5,406                          4,617                          5,359                                    0.6                   (0.9)
                OPM (%)                                                      22.6                            22.5                         23.7                             23.6                       113bp                      107bp
                EPS                                                              7.2                            8.9                             8.0                           9.4                        10.8                             5.9
               Source: Company, Angel research

               We have revised upwards our EPS estimates to Rs8 (Rs7.2 earlier) and to Rs9.4
               (Rs8.9 earlier) for FY2011E and FY2012E respectively, owing to the better-than-
               expected 1QFY2011 performance. At the CMP, the stock is quoting at 17x
               FY2011E and 14.5x FY2012E earnings. We have valued the company’s stake in
               ING Vysya Life Insurance at Rs12/share on FY2012E NBAP. At adjusted valuations
               of 15x FY2012E earnings for its core business, the stock is available at reasonable
               levels. Hence, we maintain an Accumulate rating on the stock, with a Target Price
               of Rs153.


July 13 2010                                                                                                                                                                                                                                   5
Exide Industries | 1QFY2011 Result Update


               Exhibit 5: One year forward P/E Band

                                    160
                                    140
                                    120


                 (Share Price Rs)
                                    100
                                     80
                                     60
                                     40
                                     20
                                      0


                                          Apr-02
                                           Jul-02
                                          Oct-02
                                          Jan-03
                                          Apr-03
                                           Jul-03
                                          Oct-03
                                          Jan-04
                                          Apr-04
                                           Jul-04
                                          Oct-04
                                          Jan-05
                                          Apr-05
                                           Jul-05
                                          Oct-05
                                          Jan-06
                                          Apr-06
                                           Jul-06
                                          Oct-06
                                          Jan-07
                                          Apr-07
                                           Jul-07
                                          Oct-07
                                          Jan-08
                                          Apr-08
                                           Jul-08
                                          Oct-08
                                          Jan-09
                                          Apr-09
                                           Jul-09
                                          Oct-09
                                          Jan-10
                                          Apr-10
                                           Jul-10
                                                 6x        10x           14x          18x

               Source: Company, Angel research


                Exhibit 6: Key Assumptions
                Y/E March                              FY07      FY08          FY09     FY10        FY11E   FY12E
                Storage Batteries ('000 units)        17,686 17,996 19,109 21,899 25,117 28,527
                % yoy chg                               22.1       1.8          6.2         14.6     14.7    13.6
                Realisation per Battery(Rs)            1347      1978          2206     2069        2216    2273
                                                        10.8      46.8         11.5         (6.2)     7.1     2.5
                Million Ampere Hours (Ma/h)            2,721     3,124     3,475       3,949        4,525   5,147
                % yoy chg                                  -      14.8         11.2         13.6     14.6    13.7
                Total Revenue                          2,383     3,580     4,215       4,532        5,569   6,486
                Automotive (Rs cr)                     1,668     2,561     2,905       3,108        3,814   4,373
                % yoy chg                                  -      53.6         13.4          7.0     22.7    14.7
                Industrial (Rs cr)                      715      1,019     1,269       1,397        1,725   2,077
                % yoy chg                                  -      42.6         24.5         10.1     23.4    20.4
                Other (Rs cr)                              -         -         41.9         27.0     31.1    35.7
               Source: Company, Angel research


July 13 2010                                                                                                    6
Exide Industries | 1QFY2011 Result Update


               Profit & Loss Statement                                                            (Rs cr)
               Y/E March                      FY2007   FY2008     FY2009    FY2010     FY2011E   FY2012E
               Gross sales                     2,383    3,606      4,233      4,542      5,579     6,496
               Less: Excise Duty               299.7    449.1      464.4      328.3      460.3     552.1
               Less: Sales Tax, VAT, Octroi    212.7    311.9      375.9      419.5      502.1     584.6
               Net Sales                       1,870    2,845      3,393      3,794      4,617     5,359
               Total operating income          1,870    2,845      3,393      3,794      4,617     5,359
               % chg                            35.6     52.1        19.3      11.8       21.7      16.1
               Total Expenditure               1,565    2,373      2,845      2,902      3,521     4,096
               Net Raw Materials               1,141    1,874      2,248      2,181      2,679     3,143
               Other Mfg costs                  143      163         188        219       264        287
               Personnel                        120      146         165        219       252        289
               Other                            161      191         243        284       327        376
               EBITDA                          305.5    471.9      548.0      892.1      1,096     1,263
               % chg                            38.8     54.5        16.1      62.8       22.8      15.3
               (% of Net Sales)                 16.3     16.6        16.1      23.5       23.7      23.6
               Depreciation& Amortisation        54       64          68         81        91        102
               EBIT                             251      408         480        811      1,005     1,161
               % chg                            52.0     62.2        17.8      69.0       23.8      15.6
               (% of Net Sales)                 13.4     14.3        14.1      21.4       21.8      21.7
               Interest & other Charges         31.0     40.8        51.6      13.5        7.2       7.2
               Other Income                     14.7      7.3         6.8      12.4       14.3      16.0
               (% of PBT)                        6.3      2.0         1.6       1.5        1.4       1.4
               Recurring PBT                    235      374         435        810      1,012     1,170
               % chg                            55.1     59.2        16.3      86.2       24.9      15.6
               Extraordinary Expense/(Inc.)      3.1      2.3         1.1      (0.2)         -          -
               PBT (reported)                   232      372         434        811      1,012     1,170
               Tax                               80      124         151        273       333        373
               (% of PBT)                       34.4     33.3        34.7      33.7       32.9      31.9
               PAT (reported)                   152      248         283        537       679        797
               ADJ. PAT                         155      250         284        537       679        797
               % chg                            54.1     61.3        13.6      88.9       26.4      17.3
               (% of Net Sales)                  8.3      8.8         8.4      14.2       14.7      14.9
               Basic EPS (Rs)                    2.1      3.1         3.6       6.3        8.0       9.4
               Fully Diluted EPS (Rs)            2.1      3.1         3.6       6.3        8.0       9.4
               % chg                            54.1     51.2        13.6      77.7       26.4      17.3


July 13 2010                                                                                           7
Exide Industries | 1QFY2011 Result Update


               Cash Flow Statement                                                                  (Rs cr)
               Y/E March                           FY2007   FY2008   FY2009    FY2010   FY2011E    FY2012E
               Profit before tax                     232      372       434      811      1,012      1,170
               Depreciation                           54       64        68       81         91        102
               Change in Working Capital              25      124       (55)      62          0         94
               Less: Other income                     42      243      (202)     159        (23)       225
               Direct taxes paid                      80      124       151      273        333        373
               Cash Flow from Operations             189      194       498      521       793         768
               (Inc.)/Dec. in Fixed Assets           (88)    (167)     (130)    (100)     (291)      (201)
               (Inc.)/Dec. in Investments            (99)    (140)     (150)    (667)     (375)      (455)
               (Inc.)/Dec. in loans and advances      (0)     (13)        6        3        (12)       (13)
               Other income                           (7)      14       (41)     (11)          -          -
               Cash Flow from Investing             (194)    (307)     (315)    (775)     (678)      (669)
               Issue of Equity                          -     149          -     530           -          -
               Inc./(Dec.) in loans                   35       25       (33)    (227)        (0)          -
               Dividend Paid (Incl. Tax)              26       31        37       56         95         99
               Others                                (71)     (91)     (156)    (135)     (188)      (197)
               Cash Flow from Financing              (10)     113      (151)     224        (93)       (97)
               Inc./(Dec.) in Cash                   (16)       0        32      (31)        22          1
               Opening Cash balances                  17        1         2       34          3         25
               Closing Cash balances                   1        2        34        3         25         26


July 13 2010                                                                                             8
Exide Industries | 1QFY2011 Result Update


               Key Ratios
               Y/E March                                FY2007    FY2008     FY2009    FY2010    FY2011E    FY2012E
               Valuation Ratio (x)
               P/E (on FDEPS)                            65.6      43.4       38.2       21.5      17.0       14.5
               P/CEPS                                    48.6      34.5       30.8       18.7      15.0       12.8
               P/BV                                      16.2      11.0        8.9       5.3        4.2        3.4
               Dividend yield (%)                         0.3       0.3        0.4       0.7        0.7        0.9
               EV/Sales                                   6.0       3.9        3.3       2.9        2.4        2.0
               EV/EBITDA                                 36.6      23.8       20.3       12.3      10.0        8.6
               EV / Total Assets                         10.8       7.9        6.9       4.6        3.7        3.0
               Per Share Data (Rs)
               EPS (Basic)                                2.1       3.1        3.6       6.3        8.0        9.4
               EPS (fully diluted)                        2.1       3.1        3.6       6.3        8.0        9.4
               Cash EPS                                   2.8       3.9        4.4       7.3        9.1       10.6
               DPS                                        0.4       0.4        0.6       1.0        1.0        1.3
               Book Value                                 8.4      12.4       15.2       25.8      32.6       40.5
               Dupont Analysis
               EBIT margin                               13.4      14.3       14.1       21.4      21.8       21.7
               Tax retention ratio                        0.7       0.7        0.7       0.7        0.7        0.7
               Asset turnover (x)                         2.1       2.4        2.3       2.0        1.8        1.7
               ROIC (Post-tax)                           18.1      22.8       21.4       27.7      25.8       24.5
               Cost of Debt (Post Tax)                    6.6       8.1       10.1       4.4        5.4        5.4
               Leverage (x)                                -         -          -         -          -          -
               Operating RoE                             18.1      22.8       21.4       27.7      25.8       24.5
               Returns (%)
               RoCE (Pre-tax)                            26.0      33.1       31.7       40.8      37.8       35.4
               Angel RoIC (Pre-tax)                      25.2      29.4       31.1       34.7      34.7       32.7
               RoE                                       25.4      29.5       25.0       31.0      27.1       25.4
               Turnover ratios (x)
               Asset Turnover (Gross Block)               2.0       2.8        2.9       2.9        3.1        3.1
               Inventory / Sales (days)                    62        62         54        50         49         49
               Receivables (days)                          29        26         26        23         26         26
               Payables (days)                             53        51         46        42         40         39
               Working capital cycle (ex-cash) (days)      30        30         28        26         24         24
               Solvency ratios (x)
               Net debt to equity                         (0.1)     (0.2)      (0.3)     (0.6)      (0.6)      (0.6)
               Net debt to EBITDA                         (0.2)     (0.4)      (0.7)     (1.4)      (1.5)      (1.7)
               Interest Coverage (EBIT / Interest)        8.1      10.0        9.3       60.1     139.9      161.6


July 13 2010                                                                                                        9
Exide Industries | 1QFY2011 Result Update


 Disclaimer
 This document is solely for the personal information of the recipient, and must not be singularly used as the basis of any investment
 decision. Nothing in this document should be construed as investment or financial advice. Each recipient of this document should make
 such investigations as they deem necessary to arrive at an independent evaluation of an investment in the securities of the companies
 referred to in this document (including the merits and risks involved), and should consult their own advisors to determine the merits and
 risks of such an investment.

 Angel Broking Limited, its affiliates, directors, its proprietary trading and investment businesses may, from time to time, make
 investment decisions that are inconsistent with or contradictory to the recommendations expressed herein. The views contained in this
 document are those of the analyst, and the company may or may not subscribe to all the views expressed within.

 Reports based on technical and derivative analysis center on studying charts of a stock's price movement, outstanding positions and
 trading volume, as opposed to focusing on a company's fundamentals and, as such, may not match with a report on a company's
 fundamentals.

 The information in this document has been printed on the basis of publicly available information, internal data and other reliable
 sources believed to be true, and is for general guidance only. Angel Broking Limited has not independently verified all the information
 contained within this document. Accordingly, we cannot testify, nor make any representation or warranty, express or implied, to the
 accuracy, contents or data contained within this document. While Angel Broking Limited endeavours to update on a reasonable basis
 the information discussed in this material, there may be regulatory, compliance, or other reasons that prevent us from doing so.

 This document is being supplied to you solely for your information, and its contents, information or data may not be reproduced,
 redistributed or passed on, directly or indirectly.

 Angel Broking Limited and its affiliates may seek to provide or have engaged in providing corporate finance, investment banking or
 other advisory services in a merger or specific transaction to the companies referred to in this report, as on the date of this report or in
 the past.

 Neither Angel Broking Limited, nor its directors, employees or affiliates shall be liable for any loss or damage that may arise from or in
 connection with the use of this information.

 Note: Please refer to the important `Stock Holding Disclosure' report on the Angel website (Research Section).


 Disclosure of Interest Statement (Company name)
 1. Analyst ownership of the stock                                                  No
 2. Angel and its Group companies ownership of the stock                            Yes
 3. Angel and its Group companies' Directors ownership of the stock                 No
 4. Broking relationship with company covered                                       No

 Note: We have not considered any Exposure below Rs 1 lakh for Angel, its Group companies and Directors.


 Ratings (Returns) :             Buy (> 15%)                      Accumulate (5% to 15%)                 Neutral (-5 to 5%)
                                 Reduce (-5% to 15%)              Sell (< -15%)


July 13 2010                                                                                                                              10

More Related Content

What's hot (20)

Tech Mahindra
Tech Mahindra Tech Mahindra
Tech Mahindra
 
Fag y2010-220410
Fag y2010-220410Fag y2010-220410
Fag y2010-220410
 
Greenply
Greenply Greenply
Greenply
 
Bosch ru1 qcy2010-290410
Bosch ru1 qcy2010-290410Bosch ru1 qcy2010-290410
Bosch ru1 qcy2010-290410
 
India Cement
India CementIndia Cement
India Cement
 
Mcnally Bharat
Mcnally BharatMcnally Bharat
Mcnally Bharat
 
SAIL
SAILSAIL
SAIL
 
Balaji ru4 qfy2010e-290410
Balaji  ru4 qfy2010e-290410Balaji  ru4 qfy2010e-290410
Balaji ru4 qfy2010e-290410
 
Bajaj auto ru4 qfy2010-140510
Bajaj auto ru4 qfy2010-140510Bajaj auto ru4 qfy2010-140510
Bajaj auto ru4 qfy2010-140510
 
Wipro
Wipro  Wipro
Wipro
 
Maruti
Maruti Maruti
Maruti
 
Gipcl ru4 qfy2010-260510
Gipcl ru4 qfy2010-260510Gipcl ru4 qfy2010-260510
Gipcl ru4 qfy2010-260510
 
Alembic
Alembic Alembic
Alembic
 
Punj Lloyd
Punj LloydPunj Lloyd
Punj Lloyd
 
Hindalco Novelis
Hindalco Novelis Hindalco Novelis
Hindalco Novelis
 
Cccl ru4 qfy2010-100510
Cccl  ru4 qfy2010-100510Cccl  ru4 qfy2010-100510
Cccl ru4 qfy2010-100510
 
Concor -Result Update
Concor -Result UpdateConcor -Result Update
Concor -Result Update
 
Cesc
Cesc Cesc
Cesc
 
HUL
HULHUL
HUL
 
Ashoke Leyland
Ashoke LeylandAshoke Leyland
Ashoke Leyland
 

Viewers also liked

report 140110 01
report 140110 01report 140110 01
report 140110 01Rohan Shah
 
Exide Industries – India Moves on Exide
Exide Industries – India Moves on ExideExide Industries – India Moves on Exide
Exide Industries – India Moves on Exide
Shailesh Saraf
 
Exide 2 qfy2011ru-121010
Exide 2 qfy2011ru-121010Exide 2 qfy2011ru-121010
Exide 2 qfy2011ru-121010Angel Broking
 
Exide Ind: Net sales grows 17.51% to Rs19123.60 mn; Maintain buy
 Exide Ind: Net sales grows 17.51% to Rs19123.60 mn; Maintain buy Exide Ind: Net sales grows 17.51% to Rs19123.60 mn; Maintain buy
Exide Ind: Net sales grows 17.51% to Rs19123.60 mn; Maintain buy
IndiaNotes.com
 
Exide Industries: Strategic Sales Effectiveness Workshop At Exide , Pan India...
Exide Industries: Strategic Sales Effectiveness Workshop At Exide , Pan India...Exide Industries: Strategic Sales Effectiveness Workshop At Exide , Pan India...
Exide Industries: Strategic Sales Effectiveness Workshop At Exide , Pan India...
Debashish Brahma
 
production process of Exide
production process of Exideproduction process of Exide
production process of Exide
Mayank Gupta
 
Exide industries
Exide industriesExide industries
Exide industries
Deepak Jha
 
Project report for exide
Project report for exideProject report for exide
Project report for exideBIPLAB DIKSHIT
 
Exide whole
Exide wholeExide whole
Exide whole
Jayant Pai
 
Sales Effectiveness 2012
Sales Effectiveness 2012Sales Effectiveness 2012
Sales Effectiveness 2012
Retired!
 
Market Research on Exide Industries Limited by jayshah316
Market Research on Exide Industries Limited by jayshah316Market Research on Exide Industries Limited by jayshah316
Market Research on Exide Industries Limited by jayshah316
Jay Shah
 
A comparative study of Ameron & Exide Battries in Amravati
A comparative study of Ameron & Exide Battries in AmravatiA comparative study of Ameron & Exide Battries in Amravati
A comparative study of Ameron & Exide Battries in Amravati
EduSamosa
 
competitive market analysis between Amaron and Exide_WhiteBk
competitive market analysis between Amaron and Exide_WhiteBkcompetitive market analysis between Amaron and Exide_WhiteBk
competitive market analysis between Amaron and Exide_WhiteBkSenjuti Sarkar
 
Auto battery industry
Auto battery industryAuto battery industry
Auto battery industry
Hari Krishnan
 
Summer project report@EXIDE INDUSTRIES PVT. LTD.
Summer project report@EXIDE INDUSTRIES PVT. LTD.Summer project report@EXIDE INDUSTRIES PVT. LTD.
Summer project report@EXIDE INDUSTRIES PVT. LTD.Kumar Rama Shankar
 

Viewers also liked (16)

report 140110 01
report 140110 01report 140110 01
report 140110 01
 
Exide Industries – India Moves on Exide
Exide Industries – India Moves on ExideExide Industries – India Moves on Exide
Exide Industries – India Moves on Exide
 
Exide 2 qfy2011ru-121010
Exide 2 qfy2011ru-121010Exide 2 qfy2011ru-121010
Exide 2 qfy2011ru-121010
 
Exide Ind: Net sales grows 17.51% to Rs19123.60 mn; Maintain buy
 Exide Ind: Net sales grows 17.51% to Rs19123.60 mn; Maintain buy Exide Ind: Net sales grows 17.51% to Rs19123.60 mn; Maintain buy
Exide Ind: Net sales grows 17.51% to Rs19123.60 mn; Maintain buy
 
Exide Industries: Strategic Sales Effectiveness Workshop At Exide , Pan India...
Exide Industries: Strategic Sales Effectiveness Workshop At Exide , Pan India...Exide Industries: Strategic Sales Effectiveness Workshop At Exide , Pan India...
Exide Industries: Strategic Sales Effectiveness Workshop At Exide , Pan India...
 
production process of Exide
production process of Exideproduction process of Exide
production process of Exide
 
Exide industries
Exide industriesExide industries
Exide industries
 
Project report for exide
Project report for exideProject report for exide
Project report for exide
 
Exide whole
Exide wholeExide whole
Exide whole
 
Sales Effectiveness 2012
Sales Effectiveness 2012Sales Effectiveness 2012
Sales Effectiveness 2012
 
Market Research on Exide Industries Limited by jayshah316
Market Research on Exide Industries Limited by jayshah316Market Research on Exide Industries Limited by jayshah316
Market Research on Exide Industries Limited by jayshah316
 
Presentation on exide
Presentation on exidePresentation on exide
Presentation on exide
 
A comparative study of Ameron & Exide Battries in Amravati
A comparative study of Ameron & Exide Battries in AmravatiA comparative study of Ameron & Exide Battries in Amravati
A comparative study of Ameron & Exide Battries in Amravati
 
competitive market analysis between Amaron and Exide_WhiteBk
competitive market analysis between Amaron and Exide_WhiteBkcompetitive market analysis between Amaron and Exide_WhiteBk
competitive market analysis between Amaron and Exide_WhiteBk
 
Auto battery industry
Auto battery industryAuto battery industry
Auto battery industry
 
Summer project report@EXIDE INDUSTRIES PVT. LTD.
Summer project report@EXIDE INDUSTRIES PVT. LTD.Summer project report@EXIDE INDUSTRIES PVT. LTD.
Summer project report@EXIDE INDUSTRIES PVT. LTD.
 

Similar to Exide Industries (20)

FAG Bearing
FAG BearingFAG Bearing
FAG Bearing
 
Gipcl
Gipcl Gipcl
Gipcl
 
Ashok leyland ru4 qfy2010-300410
Ashok leyland ru4 qfy2010-300410Ashok leyland ru4 qfy2010-300410
Ashok leyland ru4 qfy2010-300410
 
Tata Motors
Tata Motors Tata Motors
Tata Motors
 
Lupin
LupinLupin
Lupin
 
Cipla
Cipla Cipla
Cipla
 
Marico
Marico Marico
Marico
 
Subros
Subros Subros
Subros
 
Mahindra & Mahindra
Mahindra & MahindraMahindra & Mahindra
Mahindra & Mahindra
 
Rallis
RallisRallis
Rallis
 
JP Associates
JP AssociatesJP Associates
JP Associates
 
Jyoti Structures
Jyoti Structures  Jyoti Structures
Jyoti Structures
 
ONGC
ONGCONGC
ONGC
 
GAIL
GAILGAIL
GAIL
 
Colgate Palmolive
Colgate PalmoliveColgate Palmolive
Colgate Palmolive
 
Bajaj Electricals
Bajaj ElectricalsBajaj Electricals
Bajaj Electricals
 
Ashoke LeyLand
Ashoke LeyLandAshoke LeyLand
Ashoke LeyLand
 
ABG Shipyard
ABG Shipyard ABG Shipyard
ABG Shipyard
 
Jagran Prakashan
Jagran PrakashanJagran Prakashan
Jagran Prakashan
 
TVS Motor
TVS MotorTVS Motor
TVS Motor
 

More from Angel Broking

Market outlook 110612
Market outlook 110612Market outlook 110612
Market outlook 110612Angel Broking
 
Axis%20 bank ru1qfy2012-220711
Axis%20 bank ru1qfy2012-220711Axis%20 bank ru1qfy2012-220711
Axis%20 bank ru1qfy2012-220711Angel Broking
 
Electrosteel castings
Electrosteel castingsElectrosteel castings
Electrosteel castingsAngel Broking
 
Derivative report 19th July 2011
Derivative report 19th July 2011Derivative report 19th July 2011
Derivative report 19th July 2011Angel Broking
 
Market outlook 19th July 2011
Market outlook 19th July 2011Market outlook 19th July 2011
Market outlook 19th July 2011Angel Broking
 
Weekly Report 18th July 2011
Weekly Report 18th July 2011Weekly Report 18th July 2011
Weekly Report 18th July 2011Angel Broking
 
Derivative Report 18th July 2011
Derivative Report 18th July 2011Derivative Report 18th July 2011
Derivative Report 18th July 2011Angel Broking
 
Technical Report 18th July 2011
Technical Report 18th July 2011Technical Report 18th July 2011
Technical Report 18th July 2011Angel Broking
 
Market Outlook 18th July 2011
Market Outlook 18th July 2011Market Outlook 18th July 2011
Market Outlook 18th July 2011Angel Broking
 
Bajaj auto Result Updated
Bajaj auto Result UpdatedBajaj auto Result Updated
Bajaj auto Result UpdatedAngel Broking
 
Tata consultancy services
Tata consultancy services Tata consultancy services
Tata consultancy services Angel Broking
 
Derivatives Report 15th July 2011
Derivatives Report 15th July 2011Derivatives Report 15th July 2011
Derivatives Report 15th July 2011Angel Broking
 
Technical Report 15th July 2011
Technical Report 15th July 2011Technical Report 15th July 2011
Technical Report 15th July 2011Angel Broking
 
Infosys Result Updated
Infosys Result UpdatedInfosys Result Updated
Infosys Result UpdatedAngel Broking
 
Derivative Report 13th July 2011
Derivative Report 13th July 2011Derivative Report 13th July 2011
Derivative Report 13th July 2011Angel Broking
 

More from Angel Broking (20)

Market outlook 110612
Market outlook 110612Market outlook 110612
Market outlook 110612
 
Axis%20 bank ru1qfy2012-220711
Axis%20 bank ru1qfy2012-220711Axis%20 bank ru1qfy2012-220711
Axis%20 bank ru1qfy2012-220711
 
Electrosteel castings
Electrosteel castingsElectrosteel castings
Electrosteel castings
 
Persistent systems
Persistent systemsPersistent systems
Persistent systems
 
Ht media
Ht mediaHt media
Ht media
 
Derivative report 19th July 2011
Derivative report 19th July 2011Derivative report 19th July 2011
Derivative report 19th July 2011
 
Market outlook 19th July 2011
Market outlook 19th July 2011Market outlook 19th July 2011
Market outlook 19th July 2011
 
Telecom sector
Telecom sectorTelecom sector
Telecom sector
 
Weekly Report 18th July 2011
Weekly Report 18th July 2011Weekly Report 18th July 2011
Weekly Report 18th July 2011
 
Derivative Report 18th July 2011
Derivative Report 18th July 2011Derivative Report 18th July 2011
Derivative Report 18th July 2011
 
Technical Report 18th July 2011
Technical Report 18th July 2011Technical Report 18th July 2011
Technical Report 18th July 2011
 
Market Outlook 18th July 2011
Market Outlook 18th July 2011Market Outlook 18th July 2011
Market Outlook 18th July 2011
 
South Indian Bank
 South Indian Bank South Indian Bank
South Indian Bank
 
Bajaj auto Result Updated
Bajaj auto Result UpdatedBajaj auto Result Updated
Bajaj auto Result Updated
 
Tata consultancy services
Tata consultancy services Tata consultancy services
Tata consultancy services
 
Fc4 e63c4d01
Fc4 e63c4d01Fc4 e63c4d01
Fc4 e63c4d01
 
Derivatives Report 15th July 2011
Derivatives Report 15th July 2011Derivatives Report 15th July 2011
Derivatives Report 15th July 2011
 
Technical Report 15th July 2011
Technical Report 15th July 2011Technical Report 15th July 2011
Technical Report 15th July 2011
 
Infosys Result Updated
Infosys Result UpdatedInfosys Result Updated
Infosys Result Updated
 
Derivative Report 13th July 2011
Derivative Report 13th July 2011Derivative Report 13th July 2011
Derivative Report 13th July 2011
 

Recently uploaded

how to swap pi coins to foreign currency withdrawable.
how to swap pi coins to foreign currency withdrawable.how to swap pi coins to foreign currency withdrawable.
how to swap pi coins to foreign currency withdrawable.
DOT TECH
 
Poonawalla Fincorp and IndusInd Bank Introduce New Co-Branded Credit Card
Poonawalla Fincorp and IndusInd Bank Introduce New Co-Branded Credit CardPoonawalla Fincorp and IndusInd Bank Introduce New Co-Branded Credit Card
Poonawalla Fincorp and IndusInd Bank Introduce New Co-Branded Credit Card
nickysharmasucks
 
Isios-2024-Professional-Independent-Trustee-Survey.pdf
Isios-2024-Professional-Independent-Trustee-Survey.pdfIsios-2024-Professional-Independent-Trustee-Survey.pdf
Isios-2024-Professional-Independent-Trustee-Survey.pdf
Henry Tapper
 
Financial Assets: Debit vs Equity Securities.pptx
Financial Assets: Debit vs Equity Securities.pptxFinancial Assets: Debit vs Equity Securities.pptx
Financial Assets: Debit vs Equity Securities.pptx
Writo-Finance
 
The new type of smart, sustainable entrepreneurship and the next day | Europe...
The new type of smart, sustainable entrepreneurship and the next day | Europe...The new type of smart, sustainable entrepreneurship and the next day | Europe...
The new type of smart, sustainable entrepreneurship and the next day | Europe...
Antonis Zairis
 
Summary of financial results for 1Q2024
Summary of financial  results for 1Q2024Summary of financial  results for 1Q2024
Summary of financial results for 1Q2024
InterCars
 
how can I sell pi coins after successfully completing KYC
how can I sell pi coins after successfully completing KYChow can I sell pi coins after successfully completing KYC
how can I sell pi coins after successfully completing KYC
DOT TECH
 
655264371-checkpoint-science-past-papers-april-2023.pdf
655264371-checkpoint-science-past-papers-april-2023.pdf655264371-checkpoint-science-past-papers-april-2023.pdf
655264371-checkpoint-science-past-papers-april-2023.pdf
morearsh02
 
The WhatsPump Pseudonym Problem and the Hilarious Downfall of Artificial Enga...
The WhatsPump Pseudonym Problem and the Hilarious Downfall of Artificial Enga...The WhatsPump Pseudonym Problem and the Hilarious Downfall of Artificial Enga...
The WhatsPump Pseudonym Problem and the Hilarious Downfall of Artificial Enga...
muslimdavidovich670
 
PF-Wagner's Theory of Public Expenditure.pptx
PF-Wagner's Theory of Public Expenditure.pptxPF-Wagner's Theory of Public Expenditure.pptx
PF-Wagner's Theory of Public Expenditure.pptx
GunjanSharma28848
 
Scope Of Macroeconomics introduction and basic theories
Scope Of Macroeconomics introduction and basic theoriesScope Of Macroeconomics introduction and basic theories
Scope Of Macroeconomics introduction and basic theories
nomankalyar153
 
what is a pi whale and how to access one.
what is a pi whale and how to access one.what is a pi whale and how to access one.
what is a pi whale and how to access one.
DOT TECH
 
Commercial Bank Economic Capsule - May 2024
Commercial Bank Economic Capsule - May 2024Commercial Bank Economic Capsule - May 2024
Commercial Bank Economic Capsule - May 2024
Commercial Bank of Ceylon PLC
 
what is the best method to sell pi coins in 2024
what is the best method to sell pi coins in 2024what is the best method to sell pi coins in 2024
what is the best method to sell pi coins in 2024
DOT TECH
 
Introduction to Indian Financial System ()
Introduction to Indian Financial System ()Introduction to Indian Financial System ()
Introduction to Indian Financial System ()
Avanish Goel
 
when will pi network coin be available on crypto exchange.
when will pi network coin be available on crypto exchange.when will pi network coin be available on crypto exchange.
when will pi network coin be available on crypto exchange.
DOT TECH
 
GeM ppt in railway for presentation on gem
GeM ppt in railway  for presentation on gemGeM ppt in railway  for presentation on gem
GeM ppt in railway for presentation on gem
CwierAsn
 
BYD SWOT Analysis and In-Depth Insights 2024.pptx
BYD SWOT Analysis and In-Depth Insights 2024.pptxBYD SWOT Analysis and In-Depth Insights 2024.pptx
BYD SWOT Analysis and In-Depth Insights 2024.pptx
mikemetalprod
 
managementaccountingunitiv-230422140105-dd17d80b.ppt
managementaccountingunitiv-230422140105-dd17d80b.pptmanagementaccountingunitiv-230422140105-dd17d80b.ppt
managementaccountingunitiv-230422140105-dd17d80b.ppt
SuseelaPalanimuthu
 
The European Unemployment Puzzle: implications from population aging
The European Unemployment Puzzle: implications from population agingThe European Unemployment Puzzle: implications from population aging
The European Unemployment Puzzle: implications from population aging
GRAPE
 

Recently uploaded (20)

how to swap pi coins to foreign currency withdrawable.
how to swap pi coins to foreign currency withdrawable.how to swap pi coins to foreign currency withdrawable.
how to swap pi coins to foreign currency withdrawable.
 
Poonawalla Fincorp and IndusInd Bank Introduce New Co-Branded Credit Card
Poonawalla Fincorp and IndusInd Bank Introduce New Co-Branded Credit CardPoonawalla Fincorp and IndusInd Bank Introduce New Co-Branded Credit Card
Poonawalla Fincorp and IndusInd Bank Introduce New Co-Branded Credit Card
 
Isios-2024-Professional-Independent-Trustee-Survey.pdf
Isios-2024-Professional-Independent-Trustee-Survey.pdfIsios-2024-Professional-Independent-Trustee-Survey.pdf
Isios-2024-Professional-Independent-Trustee-Survey.pdf
 
Financial Assets: Debit vs Equity Securities.pptx
Financial Assets: Debit vs Equity Securities.pptxFinancial Assets: Debit vs Equity Securities.pptx
Financial Assets: Debit vs Equity Securities.pptx
 
The new type of smart, sustainable entrepreneurship and the next day | Europe...
The new type of smart, sustainable entrepreneurship and the next day | Europe...The new type of smart, sustainable entrepreneurship and the next day | Europe...
The new type of smart, sustainable entrepreneurship and the next day | Europe...
 
Summary of financial results for 1Q2024
Summary of financial  results for 1Q2024Summary of financial  results for 1Q2024
Summary of financial results for 1Q2024
 
how can I sell pi coins after successfully completing KYC
how can I sell pi coins after successfully completing KYChow can I sell pi coins after successfully completing KYC
how can I sell pi coins after successfully completing KYC
 
655264371-checkpoint-science-past-papers-april-2023.pdf
655264371-checkpoint-science-past-papers-april-2023.pdf655264371-checkpoint-science-past-papers-april-2023.pdf
655264371-checkpoint-science-past-papers-april-2023.pdf
 
The WhatsPump Pseudonym Problem and the Hilarious Downfall of Artificial Enga...
The WhatsPump Pseudonym Problem and the Hilarious Downfall of Artificial Enga...The WhatsPump Pseudonym Problem and the Hilarious Downfall of Artificial Enga...
The WhatsPump Pseudonym Problem and the Hilarious Downfall of Artificial Enga...
 
PF-Wagner's Theory of Public Expenditure.pptx
PF-Wagner's Theory of Public Expenditure.pptxPF-Wagner's Theory of Public Expenditure.pptx
PF-Wagner's Theory of Public Expenditure.pptx
 
Scope Of Macroeconomics introduction and basic theories
Scope Of Macroeconomics introduction and basic theoriesScope Of Macroeconomics introduction and basic theories
Scope Of Macroeconomics introduction and basic theories
 
what is a pi whale and how to access one.
what is a pi whale and how to access one.what is a pi whale and how to access one.
what is a pi whale and how to access one.
 
Commercial Bank Economic Capsule - May 2024
Commercial Bank Economic Capsule - May 2024Commercial Bank Economic Capsule - May 2024
Commercial Bank Economic Capsule - May 2024
 
what is the best method to sell pi coins in 2024
what is the best method to sell pi coins in 2024what is the best method to sell pi coins in 2024
what is the best method to sell pi coins in 2024
 
Introduction to Indian Financial System ()
Introduction to Indian Financial System ()Introduction to Indian Financial System ()
Introduction to Indian Financial System ()
 
when will pi network coin be available on crypto exchange.
when will pi network coin be available on crypto exchange.when will pi network coin be available on crypto exchange.
when will pi network coin be available on crypto exchange.
 
GeM ppt in railway for presentation on gem
GeM ppt in railway  for presentation on gemGeM ppt in railway  for presentation on gem
GeM ppt in railway for presentation on gem
 
BYD SWOT Analysis and In-Depth Insights 2024.pptx
BYD SWOT Analysis and In-Depth Insights 2024.pptxBYD SWOT Analysis and In-Depth Insights 2024.pptx
BYD SWOT Analysis and In-Depth Insights 2024.pptx
 
managementaccountingunitiv-230422140105-dd17d80b.ppt
managementaccountingunitiv-230422140105-dd17d80b.pptmanagementaccountingunitiv-230422140105-dd17d80b.ppt
managementaccountingunitiv-230422140105-dd17d80b.ppt
 
The European Unemployment Puzzle: implications from population aging
The European Unemployment Puzzle: implications from population agingThe European Unemployment Puzzle: implications from population aging
The European Unemployment Puzzle: implications from population aging
 

Exide Industries

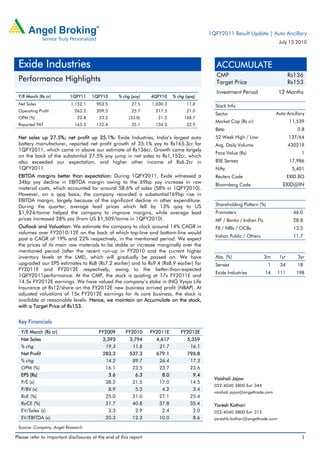
  • 1. 1QFY2011 Result Update | Auto Ancillary July 13 2010 Exide Industries ACCUMULATE CMP Rs136 Performance Highlights Target Price Rs153 Investment Period 12 Months Y/E March (Rs cr) 1QFY11 1QFY10 % chg (yoy) 4QFY10 % chg (qoq) Net Sales 1,152.1 903.5 27.5 1,030.3 11.8 Stock Info Operating Profit 263.2 209.5 25.7 217.5 21.0 Sector Auto Ancillary OPM (%) 22.8 23.2 (33.8) 21.2 168.7 Market Cap (Rs cr) 11,539 Reported PAT 165.3 122.4 35.1 134.5 22.9 Beta 0.8 Net sales up 27.5%; net profit up 35.1%: Exide Industries, India’s largest auto 52 Week High / Low 137/64 battery manufacturer, reported net profit growth of 35.1% yoy to Rs165.3cr for Avg. Daily Volume 430219 1QFY2011, which came in above our estimate of Rs136cr. Growth came largely Face Value (Rs) 1 on the back of the substantial 27.5% yoy jump in net sales to Rs1,152cr, which also exceeded our expectation, and higher other income of Rs6.2cr in BSE Sensex 17,986 1QFY2011. Nifty 5,401 EBITDA margins better than expectation: During 1QFY2011, Exide witnessed a Reuters Code EXID.BO 34bp yoy decline in EBITDA margin owing to the 69bp yoy increase in raw Bloomberg Code EXID@IN material costs, which accounted for around 58.6% of sales (58% in 1QFY2010). However, on a qoq basis, the company recorded a substantial169bp rise in EBITDA margin, largely because of the significant decline in other expenditure. During the quarter, average lead prices which fell by 13% qoq to US Shareholding Pattern (%) $1,924/tonne helped the company to improve margins, while average lead Promoters 46.0 prices increased 28% yoy (from US $1,509/tonne in 1QFY2010). MF / Banks / Indian Fls 28.8 Outlook and Valuation: We estimate the company to clock around 14% CAGR in FII / NRIs / OCBs 13.5 volumes over FY2010-12E on the back of which top-line and bottom-line would Indian Public / Others 11.7 post a CAGR of 19% and 22% respectively, in the mentioned period. We expect the prices of its main raw materials to be stable or increase marginally over the mentioned period (after the recent run-up in FY2010 and the current higher inventory levels at the LME), which will gradually be passed on. We have Abs. (%) 3m 1yr 3yr upgraded our EPS estimates to Rs8 (Rs7.2 earlier) and to Rs9.4 (Rs8.9 earlier) for Sensex 1 34 18 FY2011E and FY2012E respectively, owing to the better-than-expected Exide Industries 14 111 198 1QFY2011performance. At the CMP, the stock is quoting at 17x FY2011E and 14.5x FY2012E earnings. We have valued the company’s stake in ING Vysya Life Insurance at Rs12/share on the FY2012E new business arrived profit (NBAP). At adjusted valuations of 15x FY2012E earnings for its core business, the stock is available at reasonable levels. Hence, we maintain an Accumulate on the stock, with a Target Price of Rs153. Key Financials Y/E March (Rs cr) FY2009 FY2010 FY2011E FY2012E Net Sales 3,393 3,794 4,617 5,359 % chg 19.3 11.8 21.7 16.1 Net Profit 283.3 537.3 679.1 796.8 % chg 14.2 89.7 26.4 17.3 OPM (%) 16.1 23.5 23.7 23.6 EPS (Rs) 3.6 6.3 8.0 9.4 Vaishali Jajoo P/E (x) 38.2 21.5 17.0 14.5 022-4040 3800 Ext: 344 P/BV (x) 8.9 5.3 4.2 3.4 vaishali.jajoo@angeltrade.com RoE (%) 25.0 31.0 27.1 25.4 RoCE (%) 31.7 40.8 37.8 35.4 Yaresh Kothari EV/Sales (x) 3.3 2.9 2.4 2.0 022-4040 3800 Ext: 313 EV/EBITDA (x) 20.3 12.3 10.0 8.6 yareshb.kothari@angeltrade.com Source: Company, Angel Research Please refer to important disclosures at the end of this report 1
  • 2. Exide Industries | 1QFY2011 Result Update Exhibit 1: 1QFY2011 Performance Y/E March (Rs cr) 1QFY11 1QFY10 % Chg FY10 FY09 % Chg Net Sales 1,152.1 903.5 27.5 3,794.0 3,393.0 11.8 Consumption of RM 675.7 523.7 29.0 2,174.7 2,236.2 (2.7) (% of Sales) 58.6 58.0 68.5 57.3 65.9 Staff Costs 67.8 53.7 26.3 218.8 165.2 32.5 (% of Sales) 5.9 5.9 5.8 4.9 Purchases of TG 10.6 1.9 447.4 6.0 12.2 (50.5) (% of Sales) 0.9 0.2 0.2 0.4 Other Expenses 134.8 114.7 17.5 502.3 431.5 16.4 (% of Sales) 11.7 12.7 13.2 12.7 Total Expenditure 888.9 694.0 28.1 2,901.9 2,845.1 2.0 Operating Profit 263.2 209.5 25.7 892.1 548.0 62.8 OPM (%) 22.8 23.2 23.5 16.1 Interest 1.3 0.4 235.0 13.5 51.6 (73.8) Depreciation 19.4 18.8 3.2 80.7 67.9 18.7 Other Income 6.2 0.9 592.1 12.4 6.8 83.6 PBT (excl. Extr. Items) 248.6 191.1 30.1 810.4 435.2 86.2 Extr. Income/(Expense) - - - - - - PBT (incl. Extr. Items) 248.6 191.1 30.1 810.4 435.2 86.2 (% of Sales) 21.6 21.2 21.4 12.8 Provision for Taxation 83.3 68.7 21.1 273.3 150.8 81.2 (% of PBT) 33.5 36.0 33.7 34.7 Reported PAT 165.3 122.4 35.1 537.1 284.4 88.9 PATM 14.4 13.5 14.2 8.4 Equity capital (cr) 85.0 80.0 6.3 85.0 80.0 6.3 EPS (Rs) 1.9 1.5 27.1 6.3 3.6 77.7 Source: Company, Angel research Net sales up 27.5%; overall volumes up by around 18%: For 1QFY2011, Exide Industries clocked 27.5% yoy growth in net sales to Rs1,152cr (Rs904cr), which was above our estimate of Rs1,059cr. The company’s OE and replacement sales growth, which had started improving since the beginning of FY2010, extended the same to 1QFY2011. The improving growth in commercial vehicles (CV) and tractor replacement sales (up 14% yoy) and the significant 27% growth in the motorcycle battery segment aided the company to report higher growth in the auto battery segment during the quarter. This was also supported by the healthy growth registered by the industrial battery segment during the quarter. Overall, the company recorded around 18% yoy growth in volumes and higher lead price passed on to customers helped the company to clock better yoy growth in realisations. Lower raw material costs pump up margins qoq: During 1QFY2011, Exide witnessed a 34bp yoy decline in EBITDA margins owing to the 69bp yoy rise in raw material costs, which accounted for around 58.6% of sales (58% in 1QFY2010). However, on a qoq basis, the company registered a substantial169bp jump in EBITDA margins, largely because of the significant drop in other expenditure. During the quarter, average lead prices, which declined by 13% qoq to US $1,924/tonne, helped the company to improve margins, while average lead prices increased 28% yoy (US $1,509/tonne in 1QFY2010). This was also aided by a favourable rupee-dollar movement during the quarter. Exide registered net exchange gains of Rs4.8cr (Rs1cr) during the quarter. Further, a 100bp yoy decline in other expenditure also helped to arrest OPM contraction to a certain extent. July 13 2010 2
  • 3. Exide Industries | 1QFY2011 Result Update Operating profit during the quarter grew by a robust 25.7% yoy to Rs263cr (Rs209cr). The strong earnings growth during 1QFY2011 can largely be attributed to the substantial improvement in EBITDA margins qoq to almost 22.8%, which were driven by an increase in the contribution of the in-house lead smelter to the total consumption of lead (almost 50%). Overall, the lead smelter acquisition has reduced the company’s dependence on imports and on the purchase of pure lead from the market, due to which management expects EBITDA margins to be in the range of 20-24%, going ahead. Exhibit 2: Lead price and EBITDA margin (US $) 3,500 30 3,000 25 2,500 20 2,000 15 1,500 10 1,000 500 5 0 0 1QFY08 2QFY08 3QFY08 4QFY08 1QFY09 2QFY09 3QFY09 4QFY09 1QFY10 2QFY10 3QFY10 4QFY10 1QFY11 Avg. Lead Price (LHS) EBITDA Margin (RHS) Source: Company, Angel research Bottom-line grows 35.1%: The company reported a 35.1% yoy increase in net profit to Rs165cr (Rs122cr) during the quarter. Higher other income of Rs6.2cr (Rs0.9cr), up 592% yoy helped the company to record substantial increase in net profit. Overall, Exide’s net profit margins improved by a healthy 80bp yoy on the back of robust growth in top-line, higher other income and reduction in other expenditure during the quarter. July 13 2010 3
  • 4. Exide Industries | 1QFY2011 Result Update Investment Arguments Favourable outlook for the auto battery and industrial segments: Battery demand is expected to remain robust on the back of a strong growth in the auto battery replacement market. A better performance by the industrial segment, especially in the railway and power sectors, also works in favour of the company. For FY2010, in demand in the industrial segment grew by around 10%, while the automotive segment recorded around 13% growth, and the telecom segment de-grew by more than 35%. Going ahead, we expect the demand for auto batteries (contribute almost 65% of Exide’s profit) to record CAGR of around 15%, while the industrial battery segment is expected to register a higher, 16-17% yoy growth over the next couple of years. Market leader, primary beneficiary from overall growth: Exide is a dominant player across segments in which it is present ie. auto battery (OEM and replacement) and industrial segment. The company has a market share of approximately 72% in the auto OEM segment and around 72-73% in the auto replacement segment, both of which enjoy superior hold owing to which the company enjoys pricing power. The company is also garnering market share in the industrial segment, which currently stands at 45%. The auto replacement and Industrial segments are high-margins businesses and contribute to the company’s superior performance. Lead smelter acquisitions to boost margins: In FY2009, Exide acquired a 51% shareholding in Leadage Alloys India, a lead smelter, at a total investment of Rs33.4cr, to augment availability of indigenous raw materials. The acquisition came on the heels of its buy-out of another unlisted lead-smelting company, Tandon Metals, in October 2007 for Rs25cr. These two acquisitions helped Exide to increase its use of recycled lead and lead alloys for making storage batteries. This in turn, reduced the company's dependence on imported lead in FY2010 to 32% (36% in FY2009), which is the principal raw material for storage batteries. Exide would expand its lead smelting capacity during the next 12-18 months to meet its increased lead requirement. The company’s two smelters contributed around 50% of its lead and lead alloy requirements during FY2010 (as against 35% in FY2009), which it plans to increase to 70% by FY2012E. This has facilitated the company in recycling scrap batteries as well as helped it clock better margins despite the rise in lead prices. Capex to meet long-term demand and improve company’s market reach: Exide plans to increase its battery capacity at an investment of Rs350cr in FY2011E. The company has been operating at almost a 100% capacity utilisation level and was not able to keep pace with the surge in demand in the automotive sector owing to which it lost some top-line growth due to capacity limitations. The company is expanding its production capacities by setting up a new plant at Ahmednagar, Maharashtra, to be on fast-track mode. July 13 2010 4
  • 5. Exide Industries | 1QFY2011 Result Update Outlook and valuation We estimate the company to clock around 14% CAGR in volumes over FY2010-12E on the back of which top-line and bottom-line are estimated to post a CAGR of 19% and 22% respectively, in the mentioned period. We expect the prices of its main raw materials to be stable or increase marginally over the mentioned period (after the recent run-up in FY2010 and current higher inventory levels at LME), which will gradually be passed on. Exhibit 3: Lead price and inventory (USD/tonne) ( 5,000 250 4,000 200 3,000 150 2,000 100 1,000 50 0 0 Oct-03 Oct-08 Jan-05 Jan-10 Jun-05 Jun-10 Apr-01 Sep-01 Feb-02 Dec-02 Mar-04 Aug-04 Feb-07 Dec-07 Mar-09 Aug-09 Jul-02 May-03 Nov-05 Apr-06 Sep-06 Jul-07 May-08 Source: Bloomberg, Angel research We believe that growth will largely be driven by an increasing contribution from the industrial segment and replacement market in the automobile sector. Operating cost-to-sales ratio is expected to decline, with the company targeting to achieve higher operational efficiencies through its R&D efforts and increasing usage of recycled lead in batteries. Moreover, Exide's strong brand image has been creating value while continuously improving its RoCE due to better asset turnover on incremental capacities. We believe that on the back of its superior pricing power and declining input costs, Exide will continue to achieve higher return ratios and margins. A strong balance sheet and lower debt-equity ratio will aid the company in sustaining strong cash flows and meeting the challenges of the industry, going ahead. Exhibit 4: Change in estimates Y/E March (Rs cr) Earlier Estimates Revised Estimates % chg FY11E FY12E FY11E FY12E FY11E FY12E Net Sales 4,588 5,406 4,617 5,359 0.6 (0.9) OPM (%) 22.6 22.5 23.7 23.6 113bp 107bp EPS 7.2 8.9 8.0 9.4 10.8 5.9 Source: Company, Angel research We have revised upwards our EPS estimates to Rs8 (Rs7.2 earlier) and to Rs9.4 (Rs8.9 earlier) for FY2011E and FY2012E respectively, owing to the better-than- expected 1QFY2011 performance. At the CMP, the stock is quoting at 17x FY2011E and 14.5x FY2012E earnings. We have valued the company’s stake in ING Vysya Life Insurance at Rs12/share on FY2012E NBAP. At adjusted valuations of 15x FY2012E earnings for its core business, the stock is available at reasonable levels. Hence, we maintain an Accumulate rating on the stock, with a Target Price of Rs153. July 13 2010 5
  • 6. Exide Industries | 1QFY2011 Result Update Exhibit 5: One year forward P/E Band 160 140 120 (Share Price Rs) 100 80 60 40 20 0 Apr-02 Jul-02 Oct-02 Jan-03 Apr-03 Jul-03 Oct-03 Jan-04 Apr-04 Jul-04 Oct-04 Jan-05 Apr-05 Jul-05 Oct-05 Jan-06 Apr-06 Jul-06 Oct-06 Jan-07 Apr-07 Jul-07 Oct-07 Jan-08 Apr-08 Jul-08 Oct-08 Jan-09 Apr-09 Jul-09 Oct-09 Jan-10 Apr-10 Jul-10 6x 10x 14x 18x Source: Company, Angel research Exhibit 6: Key Assumptions Y/E March FY07 FY08 FY09 FY10 FY11E FY12E Storage Batteries ('000 units) 17,686 17,996 19,109 21,899 25,117 28,527 % yoy chg 22.1 1.8 6.2 14.6 14.7 13.6 Realisation per Battery(Rs) 1347 1978 2206 2069 2216 2273 10.8 46.8 11.5 (6.2) 7.1 2.5 Million Ampere Hours (Ma/h) 2,721 3,124 3,475 3,949 4,525 5,147 % yoy chg - 14.8 11.2 13.6 14.6 13.7 Total Revenue 2,383 3,580 4,215 4,532 5,569 6,486 Automotive (Rs cr) 1,668 2,561 2,905 3,108 3,814 4,373 % yoy chg - 53.6 13.4 7.0 22.7 14.7 Industrial (Rs cr) 715 1,019 1,269 1,397 1,725 2,077 % yoy chg - 42.6 24.5 10.1 23.4 20.4 Other (Rs cr) - - 41.9 27.0 31.1 35.7 Source: Company, Angel research July 13 2010 6
  • 7. Exide Industries | 1QFY2011 Result Update Profit & Loss Statement (Rs cr) Y/E March FY2007 FY2008 FY2009 FY2010 FY2011E FY2012E Gross sales 2,383 3,606 4,233 4,542 5,579 6,496 Less: Excise Duty 299.7 449.1 464.4 328.3 460.3 552.1 Less: Sales Tax, VAT, Octroi 212.7 311.9 375.9 419.5 502.1 584.6 Net Sales 1,870 2,845 3,393 3,794 4,617 5,359 Total operating income 1,870 2,845 3,393 3,794 4,617 5,359 % chg 35.6 52.1 19.3 11.8 21.7 16.1 Total Expenditure 1,565 2,373 2,845 2,902 3,521 4,096 Net Raw Materials 1,141 1,874 2,248 2,181 2,679 3,143 Other Mfg costs 143 163 188 219 264 287 Personnel 120 146 165 219 252 289 Other 161 191 243 284 327 376 EBITDA 305.5 471.9 548.0 892.1 1,096 1,263 % chg 38.8 54.5 16.1 62.8 22.8 15.3 (% of Net Sales) 16.3 16.6 16.1 23.5 23.7 23.6 Depreciation& Amortisation 54 64 68 81 91 102 EBIT 251 408 480 811 1,005 1,161 % chg 52.0 62.2 17.8 69.0 23.8 15.6 (% of Net Sales) 13.4 14.3 14.1 21.4 21.8 21.7 Interest & other Charges 31.0 40.8 51.6 13.5 7.2 7.2 Other Income 14.7 7.3 6.8 12.4 14.3 16.0 (% of PBT) 6.3 2.0 1.6 1.5 1.4 1.4 Recurring PBT 235 374 435 810 1,012 1,170 % chg 55.1 59.2 16.3 86.2 24.9 15.6 Extraordinary Expense/(Inc.) 3.1 2.3 1.1 (0.2) - - PBT (reported) 232 372 434 811 1,012 1,170 Tax 80 124 151 273 333 373 (% of PBT) 34.4 33.3 34.7 33.7 32.9 31.9 PAT (reported) 152 248 283 537 679 797 ADJ. PAT 155 250 284 537 679 797 % chg 54.1 61.3 13.6 88.9 26.4 17.3 (% of Net Sales) 8.3 8.8 8.4 14.2 14.7 14.9 Basic EPS (Rs) 2.1 3.1 3.6 6.3 8.0 9.4 Fully Diluted EPS (Rs) 2.1 3.1 3.6 6.3 8.0 9.4 % chg 54.1 51.2 13.6 77.7 26.4 17.3 July 13 2010 7
  • 8. Exide Industries | 1QFY2011 Result Update Cash Flow Statement (Rs cr) Y/E March FY2007 FY2008 FY2009 FY2010 FY2011E FY2012E Profit before tax 232 372 434 811 1,012 1,170 Depreciation 54 64 68 81 91 102 Change in Working Capital 25 124 (55) 62 0 94 Less: Other income 42 243 (202) 159 (23) 225 Direct taxes paid 80 124 151 273 333 373 Cash Flow from Operations 189 194 498 521 793 768 (Inc.)/Dec. in Fixed Assets (88) (167) (130) (100) (291) (201) (Inc.)/Dec. in Investments (99) (140) (150) (667) (375) (455) (Inc.)/Dec. in loans and advances (0) (13) 6 3 (12) (13) Other income (7) 14 (41) (11) - - Cash Flow from Investing (194) (307) (315) (775) (678) (669) Issue of Equity - 149 - 530 - - Inc./(Dec.) in loans 35 25 (33) (227) (0) - Dividend Paid (Incl. Tax) 26 31 37 56 95 99 Others (71) (91) (156) (135) (188) (197) Cash Flow from Financing (10) 113 (151) 224 (93) (97) Inc./(Dec.) in Cash (16) 0 32 (31) 22 1 Opening Cash balances 17 1 2 34 3 25 Closing Cash balances 1 2 34 3 25 26 July 13 2010 8
  • 9. Exide Industries | 1QFY2011 Result Update Key Ratios Y/E March FY2007 FY2008 FY2009 FY2010 FY2011E FY2012E Valuation Ratio (x) P/E (on FDEPS) 65.6 43.4 38.2 21.5 17.0 14.5 P/CEPS 48.6 34.5 30.8 18.7 15.0 12.8 P/BV 16.2 11.0 8.9 5.3 4.2 3.4 Dividend yield (%) 0.3 0.3 0.4 0.7 0.7 0.9 EV/Sales 6.0 3.9 3.3 2.9 2.4 2.0 EV/EBITDA 36.6 23.8 20.3 12.3 10.0 8.6 EV / Total Assets 10.8 7.9 6.9 4.6 3.7 3.0 Per Share Data (Rs) EPS (Basic) 2.1 3.1 3.6 6.3 8.0 9.4 EPS (fully diluted) 2.1 3.1 3.6 6.3 8.0 9.4 Cash EPS 2.8 3.9 4.4 7.3 9.1 10.6 DPS 0.4 0.4 0.6 1.0 1.0 1.3 Book Value 8.4 12.4 15.2 25.8 32.6 40.5 Dupont Analysis EBIT margin 13.4 14.3 14.1 21.4 21.8 21.7 Tax retention ratio 0.7 0.7 0.7 0.7 0.7 0.7 Asset turnover (x) 2.1 2.4 2.3 2.0 1.8 1.7 ROIC (Post-tax) 18.1 22.8 21.4 27.7 25.8 24.5 Cost of Debt (Post Tax) 6.6 8.1 10.1 4.4 5.4 5.4 Leverage (x) - - - - - - Operating RoE 18.1 22.8 21.4 27.7 25.8 24.5 Returns (%) RoCE (Pre-tax) 26.0 33.1 31.7 40.8 37.8 35.4 Angel RoIC (Pre-tax) 25.2 29.4 31.1 34.7 34.7 32.7 RoE 25.4 29.5 25.0 31.0 27.1 25.4 Turnover ratios (x) Asset Turnover (Gross Block) 2.0 2.8 2.9 2.9 3.1 3.1 Inventory / Sales (days) 62 62 54 50 49 49 Receivables (days) 29 26 26 23 26 26 Payables (days) 53 51 46 42 40 39 Working capital cycle (ex-cash) (days) 30 30 28 26 24 24 Solvency ratios (x) Net debt to equity (0.1) (0.2) (0.3) (0.6) (0.6) (0.6) Net debt to EBITDA (0.2) (0.4) (0.7) (1.4) (1.5) (1.7) Interest Coverage (EBIT / Interest) 8.1 10.0 9.3 60.1 139.9 161.6 July 13 2010 9
  • 10. Exide Industries | 1QFY2011 Result Update Disclaimer This document is solely for the personal information of the recipient, and must not be singularly used as the basis of any investment decision. Nothing in this document should be construed as investment or financial advice. Each recipient of this document should make such investigations as they deem necessary to arrive at an independent evaluation of an investment in the securities of the companies referred to in this document (including the merits and risks involved), and should consult their own advisors to determine the merits and risks of such an investment. Angel Broking Limited, its affiliates, directors, its proprietary trading and investment businesses may, from time to time, make investment decisions that are inconsistent with or contradictory to the recommendations expressed herein. The views contained in this document are those of the analyst, and the company may or may not subscribe to all the views expressed within. Reports based on technical and derivative analysis center on studying charts of a stock's price movement, outstanding positions and trading volume, as opposed to focusing on a company's fundamentals and, as such, may not match with a report on a company's fundamentals. The information in this document has been printed on the basis of publicly available information, internal data and other reliable sources believed to be true, and is for general guidance only. Angel Broking Limited has not independently verified all the information contained within this document. Accordingly, we cannot testify, nor make any representation or warranty, express or implied, to the accuracy, contents or data contained within this document. While Angel Broking Limited endeavours to update on a reasonable basis the information discussed in this material, there may be regulatory, compliance, or other reasons that prevent us from doing so. This document is being supplied to you solely for your information, and its contents, information or data may not be reproduced, redistributed or passed on, directly or indirectly. Angel Broking Limited and its affiliates may seek to provide or have engaged in providing corporate finance, investment banking or other advisory services in a merger or specific transaction to the companies referred to in this report, as on the date of this report or in the past. Neither Angel Broking Limited, nor its directors, employees or affiliates shall be liable for any loss or damage that may arise from or in connection with the use of this information. Note: Please refer to the important `Stock Holding Disclosure' report on the Angel website (Research Section). Disclosure of Interest Statement (Company name) 1. Analyst ownership of the stock No 2. Angel and its Group companies ownership of the stock Yes 3. Angel and its Group companies' Directors ownership of the stock No 4. Broking relationship with company covered No Note: We have not considered any Exposure below Rs 1 lakh for Angel, its Group companies and Directors. Ratings (Returns) : Buy (> 15%) Accumulate (5% to 15%) Neutral (-5 to 5%) Reduce (-5% to 15%) Sell (< -15%) July 13 2010 10