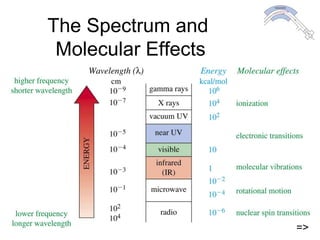
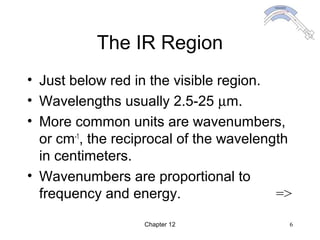
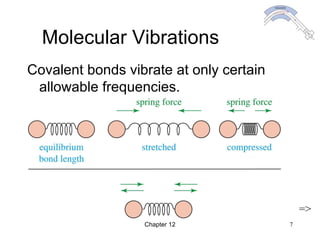
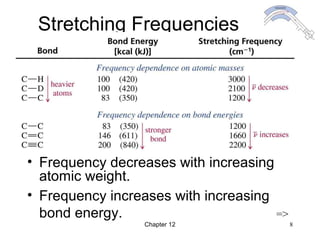
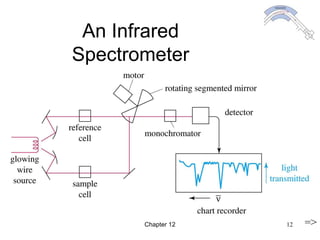
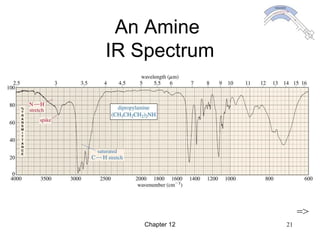
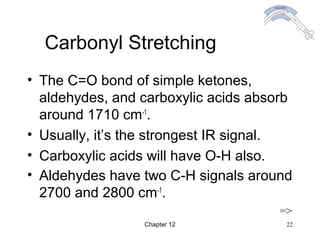
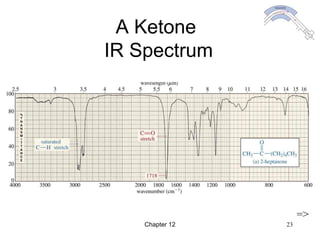
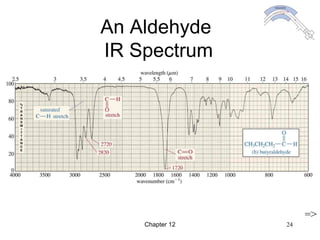
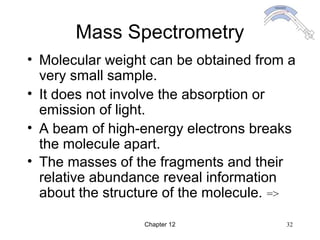
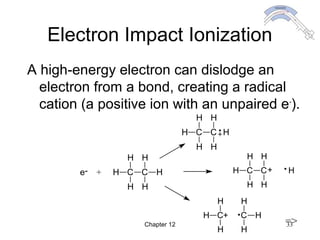
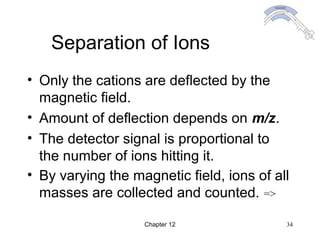
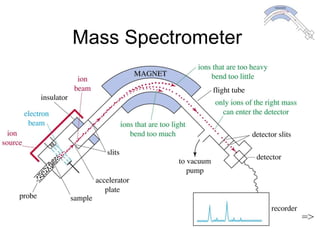
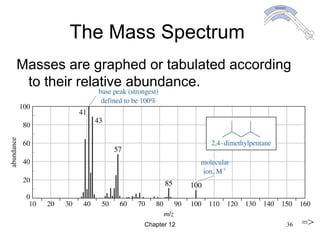
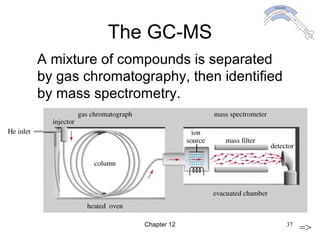
Chapter 12
Infrared Spectroscopy and
Mass Spectrometry
Organic Chemistry, 5th
Edition
L. G. Wade, Jr.
Chapter 12 2
Introduction
• Spectroscopy is an analytical technique
which helps determine structure.
• It destroys little or no sample.
• The amount of light absorbed by the
sample is measured as wavelength is
varied.
=>
Chapter 12 3
Types of Spectroscopy
• Infrared (IR) spectroscopy measures the bond
vibration frequencies in a molecule and is used
to determine the functional group.
• Mass spectrometry (MS) fragments the molecule
and measures the masses.
• Nuclear magnetic resonance (NMR)
spectroscopy detects signals from hydrogen
atoms and can be used to distinguish isomers.
• Ultraviolet (UV) spectroscopy uses electron
transitions to determine bonding patterns. =>
Chapter 12 4
Electromagnetic
Spectrum
• Examples: X rays, microwaves, radio
waves, visible light, IR, and UV.
• Frequency and wavelength are
inversely proportional.
• c = λν, where c is the speed of light.
• Energy per photon = hν, where h is
Planck’s constant. =>
Chapter 12 5
The Spectrum and
Molecular Effects
=>
=>
Chapter 12 6
The IR Region
• Just below red in the visible region.
• Wavelengths usually 2.5-25 µm.
• More common units are wavenumbers,
or cm-1
, the reciprocal of the wavelength
in centimeters.
• Wavenumbers are proportional to
frequency and energy. =>
Chapter 12 7
Molecular Vibrations
Covalent bonds vibrate at only certain
allowable frequencies.
=>
Chapter 12 8
Stretching Frequencies
• Frequency decreases with increasing
atomic weight.
• Frequency increases with increasing
bond energy. =>
Chapter 12 9
Vibrational Modes
Nonlinear molecule with n atoms usually has
3n - 6 fundamental vibrational modes.
=>
Chapter 12 10
Fingerprint of Molecule
• Whole-molecule vibrations and bending
vibrations are also quantitized.
• No two molecules will give exactly the
same IR spectrum (except enantiomers).
• Simple stretching: 1600-3500 cm-1
.
• Complex vibrations: 600-1400 cm-1
, called
the “fingerprint region.”
=>
Chapter 12 11
IR-Active and Inactive
• A polar bond is usually IR-active.
• A nonpolar bond in a symmetrical
molecule will absorb weakly or not at
all.
=>
Chapter 12 12
An Infrared
Spectrometer
=>
Chapter 12 13
FT-IR Spectrometer
• Uses an interferometer.
• Has better sensitivity.
• Less energy is needed from source.
• Completes a scan in 1-2 seconds.
• Takes several scans and averages them.
• Has a laser beam that keeps the
instrument accurately calibrated. =>
Chapter 12 14
Carbon-Carbon
Bond Stretching
• Stronger bonds absorb at higher
frequencies:
C-C 1200 cm-1
C=C 1660 cm-1
C≡C 2200 cm-1
(weak or absent if internal)
• Conjugation lowers the frequency:
isolated C=C 1640-1680 cm-1
conjugated C=C 1620-1640 cm-1
aromatic C=C approx. 1600 cm-1
=>
Chapter 12 15
Carbon-Hydrogen
Stretching
Bonds with more s character absorb at a
higher frequency.
sp3
C-H, just below 3000 cm-1
(to the right)
sp2
C-H, just above 3000 cm-1
(to the left)
sp C-H, at 3300 cm-1
=>
Chapter 12 16
An Alkane IR Spectrum
=>
Chapter 12 17
An Alkene IR Spectrum
=>
Chapter 12 18
An Alkyne IR Spectrum
=>
Chapter 12 19
O-H and N-H
Stretching
• Both of these occur around 3300 cm-1
,
but they look different.
Alcohol O-H, broad with rounded tip.
Secondary amine (R2NH), broad with one
sharp spike.
Primary amine (RNH2), broad with two
sharp spikes.
No signal for a tertiary amine (R3N) =>
Chapter 12 20
An Alcohol IR
Spectrum
=>
Chapter 12 21
An Amine
IR Spectrum
=>
Chapter 12 22
Carbonyl Stretching
• The C=O bond of simple ketones,
aldehydes, and carboxylic acids absorb
around 1710 cm-1
.
• Usually, it’s the strongest IR signal.
• Carboxylic acids will have O-H also.
• Aldehydes have two C-H signals around
2700 and 2800 cm-1
.
=>
Chapter 12 23
A Ketone
IR Spectrum
=>
Chapter 12 24
An Aldehyde
IR Spectrum
=>
Chapter 12 25
O-H Stretch of a
Carboxylic Acid
This O-H absorbs broadly, 2500-3500 cm-1
,
due to strong hydrogen bonding.
=>
Chapter 12 26
Variations in
C=O Absorption
• Conjugation of C=O with C=C lowers the
stretching frequency to ~1680 cm-1
.
• The C=O group of an amide absorbs at an
even lower frequency, 1640-1680 cm-1
.
• The C=O of an ester absorbs at a higher
frequency, ~1730-1740 cm-1
.
• Carbonyl groups in small rings (5 C’s or
less) absorb at an even higher frequency.
=>
Chapter 12 27
An Amide
IR Spectrum
=>
Chapter 12 28
Carbon - Nitrogen
Stretching
• C - N absorbs around 1200 cm-1
.
• C = N absorbs around 1660 cm-1
and is
much stronger than the C = C
absorption in the same region.
• C ≡ N absorbs strongly just above 2200
cm-1
. The alkyne C ≡ C signal is much
weaker and is just below 2200 cm-1
.
=>
Chapter 12 29
A Nitrile
IR Spectrum
=>
Chapter 12 30
Summary of IR
Absorptions
=>
=>
Chapter 12 31
Strengths and Limitations
• IR alone cannot determine a structure.
• Some signals may be ambiguous.
• The functional group is usually indicated.
• The absence of a signal is definite proof
that the functional group is absent.
• Correspondence with a known sample’s
IR spectrum confirms the identity of the
compound. =>
Chapter 12 32
Mass Spectrometry
• Molecular weight can be obtained from a
very small sample.
• It does not involve the absorption or
emission of light.
• A beam of high-energy electrons breaks
the molecule apart.
• The masses of the fragments and their
relative abundance reveal information
about the structure of the molecule. =>
Chapter 12 33
Electron Impact Ionization
A high-energy electron can dislodge an
electron from a bond, creating a radical
cation (a positive ion with an unpaired e-
).
e- + H C
H
H
C
H
H
H
H C
H
H
C
H
H
H
H C
H
H
C
H
H
+ H
H C
H
H
C
H
H
H
+
=>
Chapter 12 34
Separation of Ions
• Only the cations are deflected by the
magnetic field.
• Amount of deflection depends on m/z.
• The detector signal is proportional to
the number of ions hitting it.
• By varying the magnetic field, ions of all
masses are collected and counted. =>
Chapter 12 35
Mass Spectrometer
=>
Chapter 12 36
The Mass Spectrum
Masses are graphed or tabulated according
to their relative abundance.
=>
Chapter 12 37
The GC-MS
=>
A mixture of compounds is separated
by gas chromatography, then identified
by mass spectrometry.
Chapter 12 38
High Resolution MS
• Masses measured to 1 part in 20,000.
• A molecule with mass of 44 could be
C3H8, C2H4O, CO2, or CN2H4.
• If a more exact mass is 44.029, pick the
correct structure from the table:
C3H8 C2H4O CO2 CN2H4
44.06260 44.02620 43.98983 44.03740
=>
Chapter 12 39
Molecules with
Heteroatoms
• Isotopes: present in their usual abundance.
• Hydrocarbons contain 1.1% C-13, so there
will be a small M+1 peak.
• If Br is present, M+2 is equal to M+
.
• If Cl is present, M+2 is one-third of M+
.
• If iodine is present, peak at 127, large gap.
• If N is present, M+
will be an odd number.
• If S is present, M+2 will be 4% of M+
. =>
Chapter 12 40
Isotopic Abundance
=>
81
Br
Chapter 12 41
Mass Spectrum
with Sulfur
=>
Chapter 12 42
Mass Spectrum
with Chlorine
=>
Chapter 12 43
Mass Spectrum
with Bromine
=>
Chapter 12 44
Mass Spectra
of Alkanes
More stable carbocations will be more
abundant.
=>
Chapter 12 45
Mass Spectra
of Alkenes
Resonance-stabilized cations favored.
=>
Chapter 12 46
Mass Spectra
of Alcohols
• Alcohols usually lose a water molecule.
• M+
may not be visible.
=>
Chapter 12 47
End of Chapter 12

Wade12 ir ms

  • 1.
    Chapter 12 Infrared Spectroscopyand Mass Spectrometry Organic Chemistry, 5th Edition L. G. Wade, Jr.
  • 2.
    Chapter 12 2 Introduction •Spectroscopy is an analytical technique which helps determine structure. • It destroys little or no sample. • The amount of light absorbed by the sample is measured as wavelength is varied. =>
  • 3.
    Chapter 12 3 Typesof Spectroscopy • Infrared (IR) spectroscopy measures the bond vibration frequencies in a molecule and is used to determine the functional group. • Mass spectrometry (MS) fragments the molecule and measures the masses. • Nuclear magnetic resonance (NMR) spectroscopy detects signals from hydrogen atoms and can be used to distinguish isomers. • Ultraviolet (UV) spectroscopy uses electron transitions to determine bonding patterns. =>
  • 4.
    Chapter 12 4 Electromagnetic Spectrum •Examples: X rays, microwaves, radio waves, visible light, IR, and UV. • Frequency and wavelength are inversely proportional. • c = λν, where c is the speed of light. • Energy per photon = hν, where h is Planck’s constant. =>
  • 5.
    Chapter 12 5 TheSpectrum and Molecular Effects => =>
  • 6.
    Chapter 12 6 TheIR Region • Just below red in the visible region. • Wavelengths usually 2.5-25 µm. • More common units are wavenumbers, or cm-1 , the reciprocal of the wavelength in centimeters. • Wavenumbers are proportional to frequency and energy. =>
  • 7.
    Chapter 12 7 MolecularVibrations Covalent bonds vibrate at only certain allowable frequencies. =>
  • 8.
    Chapter 12 8 StretchingFrequencies • Frequency decreases with increasing atomic weight. • Frequency increases with increasing bond energy. =>
  • 9.
    Chapter 12 9 VibrationalModes Nonlinear molecule with n atoms usually has 3n - 6 fundamental vibrational modes. =>
  • 10.
    Chapter 12 10 Fingerprintof Molecule • Whole-molecule vibrations and bending vibrations are also quantitized. • No two molecules will give exactly the same IR spectrum (except enantiomers). • Simple stretching: 1600-3500 cm-1 . • Complex vibrations: 600-1400 cm-1 , called the “fingerprint region.” =>
  • 11.
    Chapter 12 11 IR-Activeand Inactive • A polar bond is usually IR-active. • A nonpolar bond in a symmetrical molecule will absorb weakly or not at all. =>
  • 12.
    Chapter 12 12 AnInfrared Spectrometer =>
  • 13.
    Chapter 12 13 FT-IRSpectrometer • Uses an interferometer. • Has better sensitivity. • Less energy is needed from source. • Completes a scan in 1-2 seconds. • Takes several scans and averages them. • Has a laser beam that keeps the instrument accurately calibrated. =>
  • 14.
    Chapter 12 14 Carbon-Carbon BondStretching • Stronger bonds absorb at higher frequencies: C-C 1200 cm-1 C=C 1660 cm-1 C≡C 2200 cm-1 (weak or absent if internal) • Conjugation lowers the frequency: isolated C=C 1640-1680 cm-1 conjugated C=C 1620-1640 cm-1 aromatic C=C approx. 1600 cm-1 =>
  • 15.
    Chapter 12 15 Carbon-Hydrogen Stretching Bondswith more s character absorb at a higher frequency. sp3 C-H, just below 3000 cm-1 (to the right) sp2 C-H, just above 3000 cm-1 (to the left) sp C-H, at 3300 cm-1 =>
  • 16.
    Chapter 12 16 AnAlkane IR Spectrum =>
  • 17.
    Chapter 12 17 AnAlkene IR Spectrum =>
  • 18.
    Chapter 12 18 AnAlkyne IR Spectrum =>
  • 19.
    Chapter 12 19 O-Hand N-H Stretching • Both of these occur around 3300 cm-1 , but they look different. Alcohol O-H, broad with rounded tip. Secondary amine (R2NH), broad with one sharp spike. Primary amine (RNH2), broad with two sharp spikes. No signal for a tertiary amine (R3N) =>
  • 20.
    Chapter 12 20 AnAlcohol IR Spectrum =>
  • 21.
    Chapter 12 21 AnAmine IR Spectrum =>
  • 22.
    Chapter 12 22 CarbonylStretching • The C=O bond of simple ketones, aldehydes, and carboxylic acids absorb around 1710 cm-1 . • Usually, it’s the strongest IR signal. • Carboxylic acids will have O-H also. • Aldehydes have two C-H signals around 2700 and 2800 cm-1 . =>
  • 23.
    Chapter 12 23 AKetone IR Spectrum =>
  • 24.
    Chapter 12 24 AnAldehyde IR Spectrum =>
  • 25.
    Chapter 12 25 O-HStretch of a Carboxylic Acid This O-H absorbs broadly, 2500-3500 cm-1 , due to strong hydrogen bonding. =>
  • 26.
    Chapter 12 26 Variationsin C=O Absorption • Conjugation of C=O with C=C lowers the stretching frequency to ~1680 cm-1 . • The C=O group of an amide absorbs at an even lower frequency, 1640-1680 cm-1 . • The C=O of an ester absorbs at a higher frequency, ~1730-1740 cm-1 . • Carbonyl groups in small rings (5 C’s or less) absorb at an even higher frequency. =>
  • 27.
    Chapter 12 27 AnAmide IR Spectrum =>
  • 28.
    Chapter 12 28 Carbon- Nitrogen Stretching • C - N absorbs around 1200 cm-1 . • C = N absorbs around 1660 cm-1 and is much stronger than the C = C absorption in the same region. • C ≡ N absorbs strongly just above 2200 cm-1 . The alkyne C ≡ C signal is much weaker and is just below 2200 cm-1 . =>
  • 29.
    Chapter 12 29 ANitrile IR Spectrum =>
  • 30.
    Chapter 12 30 Summaryof IR Absorptions => =>
  • 31.
    Chapter 12 31 Strengthsand Limitations • IR alone cannot determine a structure. • Some signals may be ambiguous. • The functional group is usually indicated. • The absence of a signal is definite proof that the functional group is absent. • Correspondence with a known sample’s IR spectrum confirms the identity of the compound. =>
  • 32.
    Chapter 12 32 MassSpectrometry • Molecular weight can be obtained from a very small sample. • It does not involve the absorption or emission of light. • A beam of high-energy electrons breaks the molecule apart. • The masses of the fragments and their relative abundance reveal information about the structure of the molecule. =>
  • 33.
    Chapter 12 33 ElectronImpact Ionization A high-energy electron can dislodge an electron from a bond, creating a radical cation (a positive ion with an unpaired e- ). e- + H C H H C H H H H C H H C H H H H C H H C H H + H H C H H C H H H + =>
  • 34.
    Chapter 12 34 Separationof Ions • Only the cations are deflected by the magnetic field. • Amount of deflection depends on m/z. • The detector signal is proportional to the number of ions hitting it. • By varying the magnetic field, ions of all masses are collected and counted. =>
  • 35.
    Chapter 12 35 MassSpectrometer =>
  • 36.
    Chapter 12 36 TheMass Spectrum Masses are graphed or tabulated according to their relative abundance. =>
  • 37.
    Chapter 12 37 TheGC-MS => A mixture of compounds is separated by gas chromatography, then identified by mass spectrometry.
  • 38.
    Chapter 12 38 HighResolution MS • Masses measured to 1 part in 20,000. • A molecule with mass of 44 could be C3H8, C2H4O, CO2, or CN2H4. • If a more exact mass is 44.029, pick the correct structure from the table: C3H8 C2H4O CO2 CN2H4 44.06260 44.02620 43.98983 44.03740 =>
  • 39.
    Chapter 12 39 Moleculeswith Heteroatoms • Isotopes: present in their usual abundance. • Hydrocarbons contain 1.1% C-13, so there will be a small M+1 peak. • If Br is present, M+2 is equal to M+ . • If Cl is present, M+2 is one-third of M+ . • If iodine is present, peak at 127, large gap. • If N is present, M+ will be an odd number. • If S is present, M+2 will be 4% of M+ . =>
  • 40.
    Chapter 12 40 IsotopicAbundance => 81 Br
  • 41.
    Chapter 12 41 MassSpectrum with Sulfur =>
  • 42.
    Chapter 12 42 MassSpectrum with Chlorine =>
  • 43.
    Chapter 12 43 MassSpectrum with Bromine =>
  • 44.
    Chapter 12 44 MassSpectra of Alkanes More stable carbocations will be more abundant. =>
  • 45.
    Chapter 12 45 MassSpectra of Alkenes Resonance-stabilized cations favored. =>
  • 46.
    Chapter 12 46 MassSpectra of Alcohols • Alcohols usually lose a water molecule. • M+ may not be visible. =>
  • 47.
    Chapter 12 47 Endof Chapter 12