Downloaded 947 times


![• Commonly used mass analyzers include time-of-flight [TOF], orbitraps,
quadrupoles and ion traps, and each type has specific characteristics.
• Mass analyzers can be used to separate all analytes in a sample.
• Ions that have prevent by the mass analyzers then hit the ion detector.
• This entire process is performed under an extreme vacuum (10-6 to
108 torr) to remove gas molecules, neutrals, and contaminating non-
sample ions, which can run with sample ions and alter their paths or
produce non-specific reaction products .
• Newer orbitrap technology captures ions around a central spindle
electrode and then analyzes their m/z values as they move across the
spindle
• Orbitrap technology can achieve extremely high sensitivity and
resolution.
• Mass spectrometers are connected to computers with software that
analyzes the ion detector data and produces graphs that organize the
detected ions by their individual m/z and relative abundance.](https://image.slidesharecdn.com/massspectrometryfinal-170315112111/85/Mass-spectrometry-final-pptx-25-320.jpg)


![SEQUEST®
DTASelect & Contrast
Tandem Mass Spectrometer Digestion
SCXRP
2D Chromatography
PySpzS5609 #2438 RT: 66.03 AV: 1 NL: 8.37E6
T: + c d Full ms2 729.75@35.00 [ 190.00-1470.00]
200 300 400 500 600 700 800 900 1000 1100 1200 1300 1400
m/z
0
5
10
15
20
25
30
35
40
45
50
55
60
65
70
75
80
85
90
95
100
RelativeAbundance
545.31
658.36
900.36
1031.40
913.42
1240.53
782.23
896.29
1032.43895.33
546.19 771.24
1028.41
721.31
431.15 801.38
1241.39914.34
427.27 559.13
1258.56317.17 669.39 1033.60 1312.35651.14408.74 1027.22
1142.43
915.53432.40 882.07600.24399.24
986.50 1123.49217.91 1356.10481.13 869.23 1195.44
MS/MS Spectrum
Protein Mixture
Peptide Mixture
> 1,000 Proteins Identified
Overview of Shotgun Proteomics: MudPIT](https://image.slidesharecdn.com/massspectrometryfinal-170315112111/85/Mass-spectrometry-final-pptx-60-320.jpg)


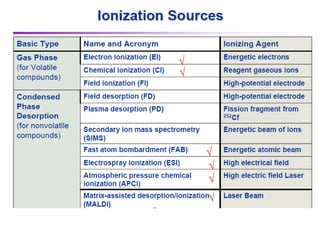
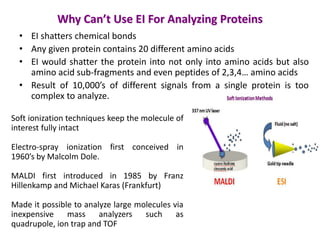
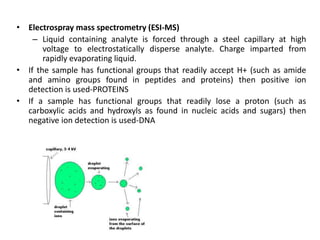
Mass spectrometry (MS) measures the mass-to-charge ratio of ions to identify molecules in mixtures. MS works by ionizing samples, separating the ions by mass using electric or magnetic fields, and detecting the ions. Common applications include proteomics. Modern MS techniques like MALDI and ESI allow analyzing large biomolecules like proteins by producing intact molecular ions. Time-of-flight, quadrupoles, and orbitraps are commonly used to separate ions by mass. MS provides sensitive, specific detection down to attomole levels and has become an important analytical tool across many fields.


