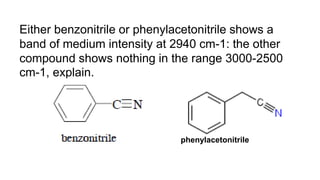
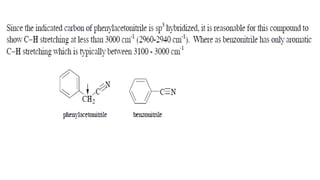
Phenylacetonitrile would show a band at 2940 cm-1, as it contains a C-H stretch. Benzonitrile contains only C-C and C-N bonds, so it would show no absorption in the 3000-2500 cm-1 range.
Chapter 12 2
Introduction
•Spectroscopy is an analytical technique which helps determine
structure.
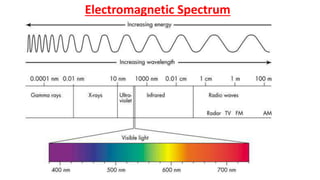
• Spectroscopy is the study of the interaction of matter with
the electromagnetic spectrum
5
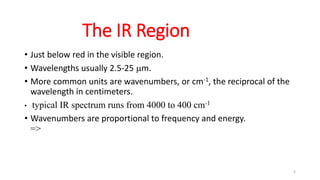
The IR Region
•Just below red in the visible region.
• Wavelengths usually 2.5-25 mm.
• More common units are wavenumbers, or cm-1, the reciprocal of the
wavelength in centimeters.
• typical IR spectrum runs from 4000 to 400 cm-1
• Wavenumbers are proportional to frequency and energy.
=>
6.
INFORMATION OBTAINED FROMIR SPECTRA
• IR is most useful in providing information about the presence or absence of
specific functional groups.
• IR can provide a molecular fingerprint that can be used when comparing
samples. If two pure samples display the same IR spectrum it can be argued
that they are the same compound.
• IR does not provide detailed information or proof of molecular formula or
structure. It provides information on molecular fragments, specifically
functional groups.
• Therefore it is very limited in scope, and must be used in conjunction with
other techniques to provide a more complete picture of the molecular
structure.
7.
TRANSMISSION vs. ABSORPTION
Whena chemical sample is exposed to the action of IR LIGHT, it can
absorb some frequencies and transmit the rest.
Chemical
sample
IR
source
Transmitted light
From all the frequencies it receives, the chemical
sample can absorb specific frequencies and allow
the rest to pass through it (transmitted light).
Detector
The detector detects the transmitted frequencies, and by doing so
also reveals the values of the absorbed frequencies.
8.
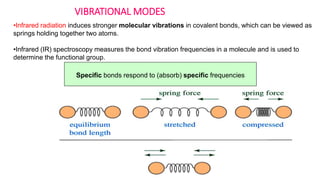
•Infrared radiation inducesstronger molecular vibrations in covalent bonds, which can be viewed as
springs holding together two atoms.
•Infrared (IR) spectroscopy measures the bond vibration frequencies in a molecule and is used to
determine the functional group.
Specific bonds respond to (absorb) specific frequencies
VIBRATIONAL MODES
9.
Types of IRAbsorptions
IR absorption occurs from the stretching and bending
of the covalent bonds in molecules To be
accompanied by IR absorption a stretch or bend must
change the dipole moment of the molecule
Molecules with symmetric bonds such as N2, O2, or
F2 do not absorb in the infrared since bond stretching
does not change the dipole moment of the molecule
10.
INFRARED ACTIVE BONDS
Notall covalent bonds display bands in the IR spectrum. Only polar bonds do
so. These are referred to as IR active.
• Strongly polar bonds such as carbonyl groups (C=O) produce strong bands.
• Medium polarity bonds and asymmetric bonds produce medium bands.
• Weakly polar bond and symmetric bonds produce weak or non observable
bands.
11.
The two primarymodes
of vibration are
stretching and bending
Stretching modes are
typically of higher
energy than bending
modes Stretching modes
are often divided into
two a symmetric and
asymmetric stretch; the
asymmetric stretch is
usually of higher energy
12.
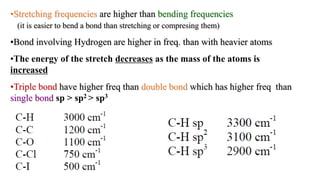
•Stretching frequencies arehigher than bending frequencies
(it is easier to bend a bond than stretching or compresing them)
•Bond involving Hydrogen are higher in freq. than with heavier atoms
•The energy of the stretch decreases as the mass of the atoms is
increased
•Triple bond have higher freq than double bond which has higher freq than
single bond sp > sp2 > sp3
13.
Infrared Band Shapes
Infraredband shapes come in various forms. Two of the most common are narrow and
broad. Narrow bands are thin and pointed, like a dagger. Broad bands are wide and
smoother.
A typical example of a broad band is that displayed by O-H bonds, such as those found
in alcohols and carboxylic acids, as shown below.
14.
IR Absorption Range
Thetypical IR absorption range for covalent bonds is 600 - 4000 cm-1. The graph
shows the regions of the spectrum where the following types of bonds normally
absorb. For example a sharp band around 2200-2400 cm-1 would indicate the
possible presence of a C-N or a C-C triple bond.
2) Absorptions inAlkenes
C-H stretch occurs in region of 3095 – 3010 cm-1
C=C stretch occurs in region of 1680 – 1620 cm-1
C-H out of plane bending (oop) absorbs at 1000 – 650 cm-1
17.
3) Absorptions inAlkynes
C-H stretching frequency is approximately 3300 cm-1
(still higher than for alkanes or alkenes)
C-C stretch occurs at approximately 2100-2260 cm-1
(but not observed if alkyne is symmetric)
19.
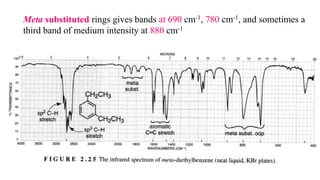
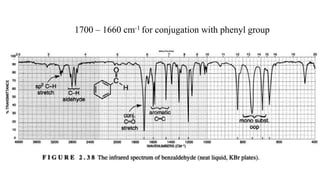
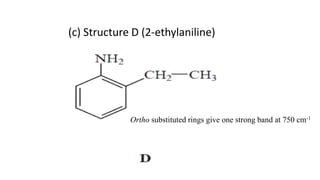
4) Absorptions inAromatic Compounds
C-H stretch occurs between 3050 and 3010 cm-1
C=C stretching often occurs in pairs at 1600 cm-1 and 1475 cm-1
Overtone and combination bands occur between 2000 and 1667 cm-1
20.
Monosubstituted rings givestrong absorptions at 690 cm-1 and
750 cm-1 (second may be masked by hydrocarbon solvent)
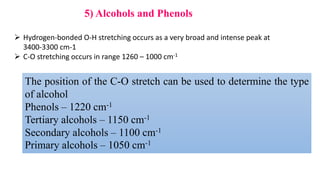
5) Alcohols andPhenols
Hydrogen-bonded O-H stretching occurs as a very broad and intense peak at
3400-3300 cm-1
C-O stretching occurs in range 1260 – 1000 cm-1
The position of the C-O stretch can be used to determine the type
of alcohol
Phenols – 1220 cm-1
Tertiary alcohols – 1150 cm-1
Secondary alcohols – 1100 cm-1
Primary alcohols – 1050 cm-1
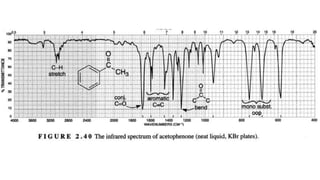
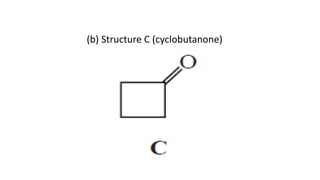
7) Ketones
Contains aC=O stretch at:
1720 – 1708 cm-1 for normal aliphatic Ketones
(slightly lower frequency than for aldehydes)
37.
8) Carboxylic Acids
Carboxylicacids occur as hydrogen-bonded dimers unless in dilute
solution
C=O stretch occurs in the following regions:
1730 – 1700 cm-1 for simple aliphatic acids in dimeric form Occurs at
lower frequencies if conjugated with an alkene or aromatic
O-H stretch occurs as a very broad peak at 3400 to 2400 cm-1, may
partially obscure C-H stretching bands
C-O stretch of medium intensity observed at 1320 –1210 cm-1
39.
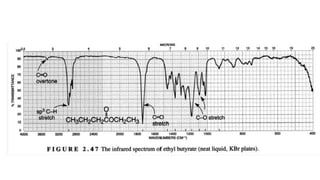
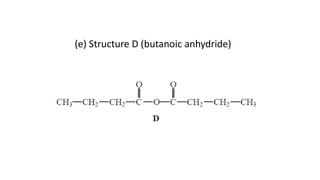
9) Esters
C=O stretchoccurs at:
1750 – 1735 cm-1 for normal aliphatic esters
(example – ethyl butyrate, 1738 cm-1)
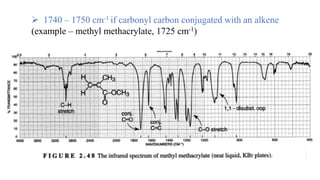
1740 – 1750 cm-1 if carbonyl carbon conjugated with an alkene
(example – methyl methacrylate, 1725 cm-1)
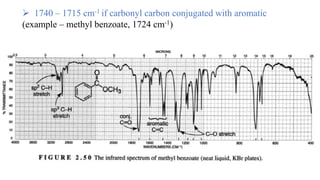
1740 – 1715 cm-1 if carbonyl carbon conjugated with aromatic
(example – methyl benzoate, 1724 cm-1)
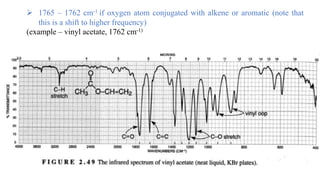
1765 – 1762 cm-1 if oxygen atom conjugated with alkene or
aromatic (note that this is a shift to higher frequency)
(example – phenyl acetate, 1765 cm-1)
(example – vinyl acetate, 1762 cm-1)
41.
1740 –1750 cm-1 if carbonyl carbon conjugated with an alkene
(example – methyl methacrylate, 1725 cm-1)
42.
1740 –1715 cm-1 if carbonyl carbon conjugated with aromatic
(example – methyl benzoate, 1724 cm-1)
43.
1765 –1762 cm-1 if oxygen atom conjugated with alkene or aromatic (note that
this is a shift to higher frequency)
(example – vinyl acetate, 1762 cm-1)
44.
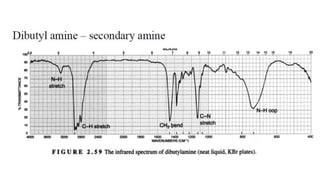
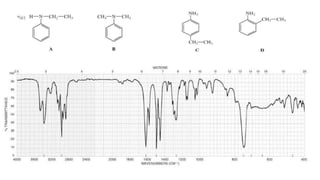
10) Amines
N-H stretchoccurs at 3500 –3300 cm-1
Primary amines – two bands
Secondary amines – one band; weak for aliphatic amines but stronger for
aromatic
Tertiary amines have no absorption in this region (no N-H bonds)
N-H out of plane bending occurs at 800 cm-1
Either benzonitrile orphenylacetonitrile shows a
band of medium intensity at 2940 cm-1: the other
compound shows nothing in the range 3000-2500
cm-1, explain.
phenylacetonitrile