This document provides an overview of infrared spectroscopy (IR) and how to interpret IR spectra. It discusses the basic theory behind IR spectroscopy, the types of information that can be obtained from IR spectra, and how to identify common functional groups based on their characteristic IR absorption patterns. Key points include:
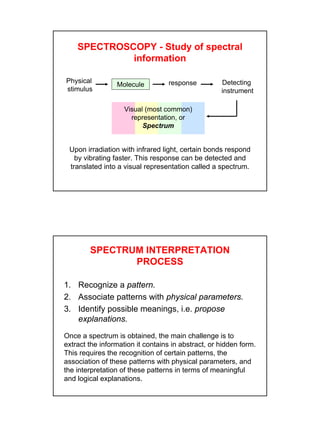
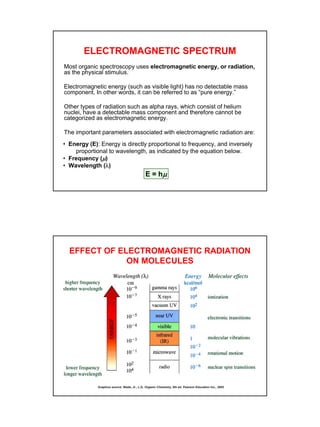
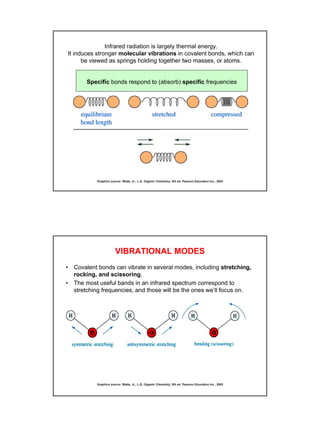
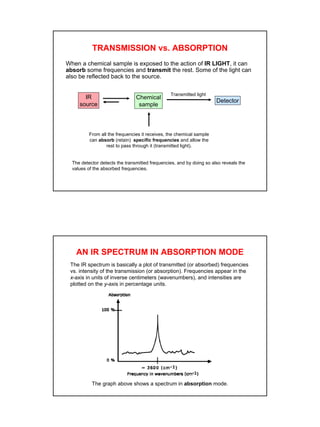
- IR spectroscopy detects molecular vibrations that are triggered by infrared light absorption. Specific bonds absorb specific frequencies.
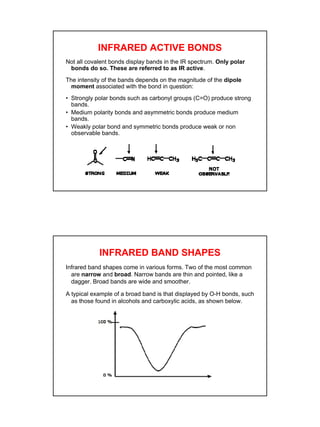
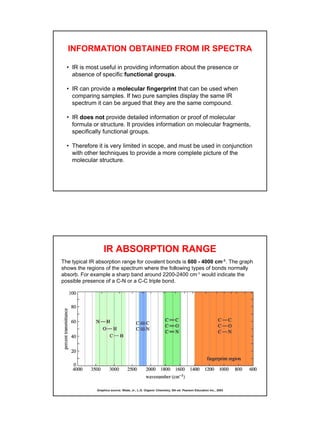
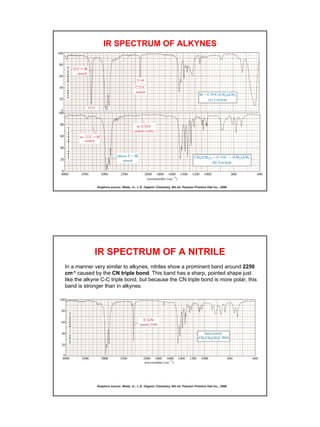
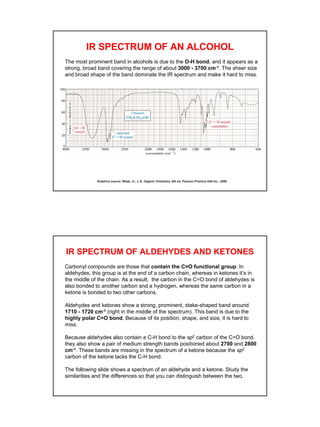
- Functional groups like C=O, C=C, O-H, N-H have distinguishing absorption bands that can be used to identify their presence.
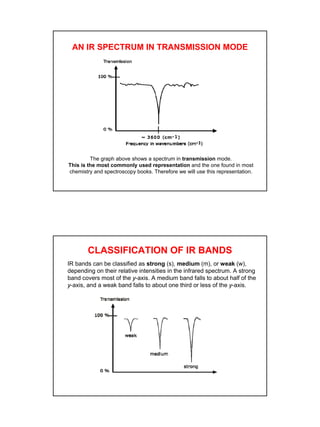
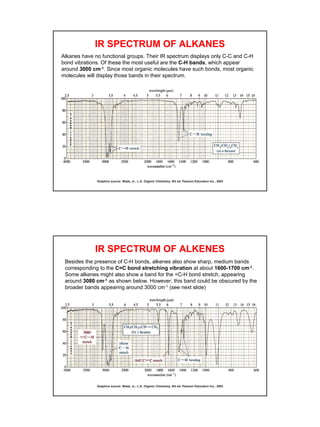
- Interpreting IR spectra involves recognizing absorption patterns and relating them to bond vibrations and functional groups.
- An IR exercise is available online