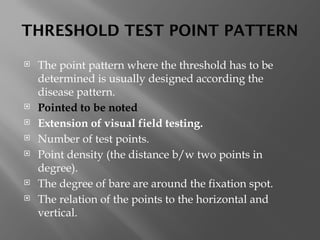
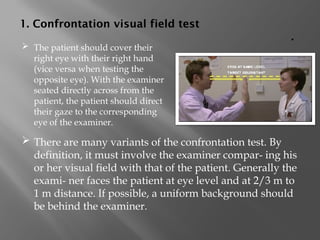
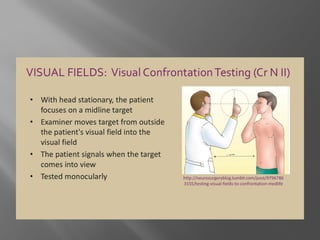
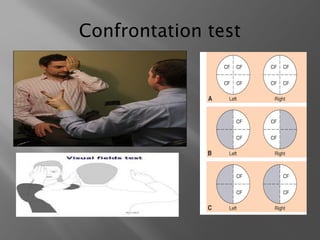
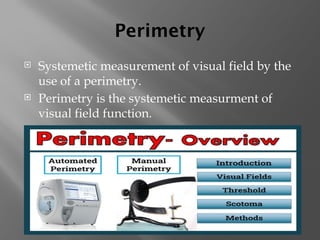
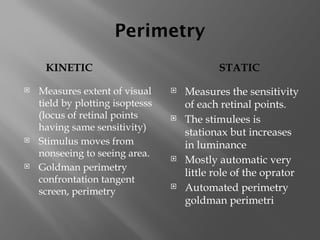
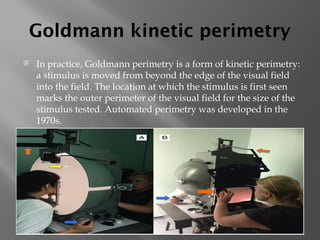
The document presents an overview of various visual field tests used in optometry, including confrontation visual field tests, automated static perimetry, and kinetic visual field tests. It outlines the methodologies for these tests, their historical development, and their applications in diagnosing conditions like glaucoma and optic nerve lesions. Additionally, it emphasizes the use of perimetry as a diagnostic and monitoring tool for various visual pathway disorders.


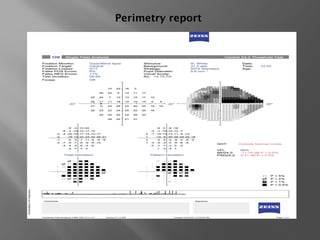
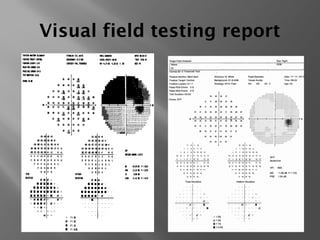
![threshold static automated
perimetry
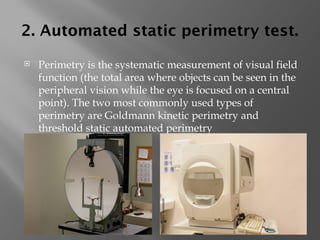
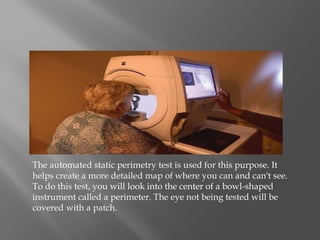
Static perimetry: This test is automated. [7][8] The
machine presents a stimulus of a particular size but with
varying intensity at various locations in a bowl
perimeter. The patient responds by pressing a button
when they visualize the particular stimulus.](https://image.slidesharecdn.com/pptperimetry-241107084600-6bcb988e/85/short-presentaion-on-primetry-visual-field-tests-21-320.jpg)
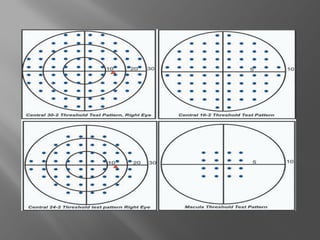
![HUMPHREY TYPES
Available on both Zeiss Humphrey Visual Field Analyzer and Haag-Streit
Octopus perimeters.
Significantly reduces total testing time without compromising the accuracy
and reliability of the data:
•SITA Standard takes 7 min per eye
•SITA Fast takes 4 min per eye
•SITA Faster takes 2 min per eye[18]
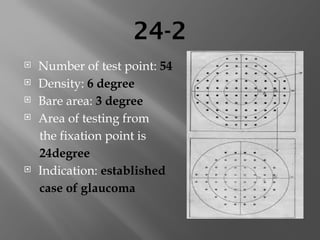
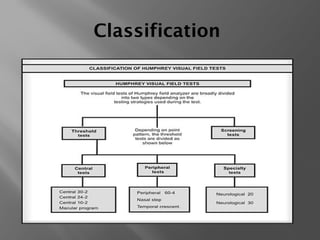
24-2 Program tests 54 points
24-2c Program tests 64 points, including 10 additional macular points
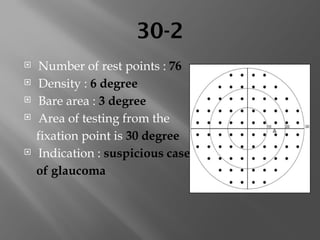
30-2 Program tests 76 points](https://image.slidesharecdn.com/pptperimetry-241107084600-6bcb988e/85/short-presentaion-on-primetry-visual-field-tests-26-320.jpg)