This document provides an overview of ECG interpretation including:
1. The conductive system of the heart and waves seen on ECG such as P, QRS, T.
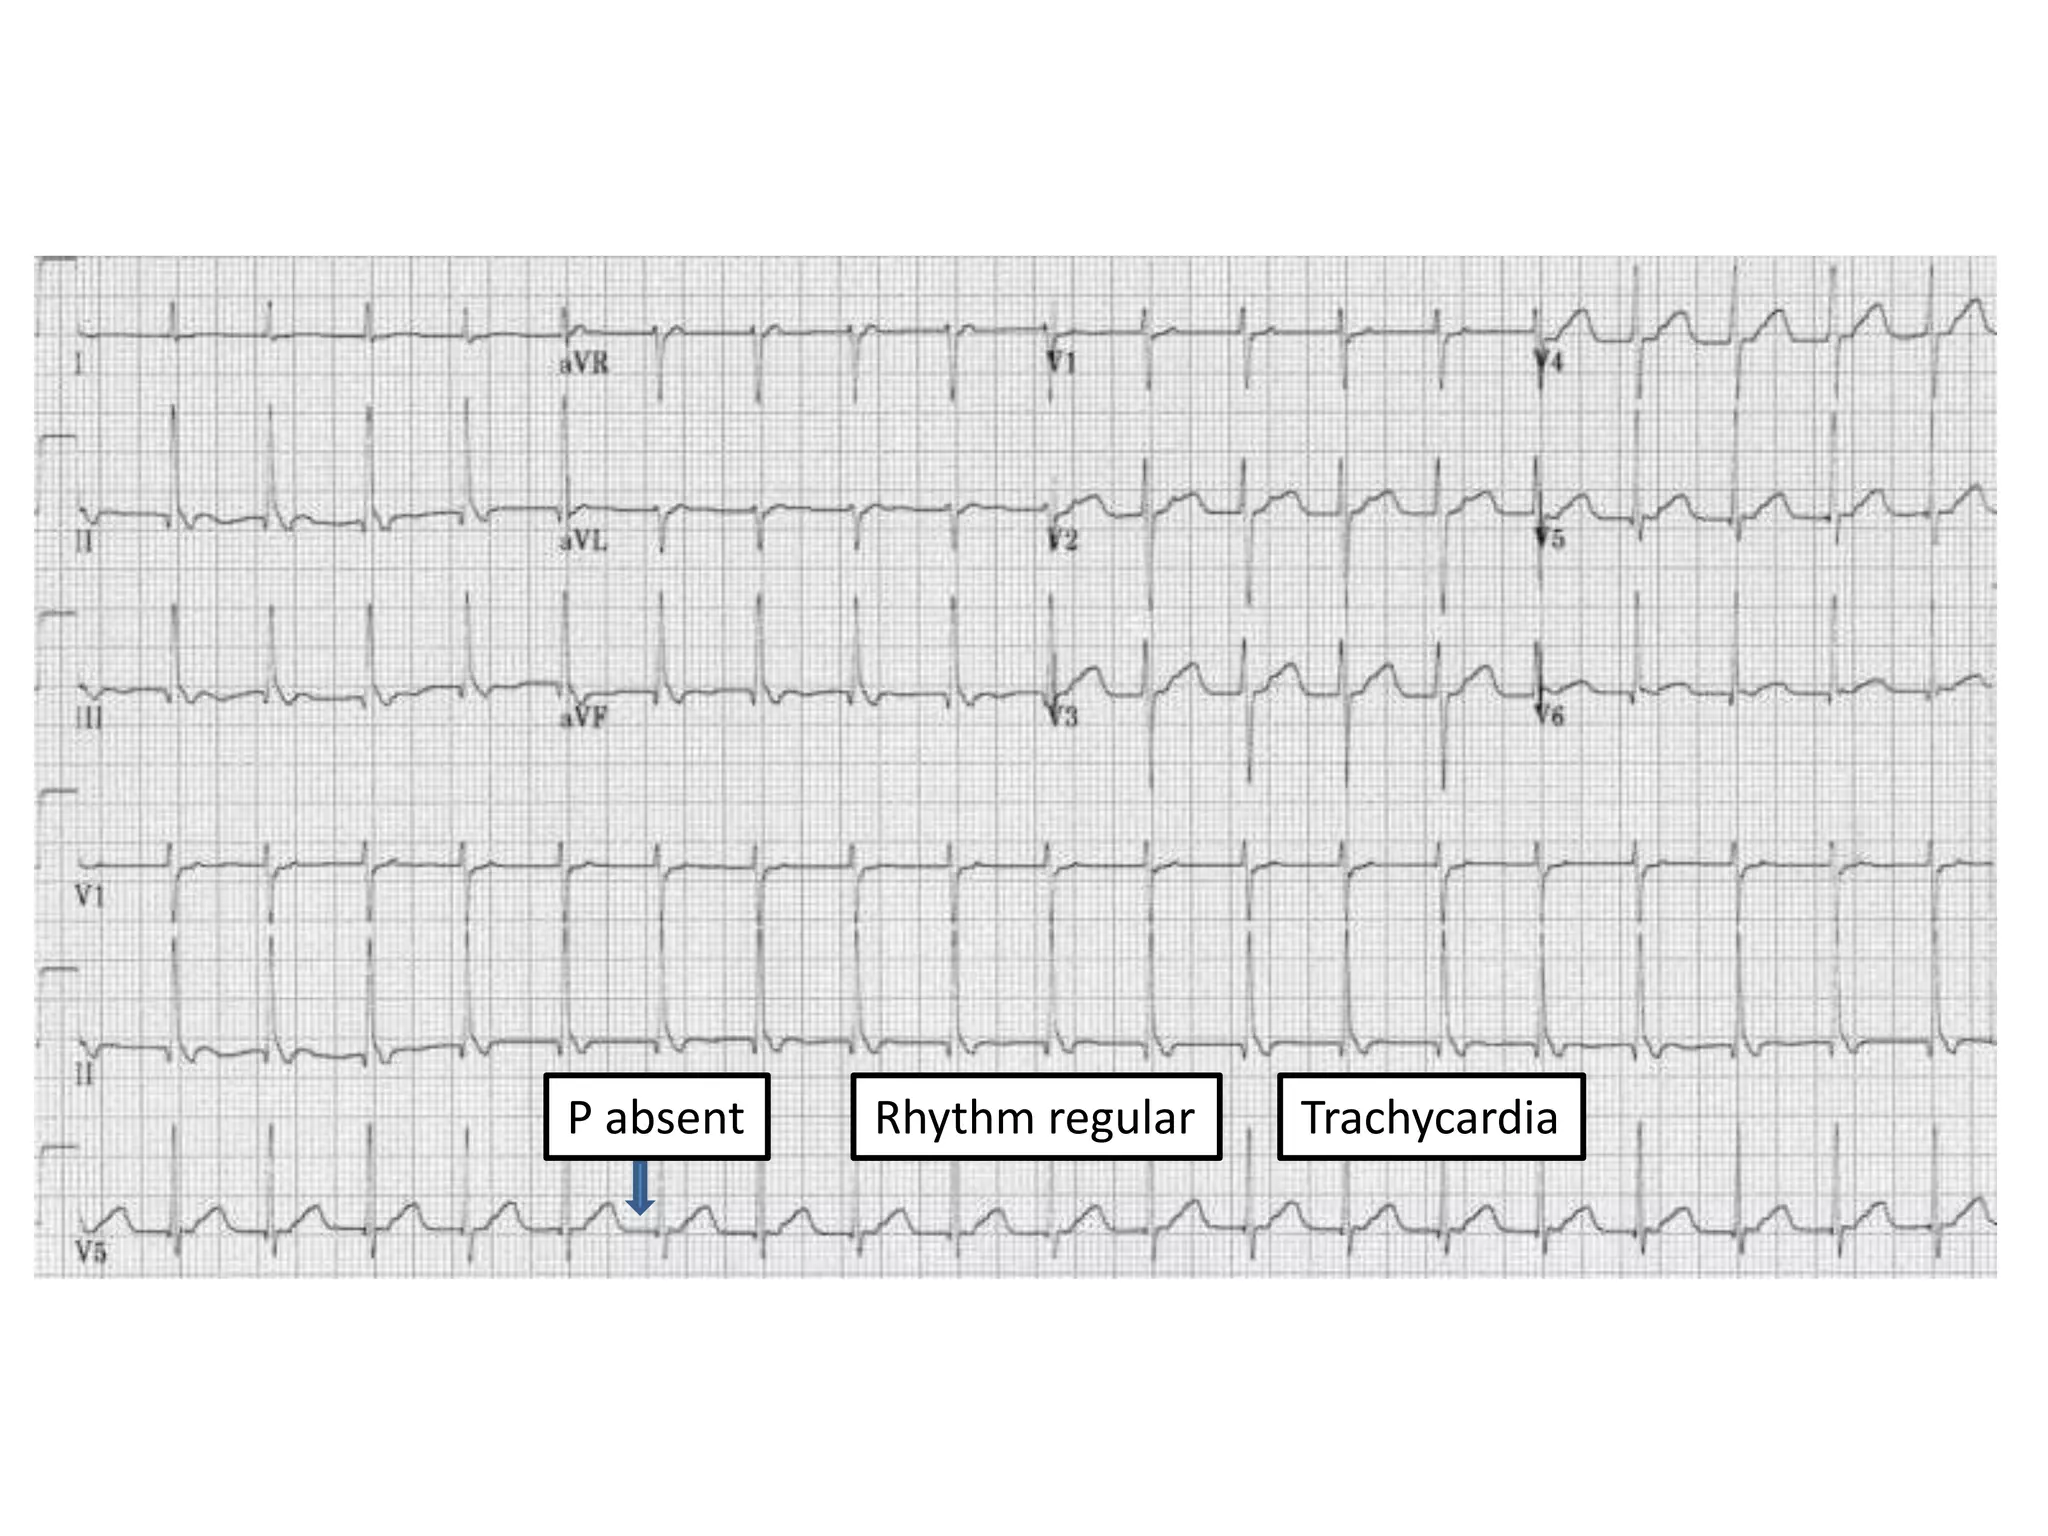
2. Approaches to ECG interpretation including assessing rate, rhythm and characteristics of waves.
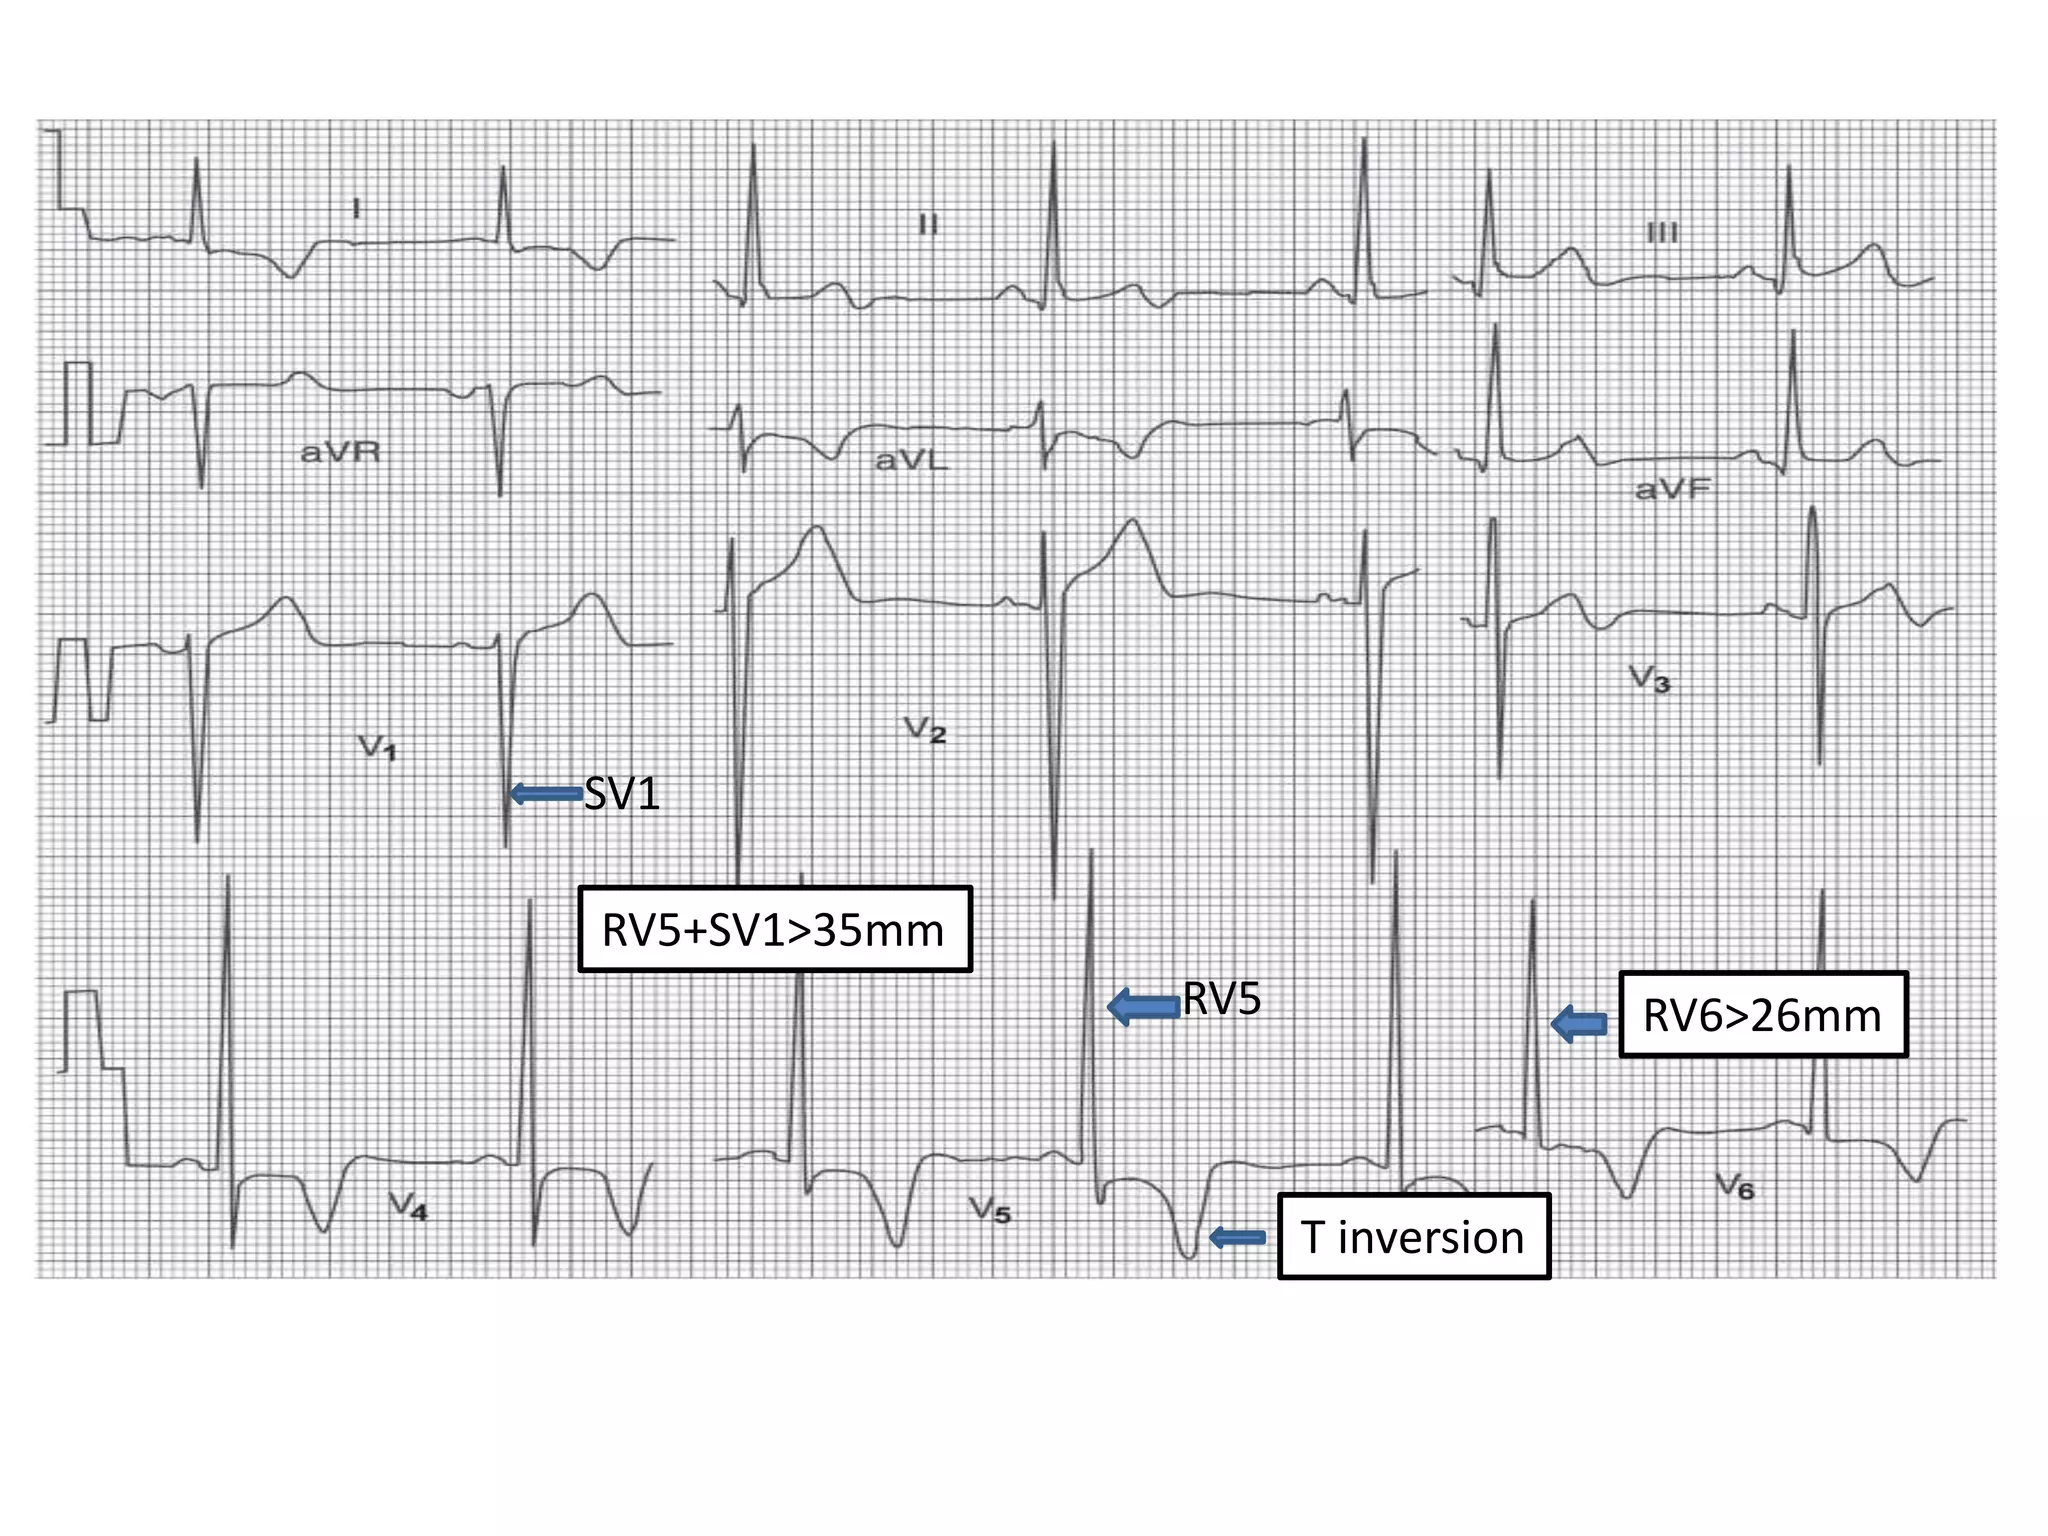
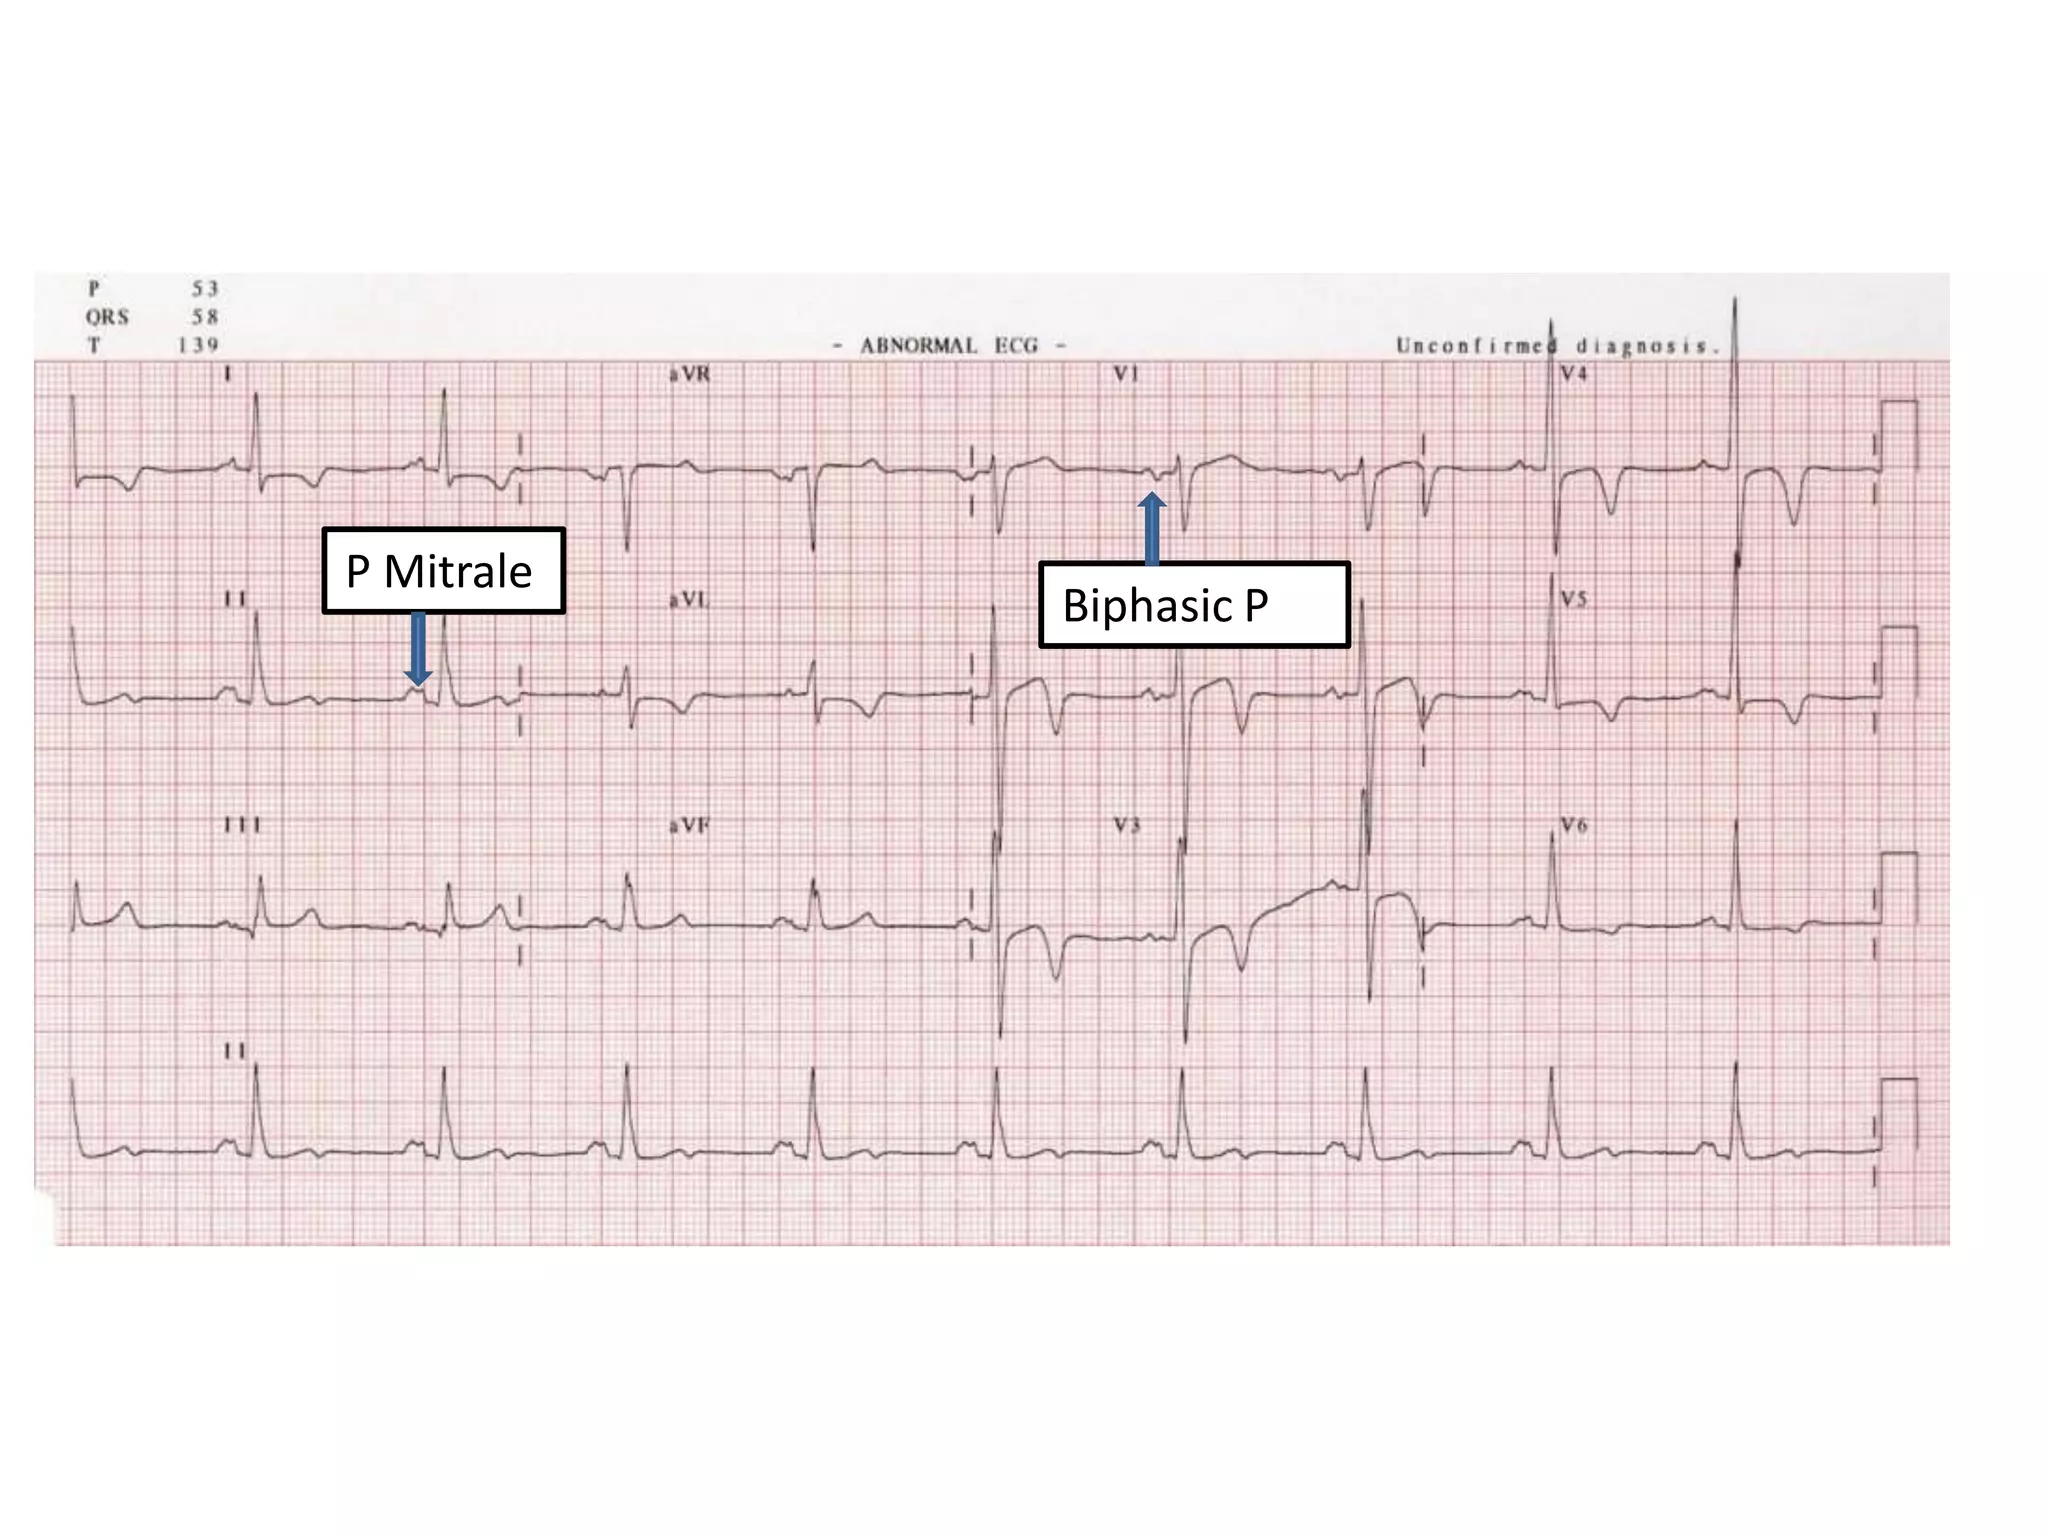
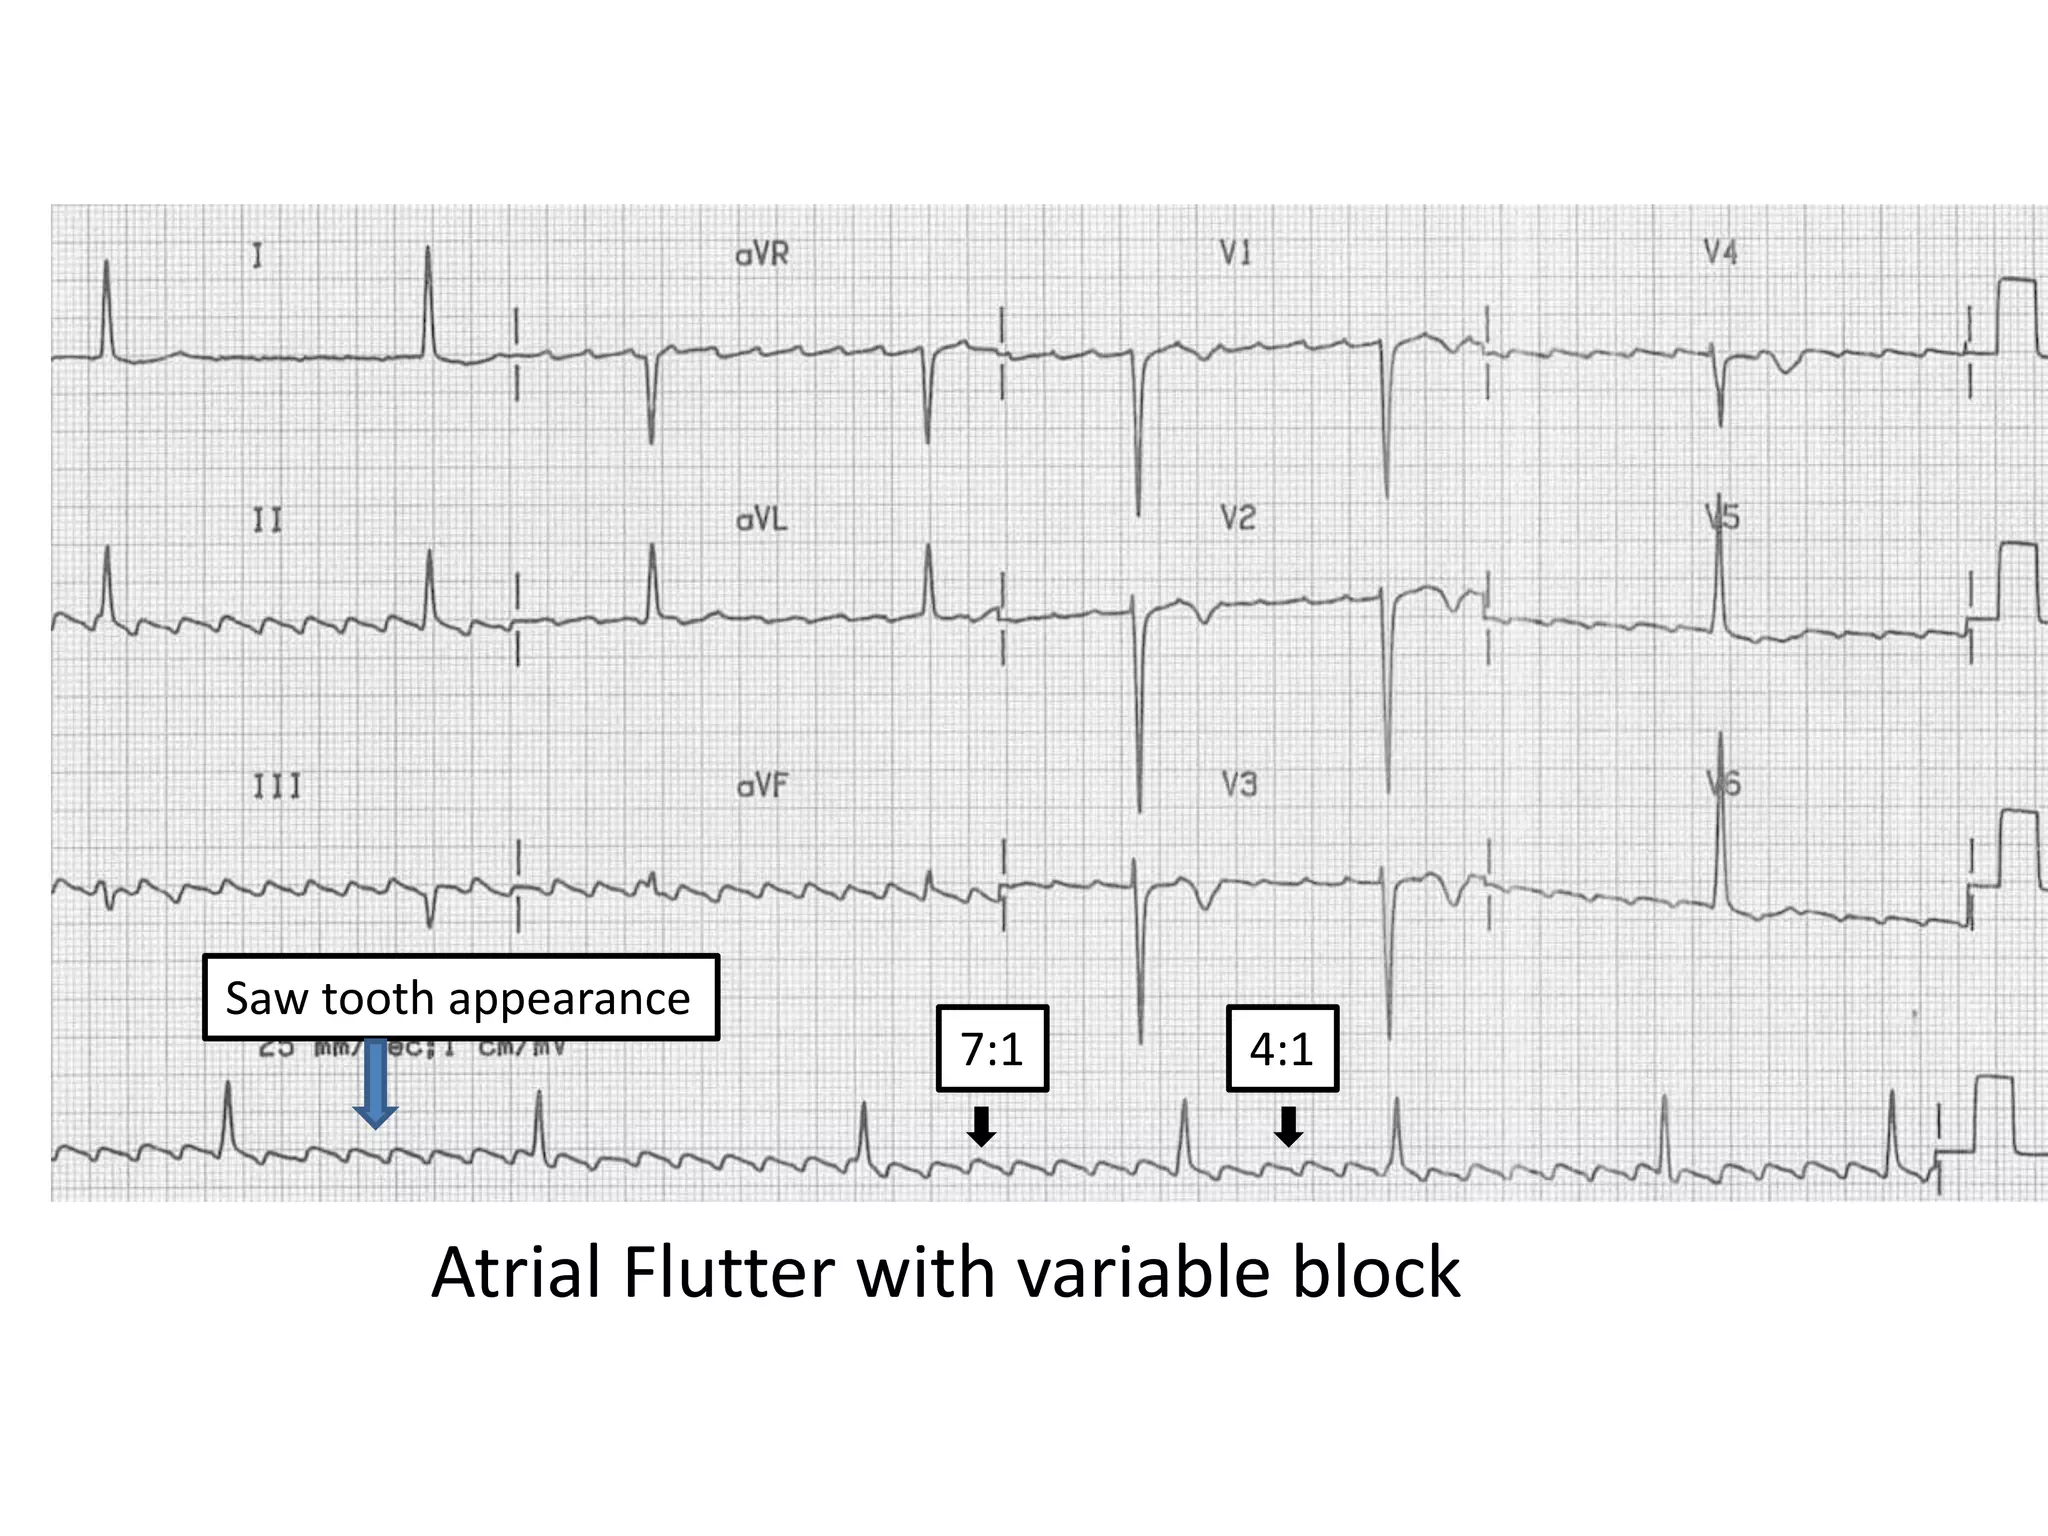
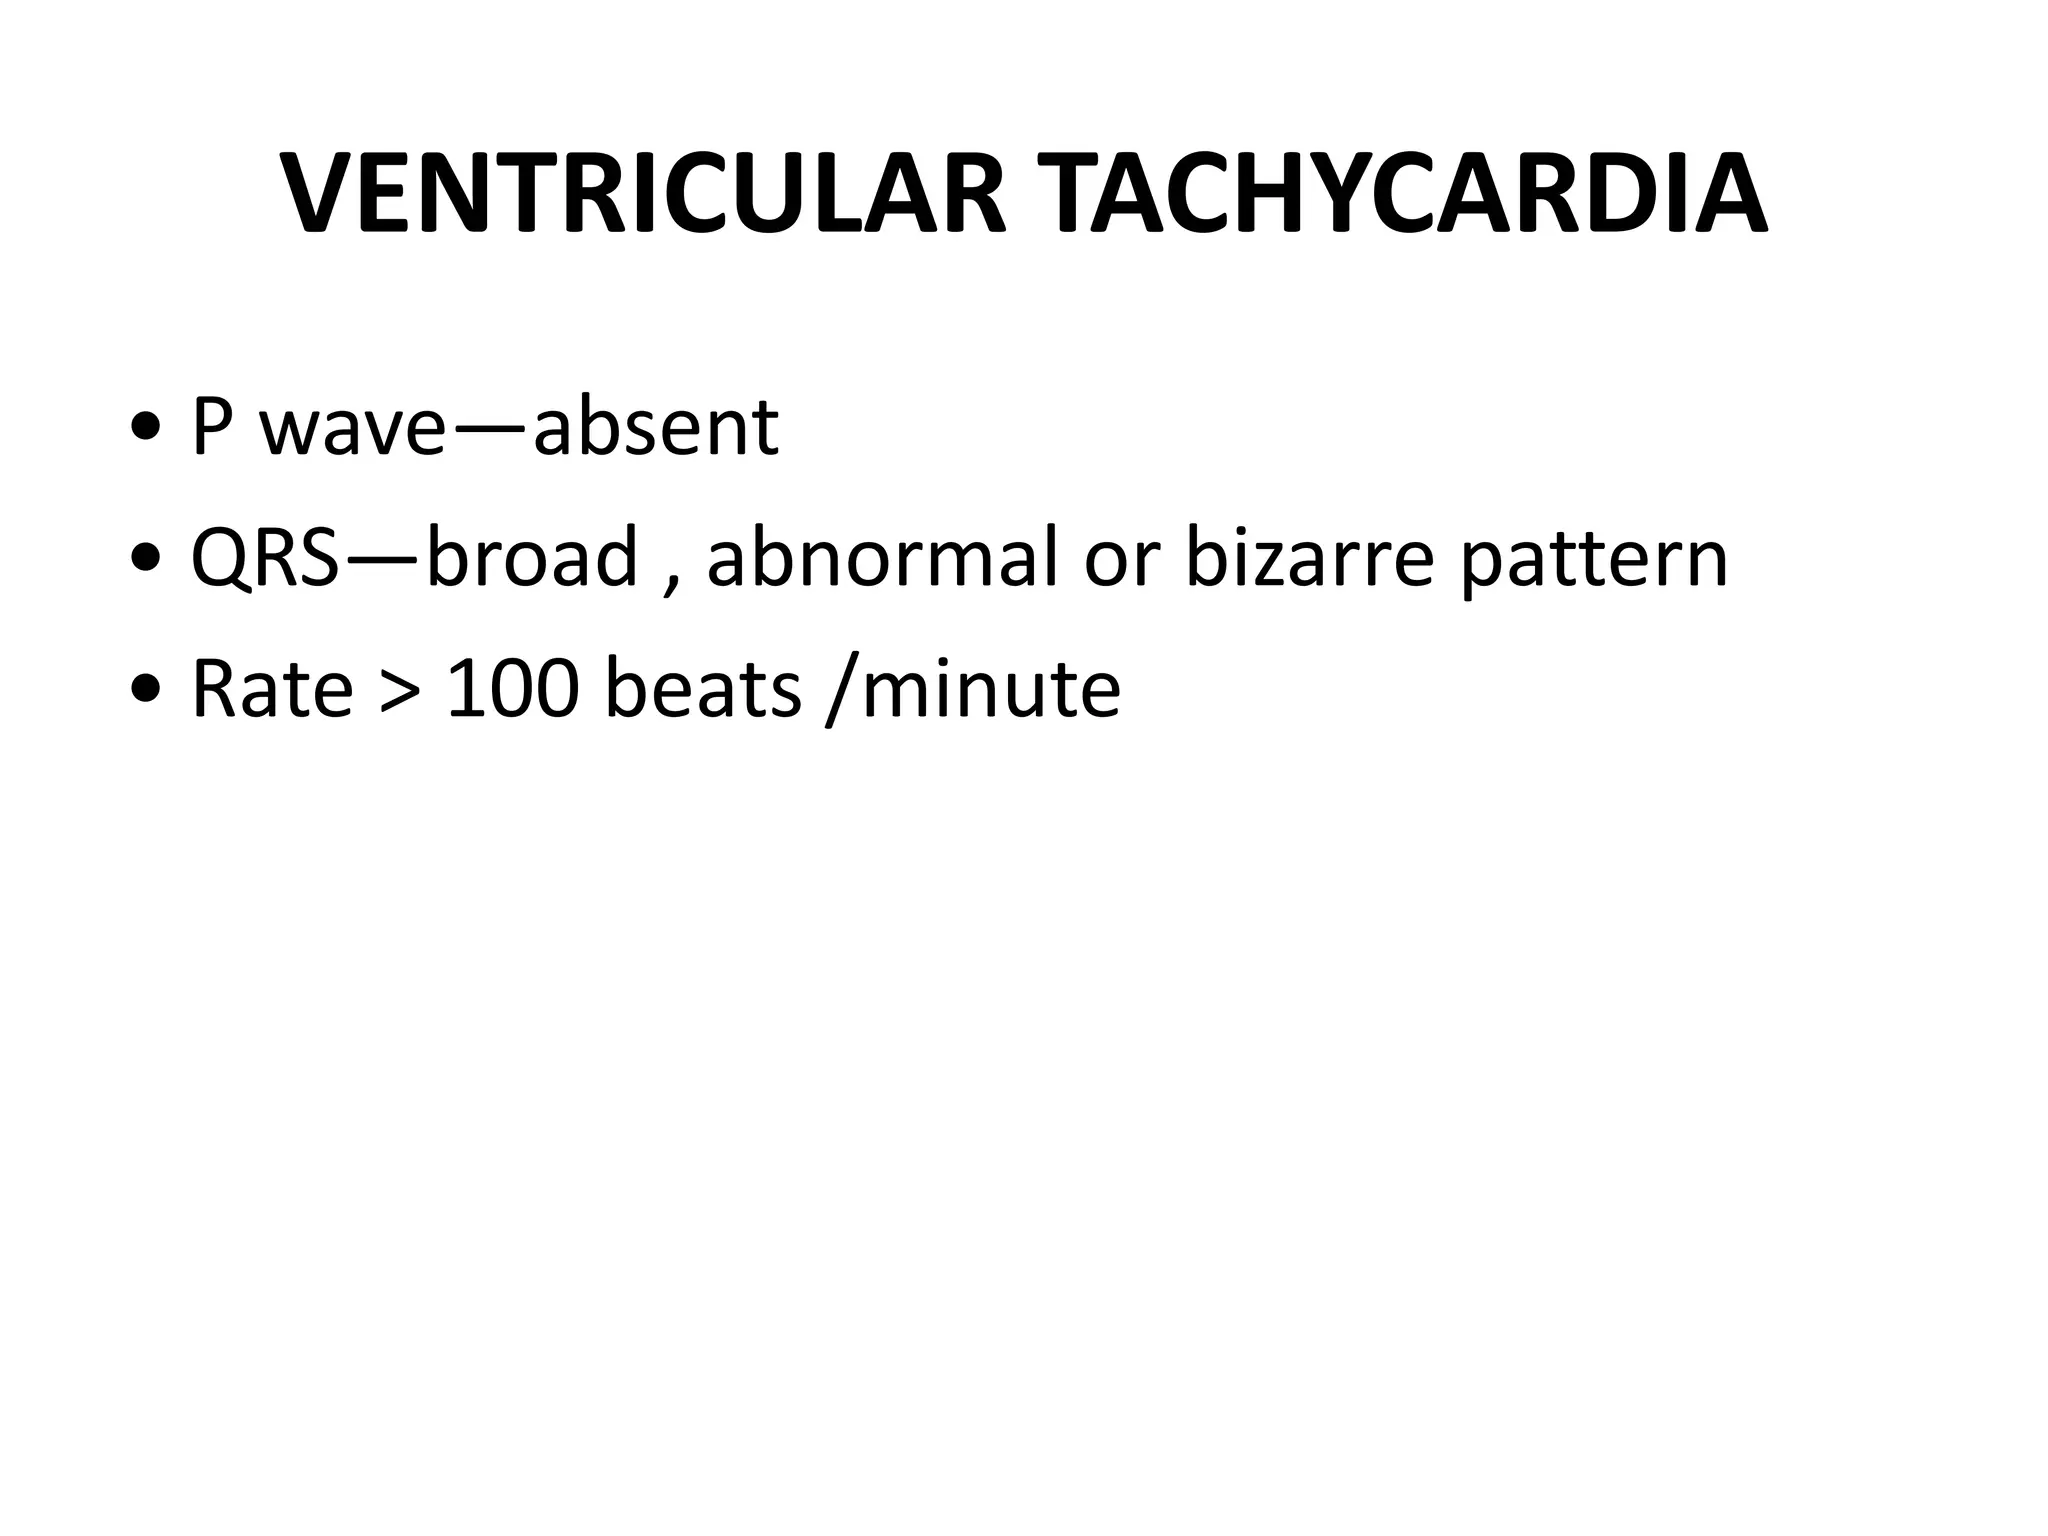
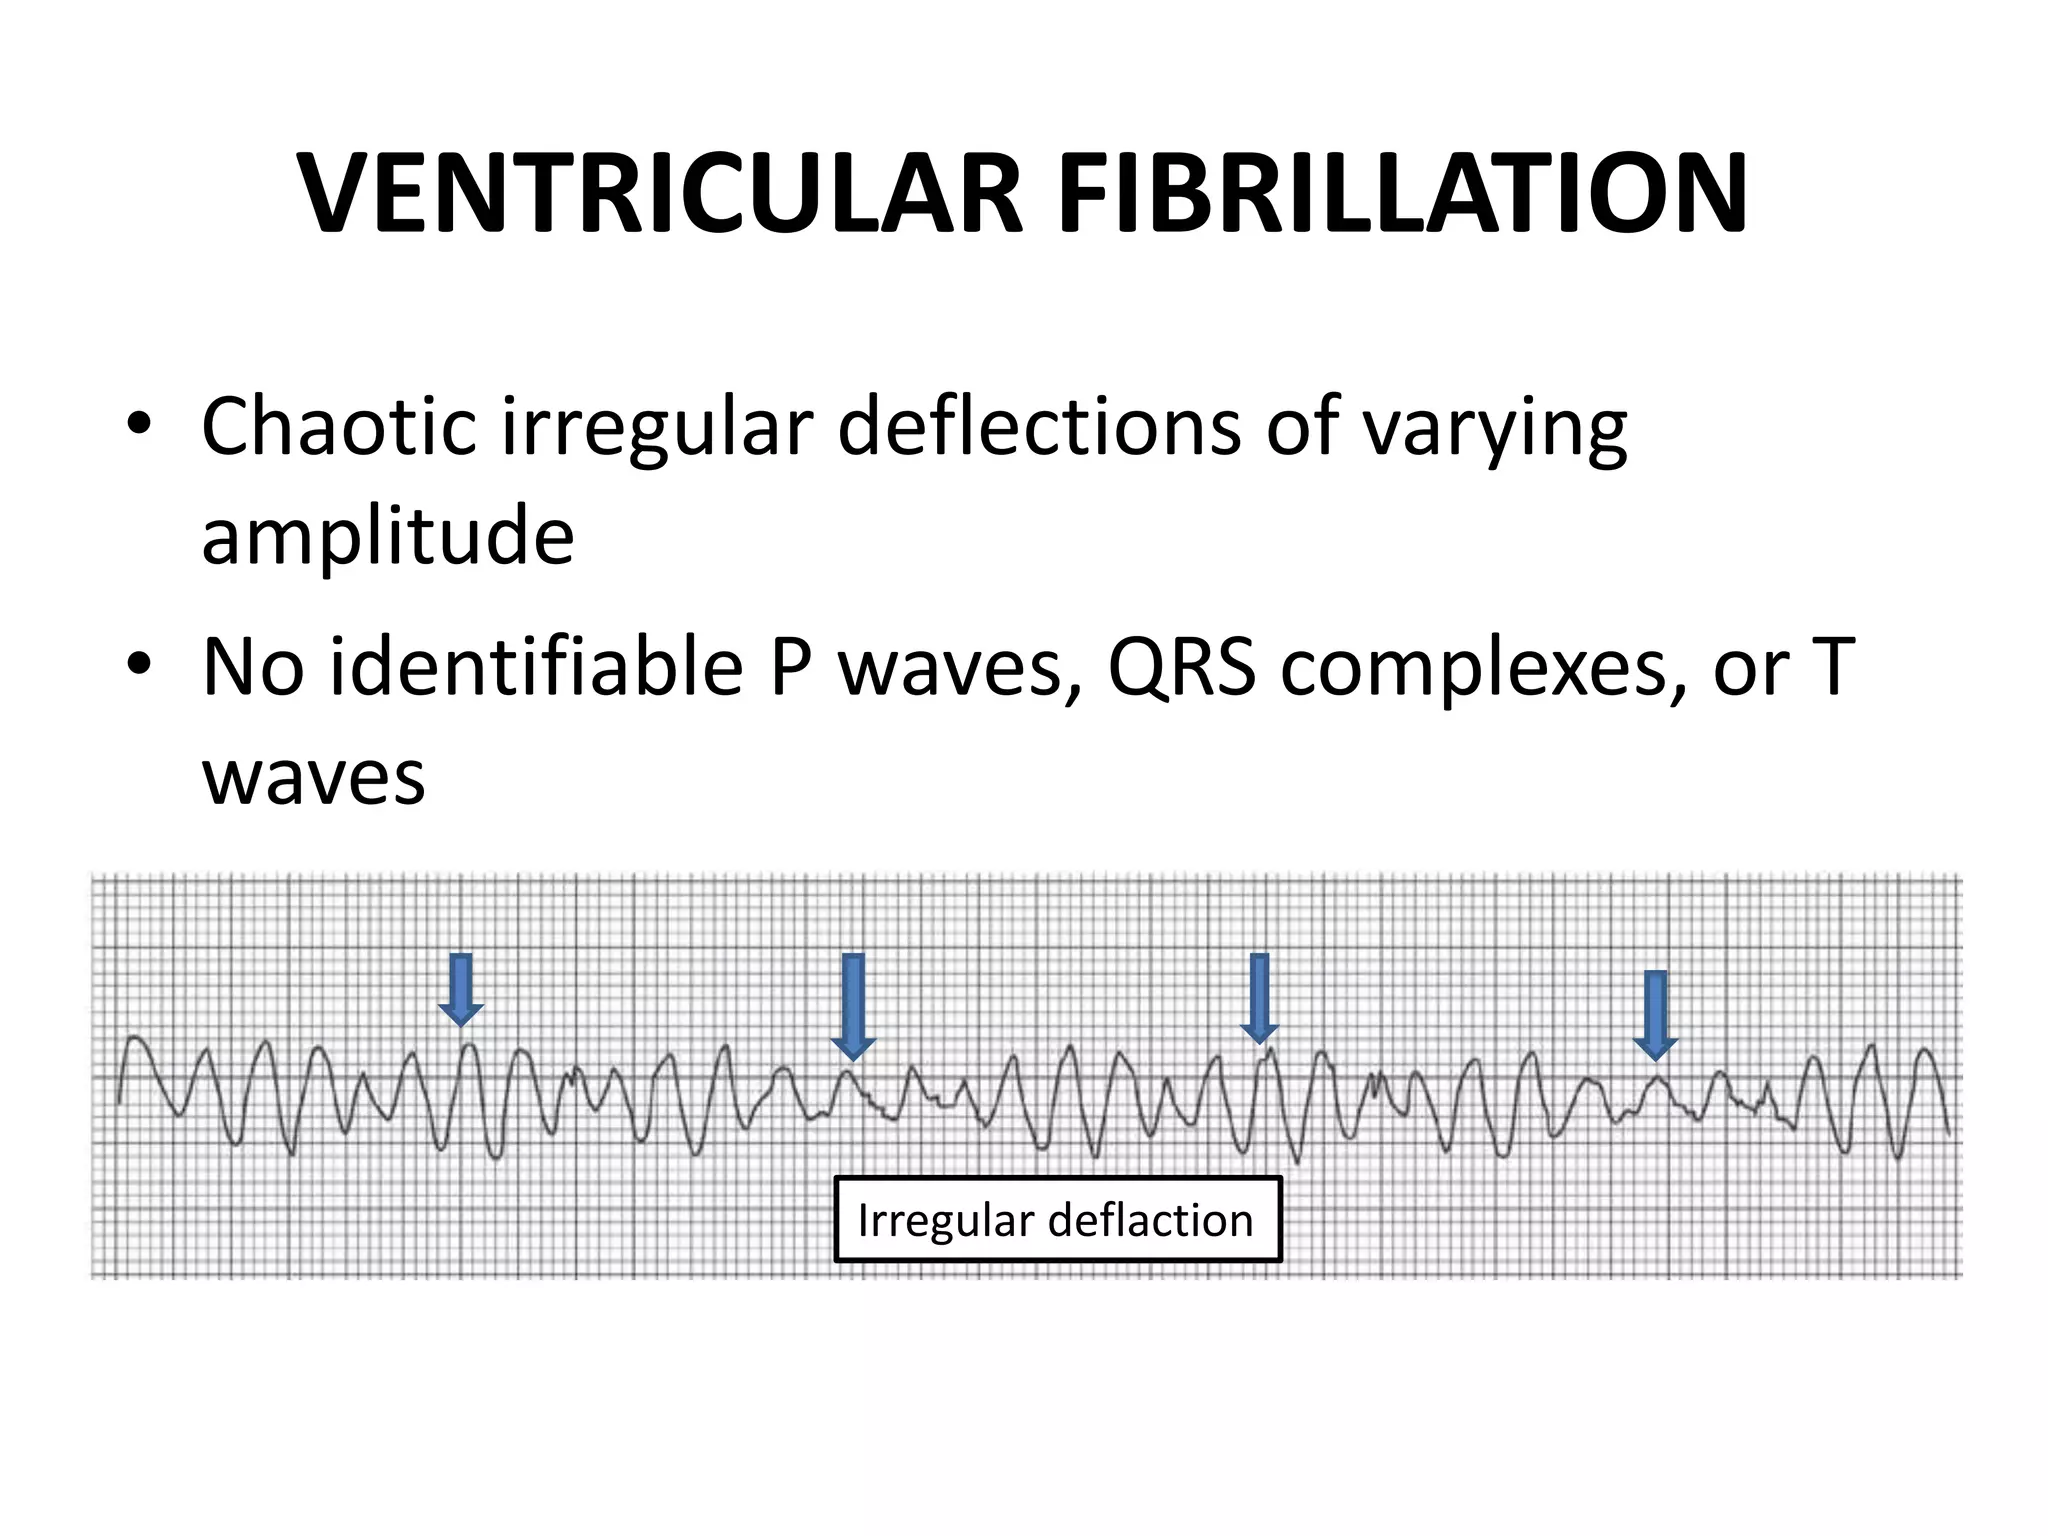
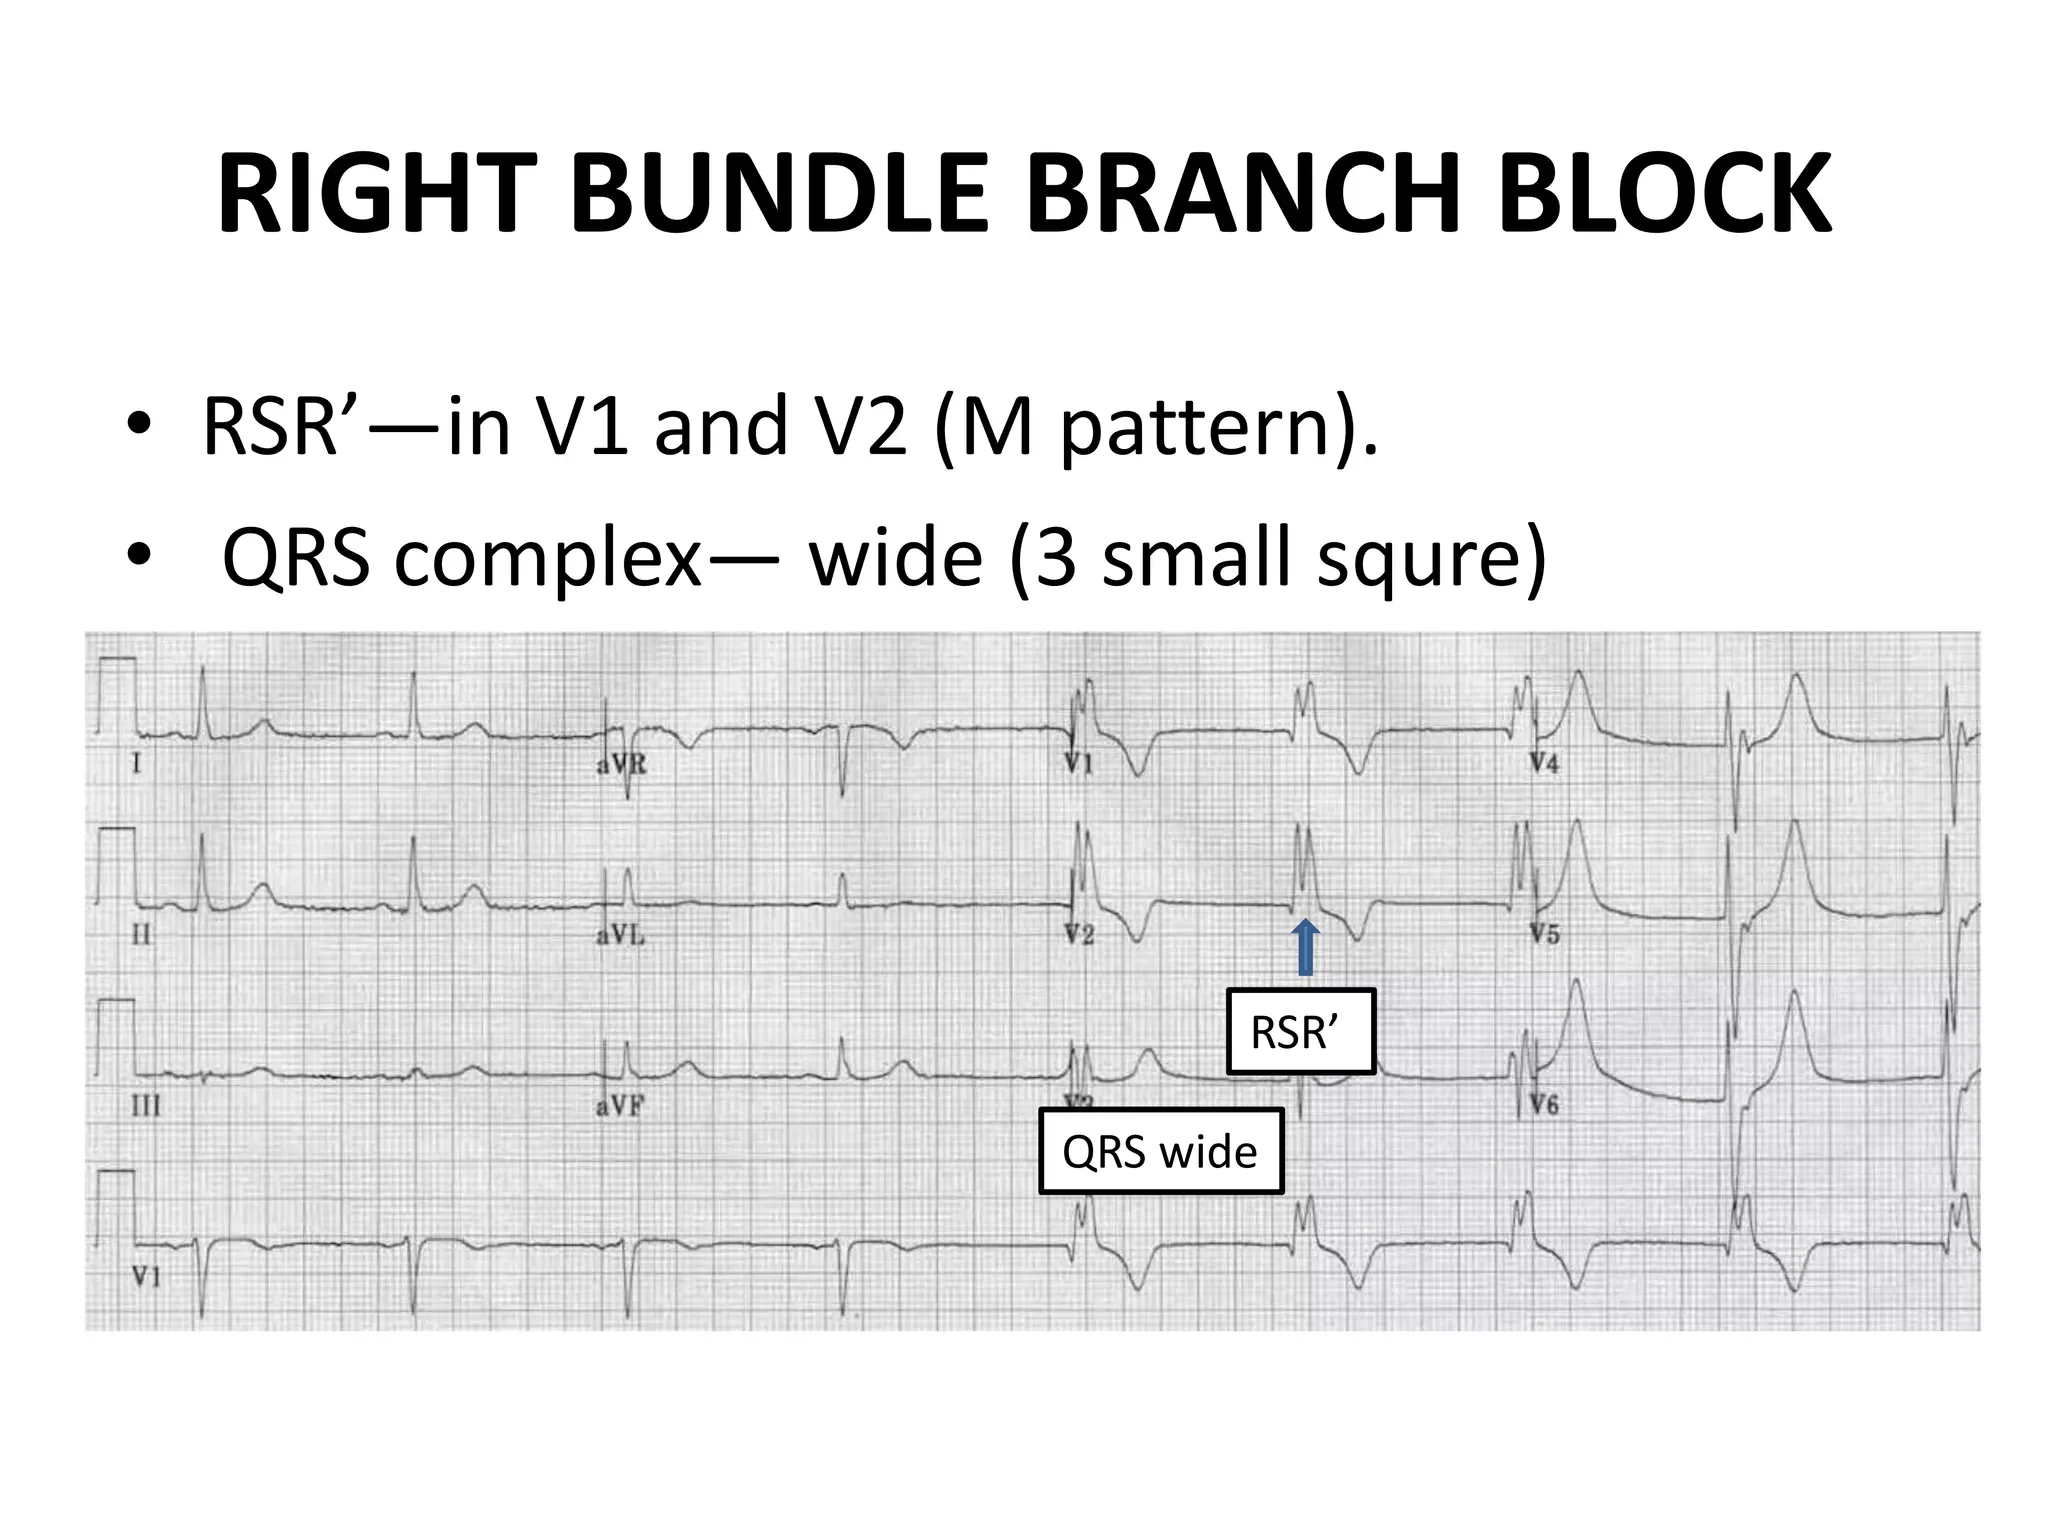
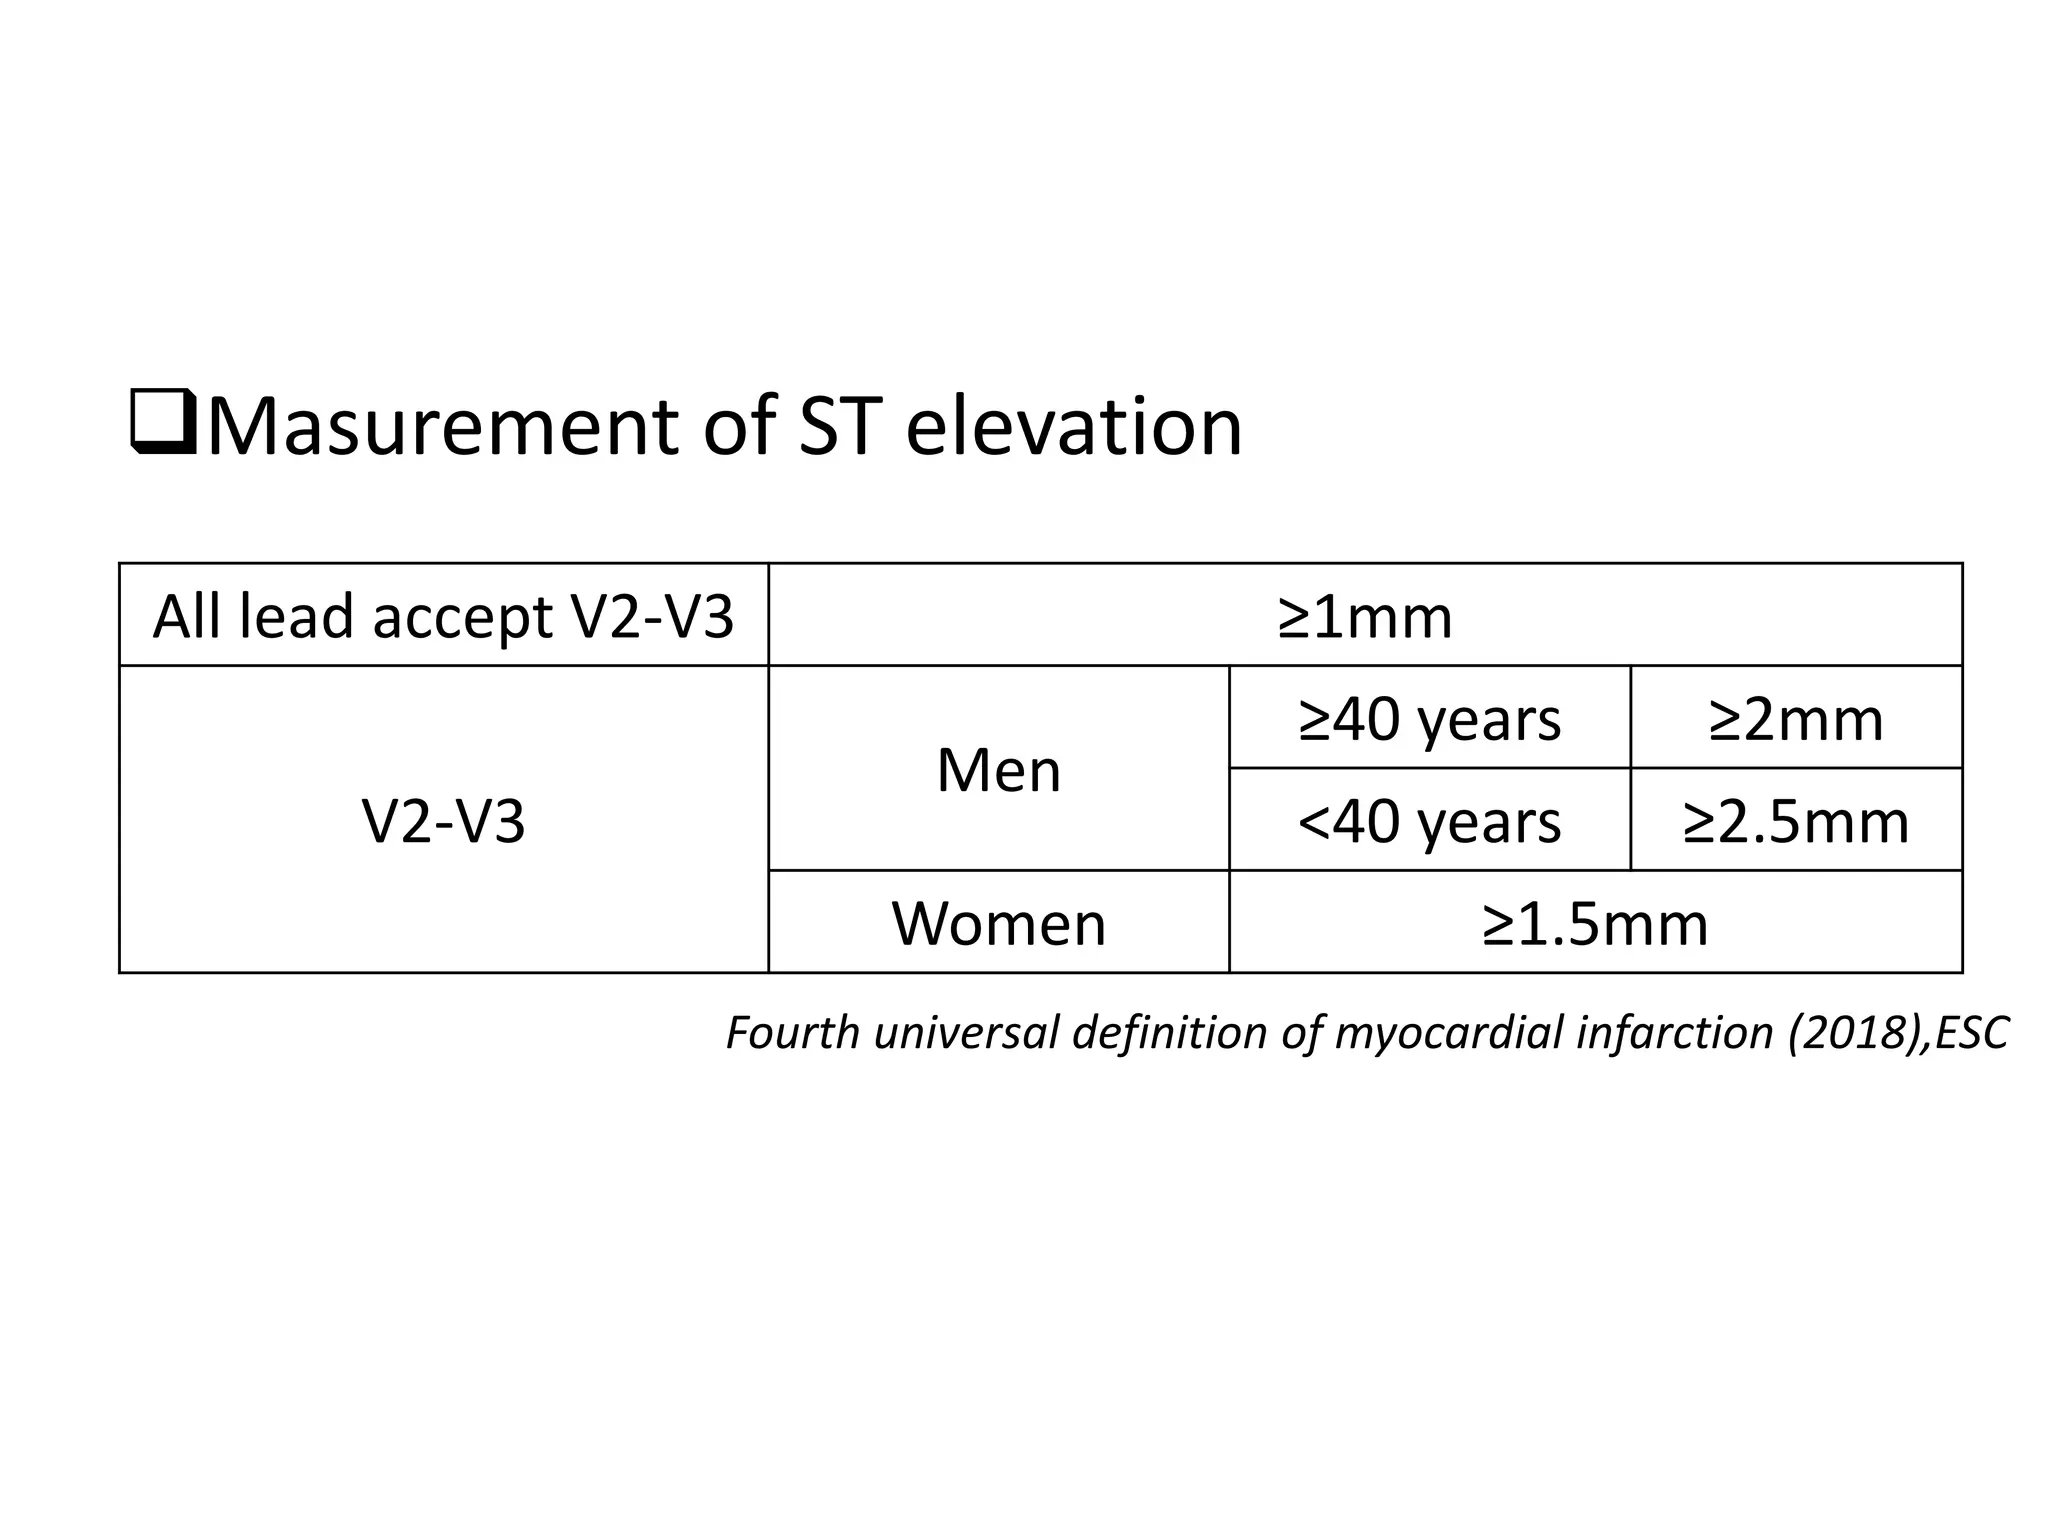
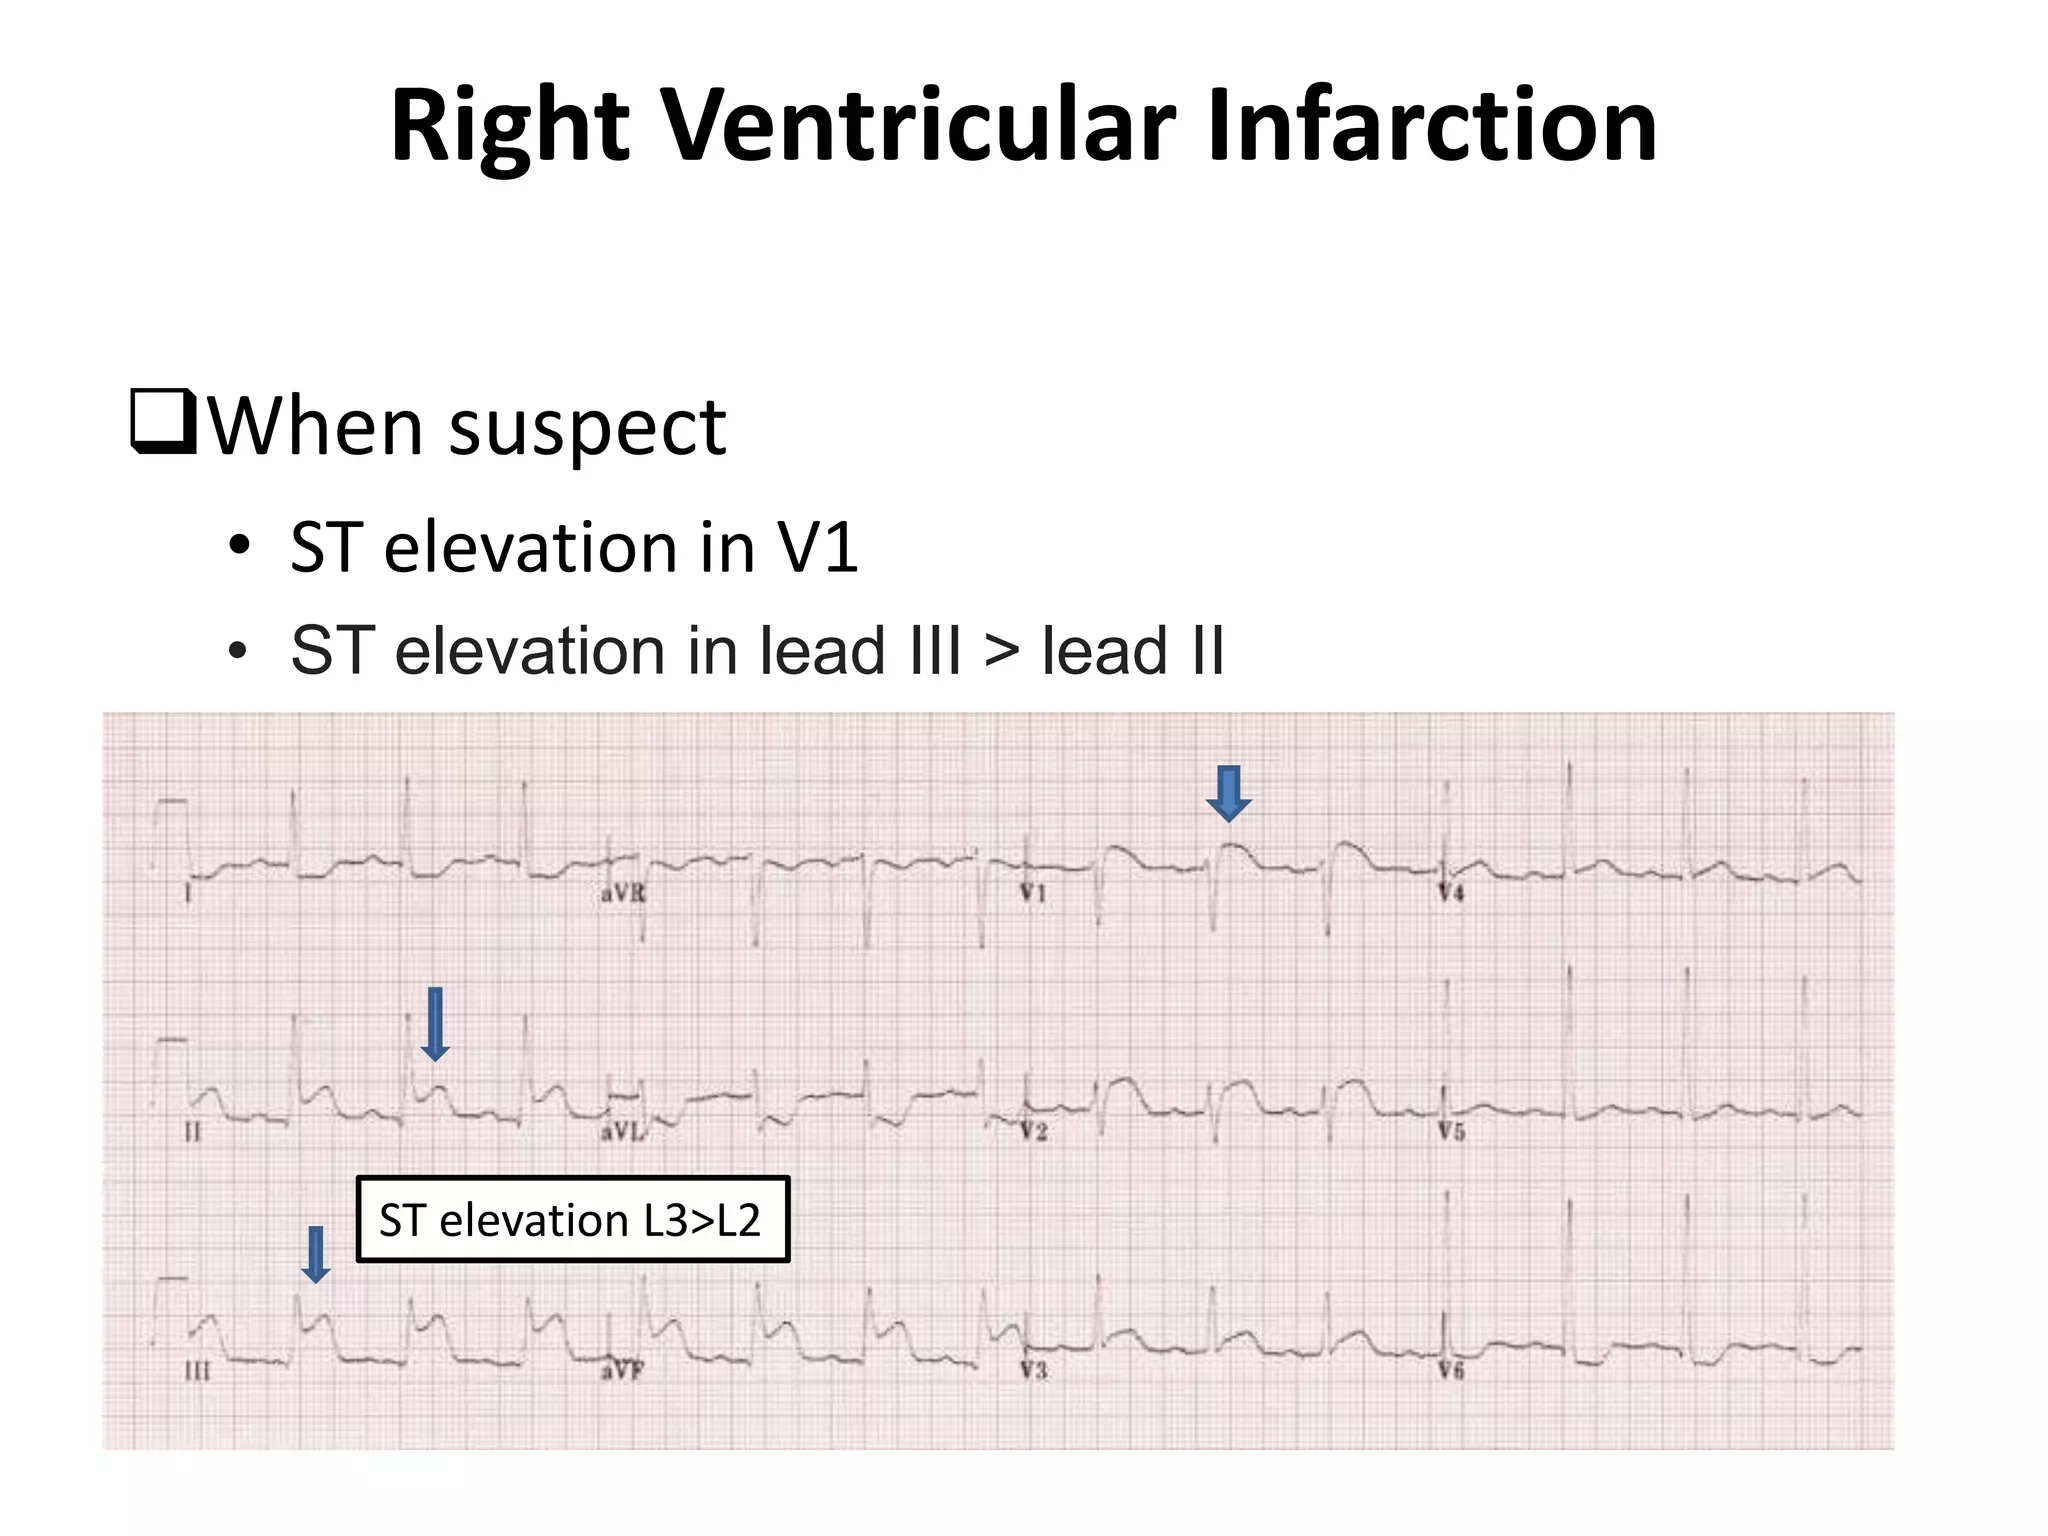
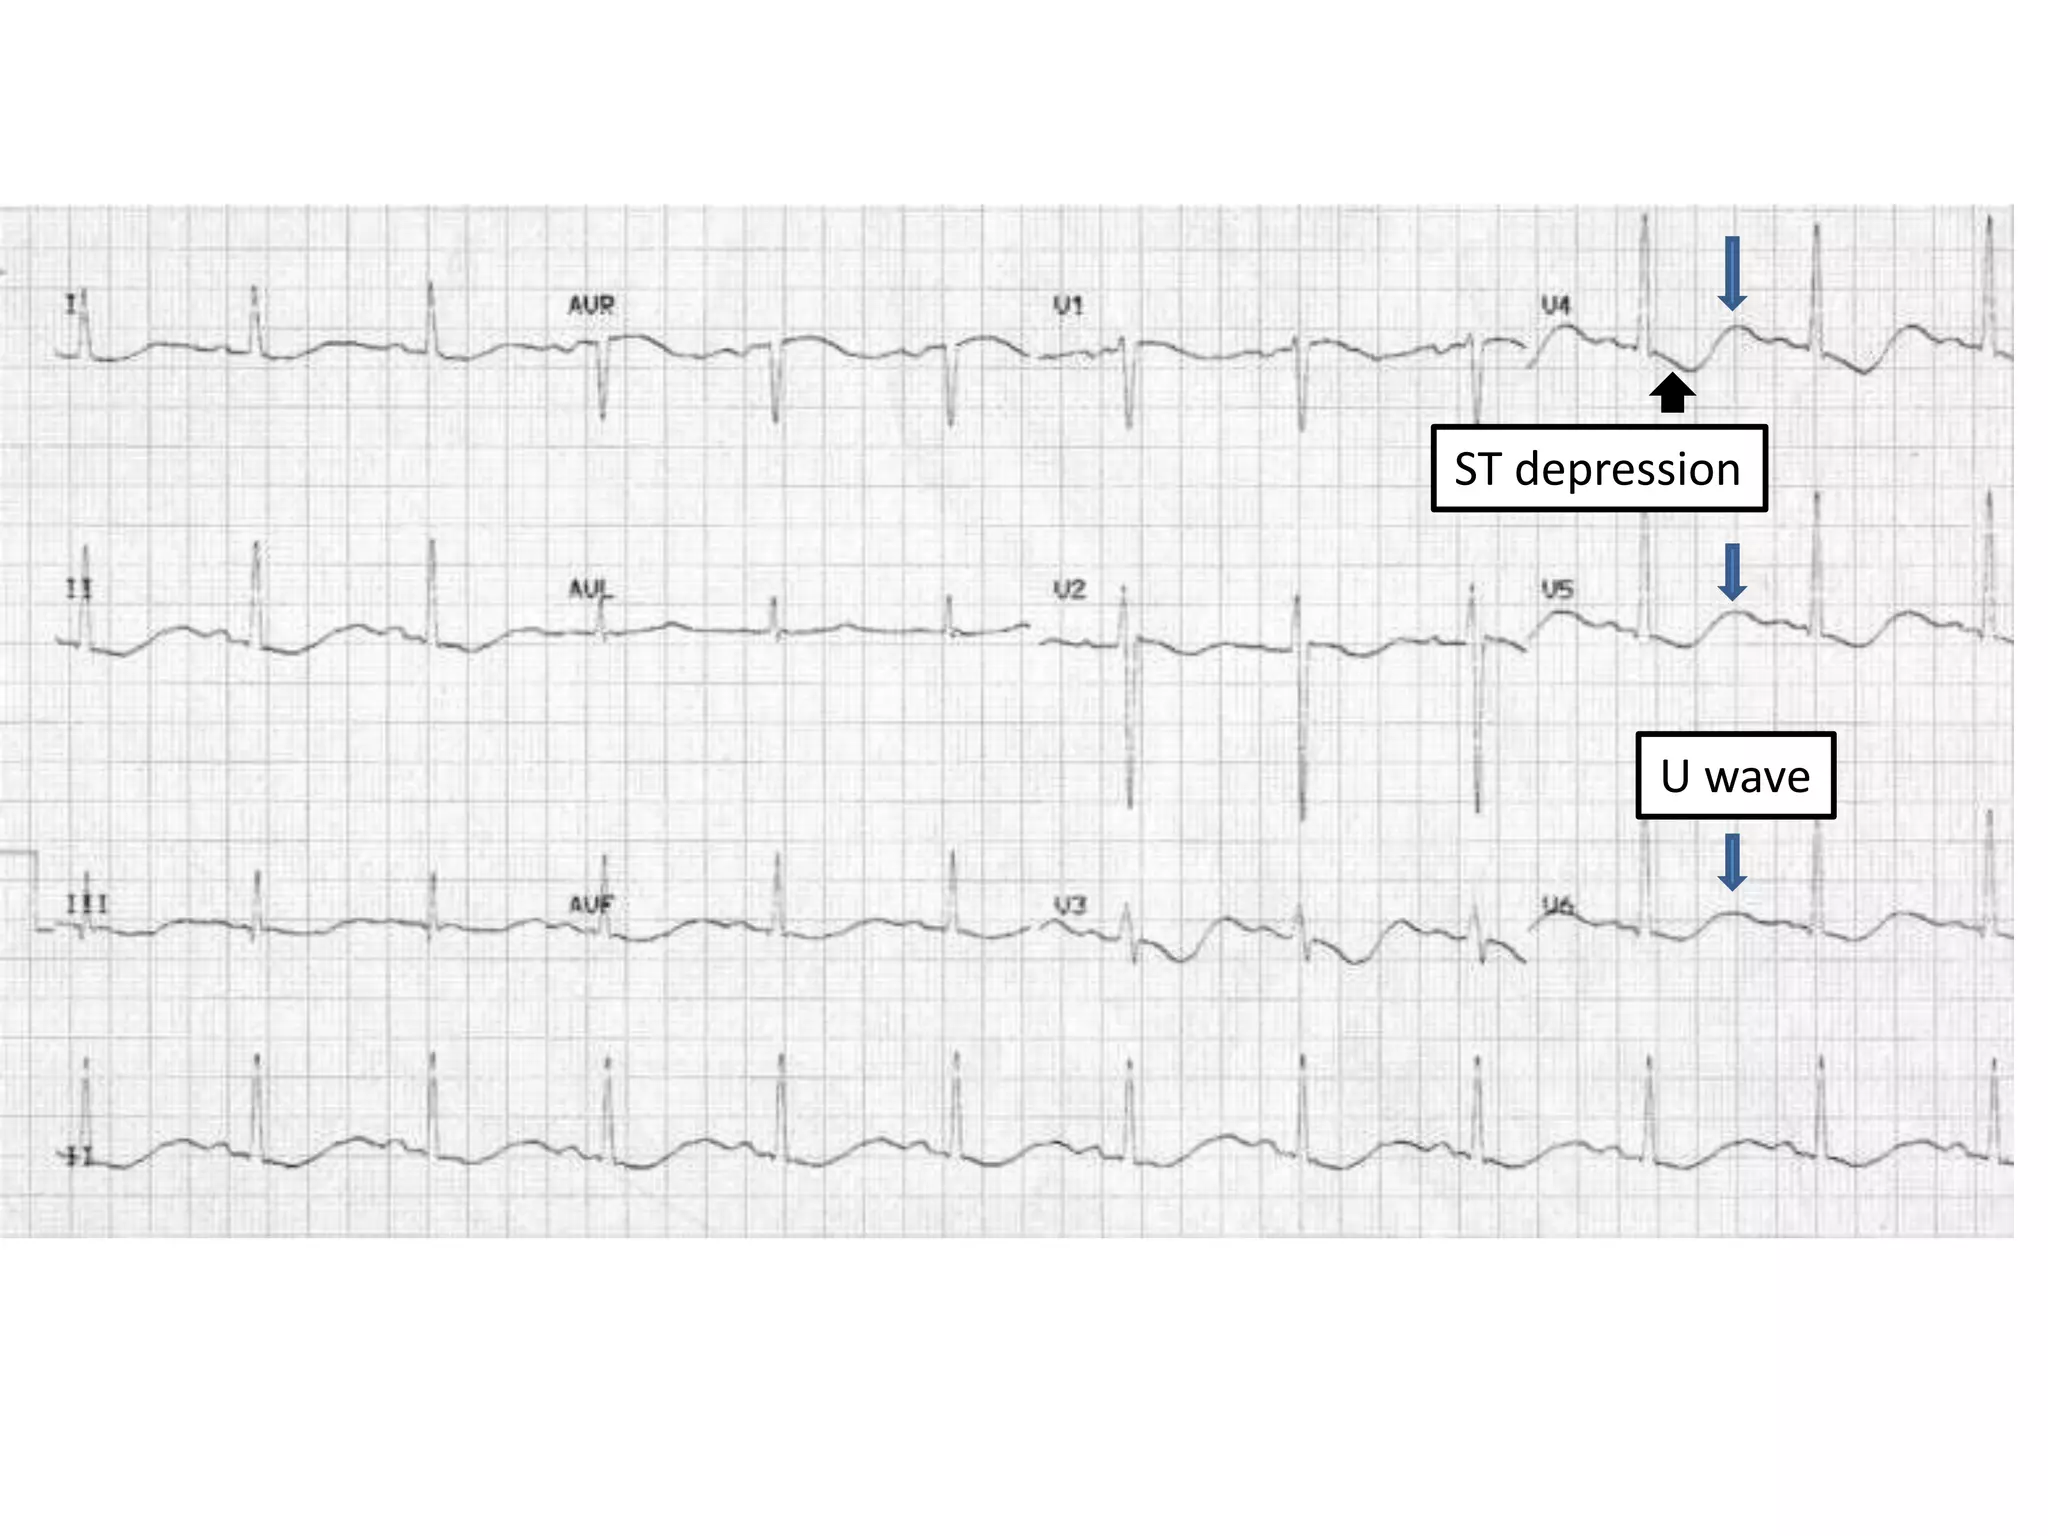
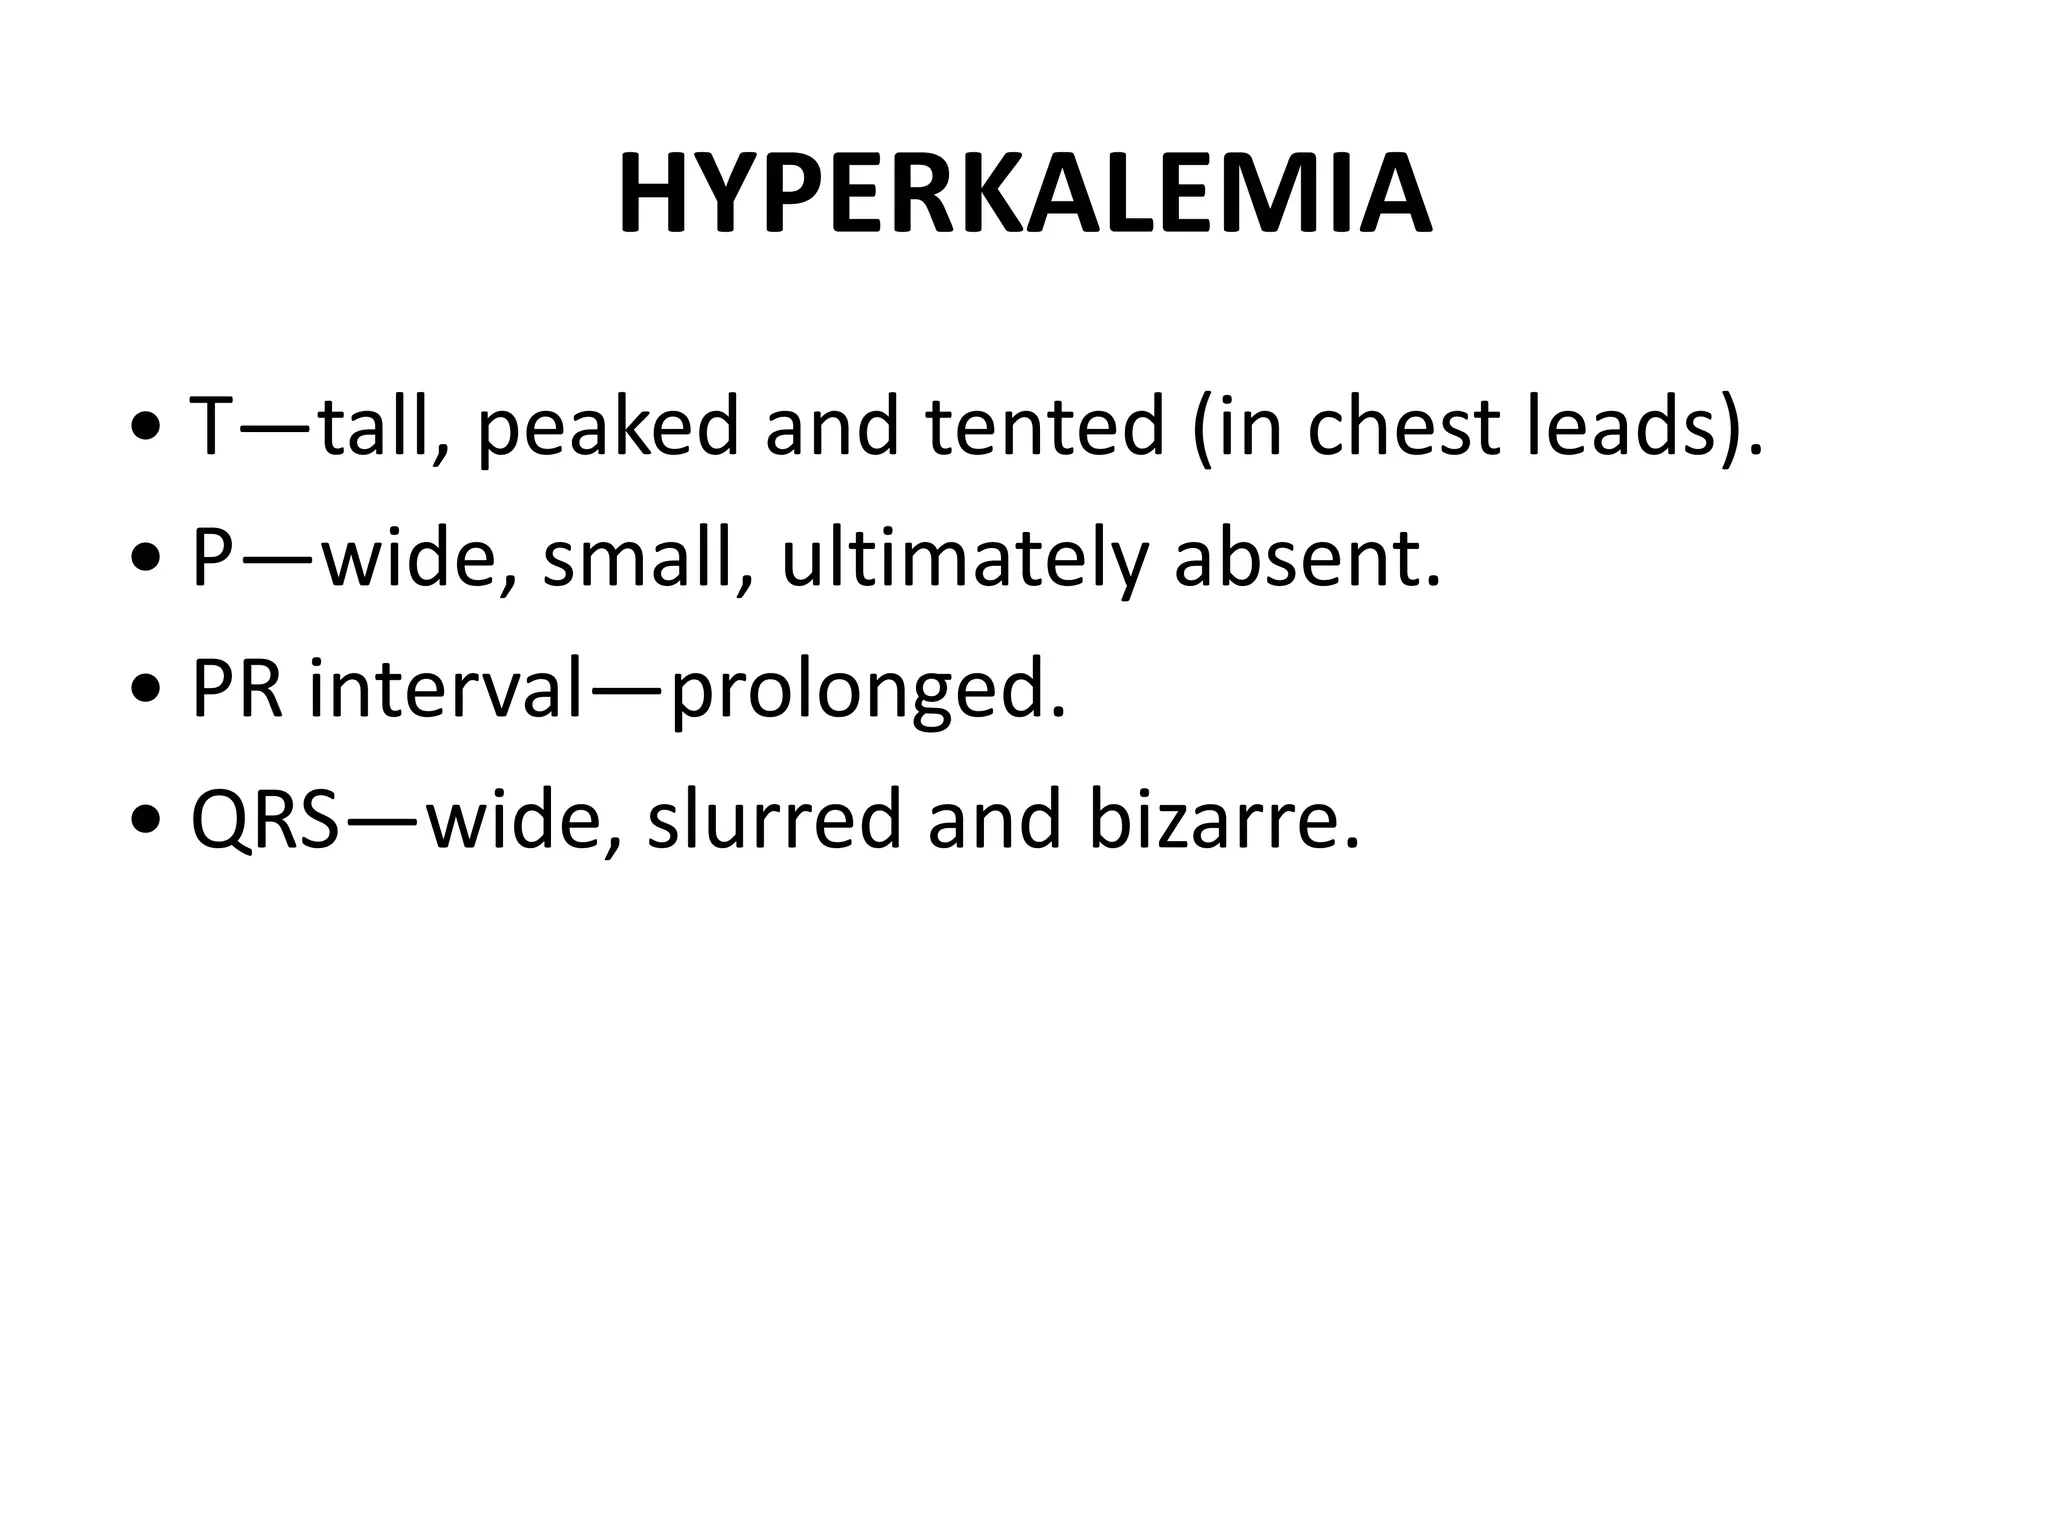
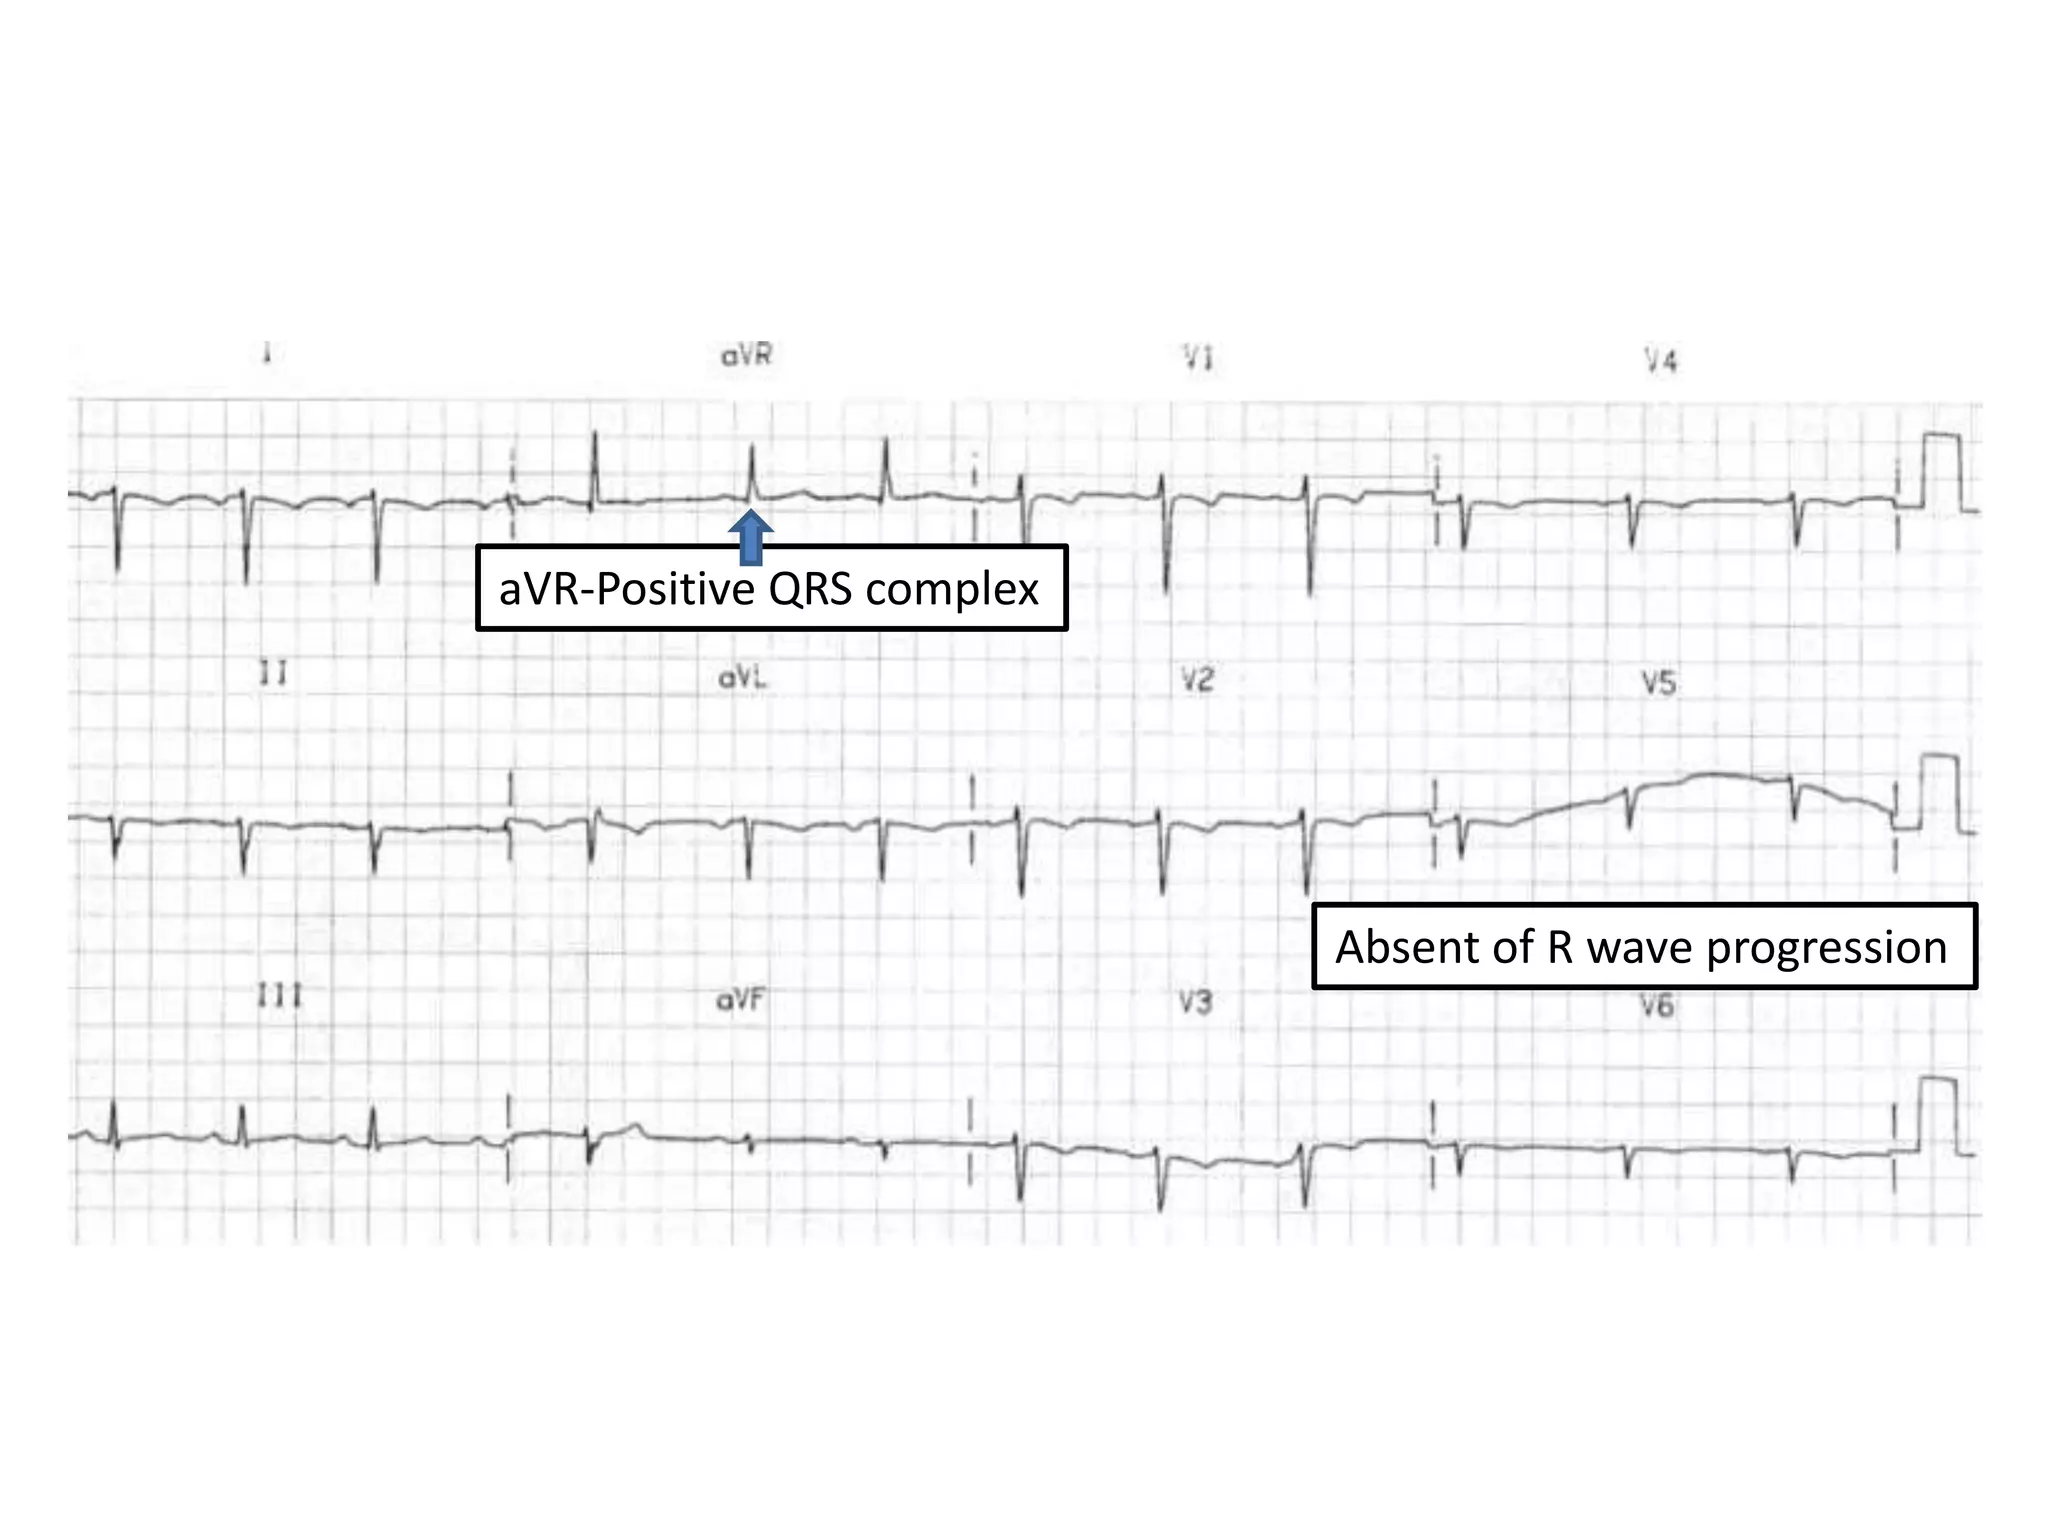
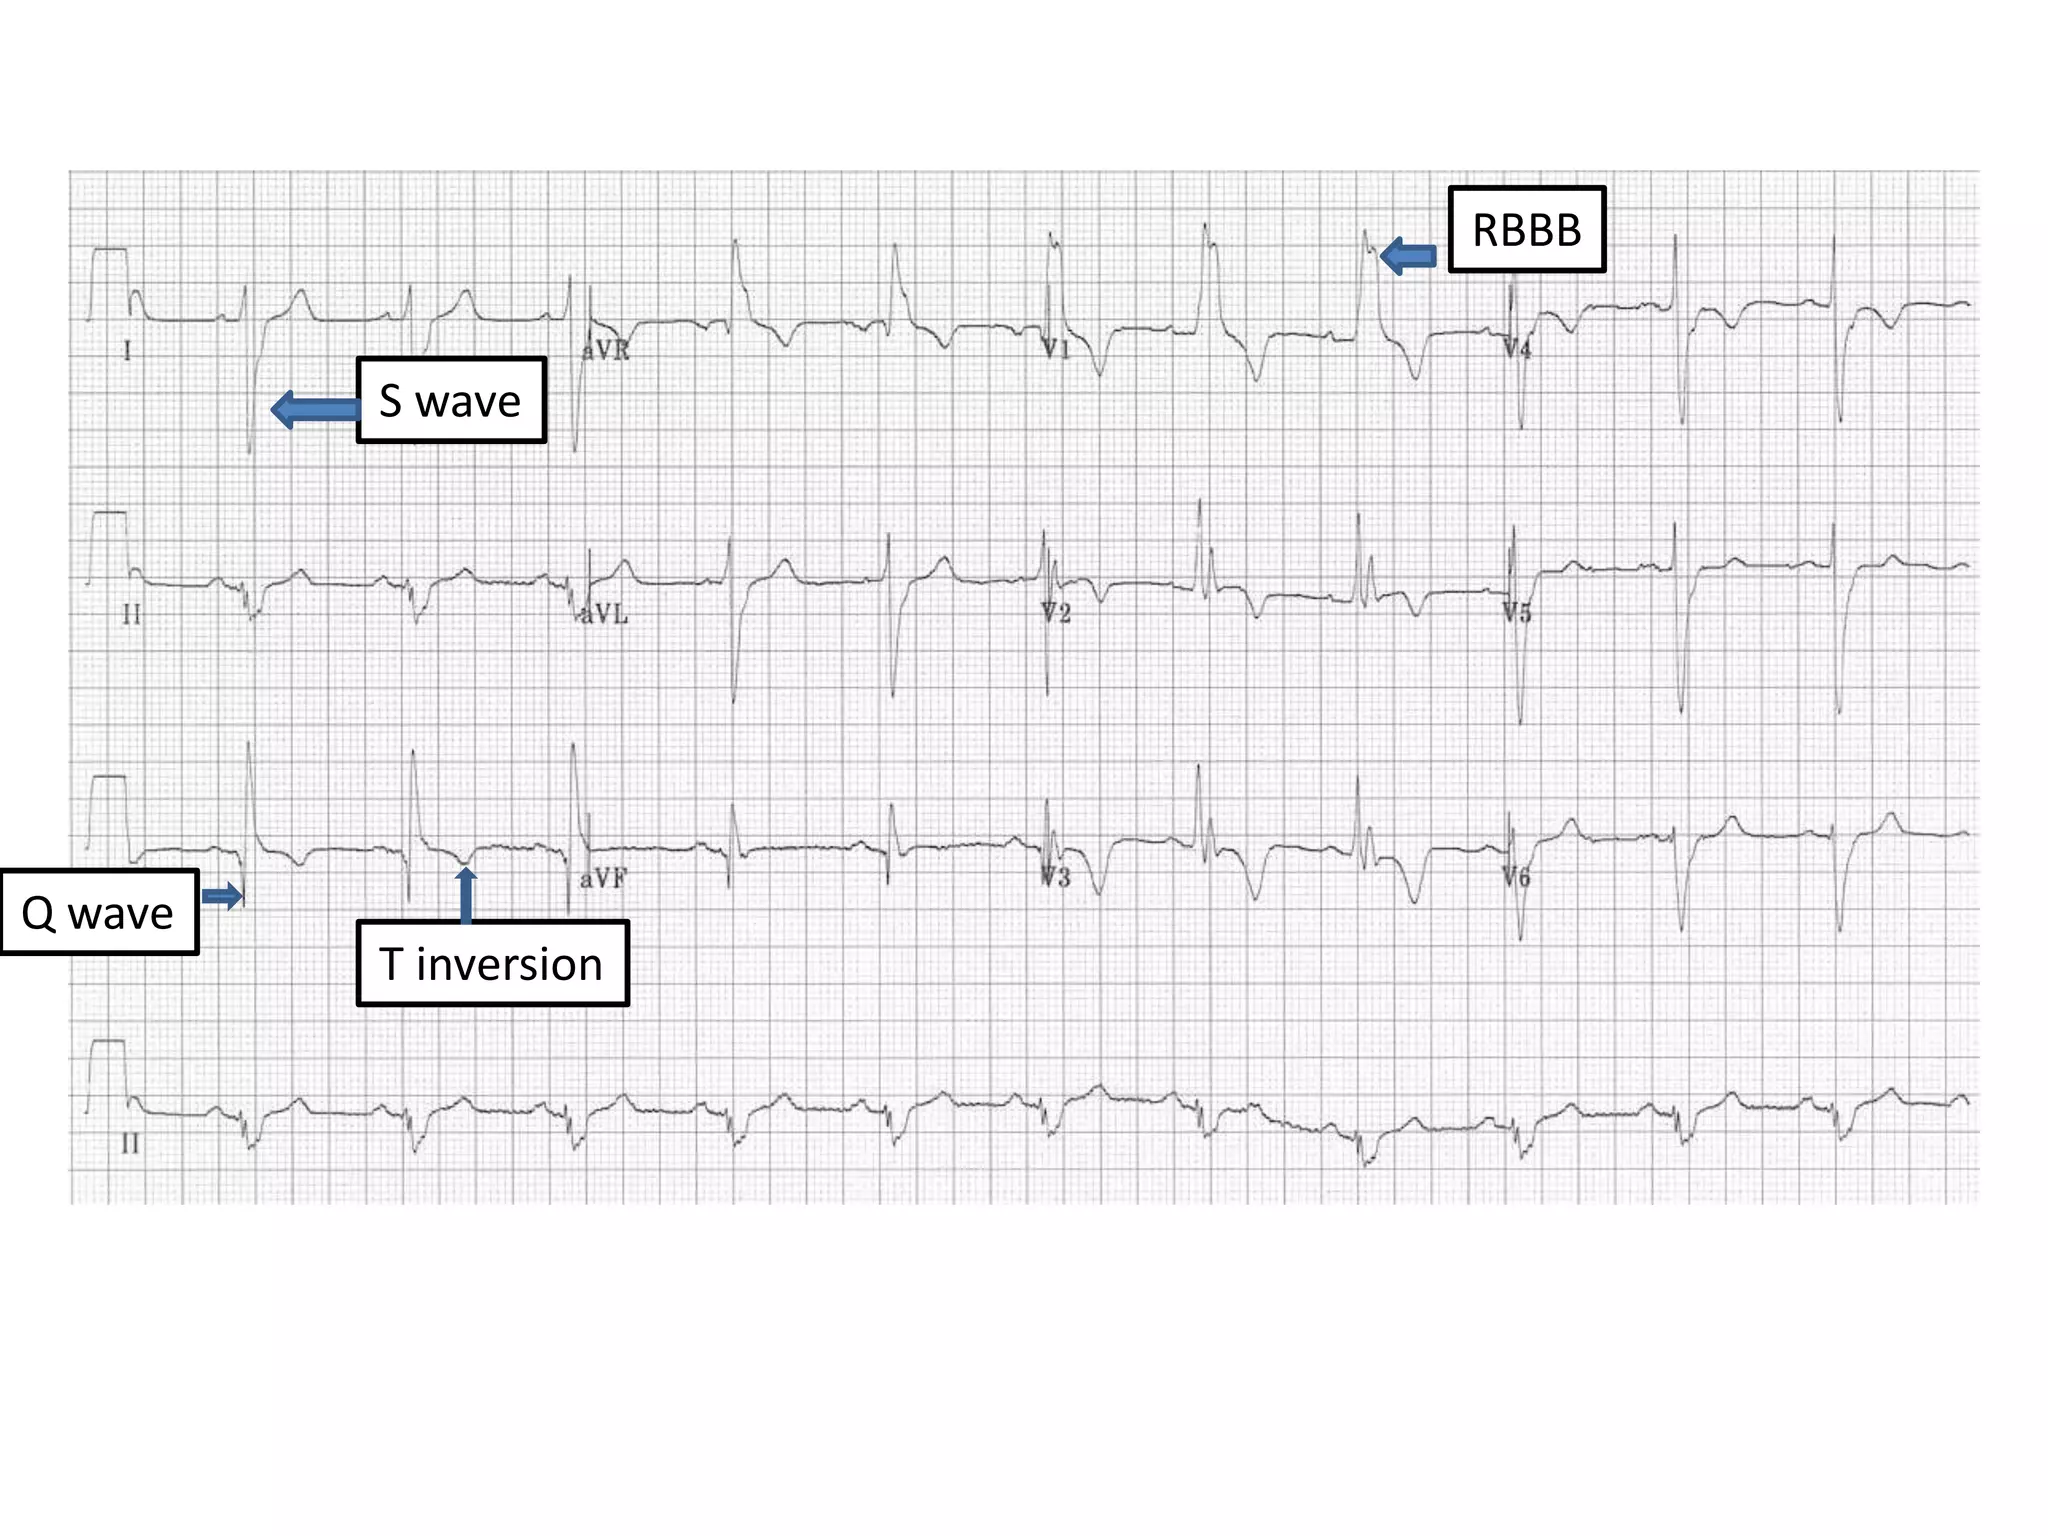
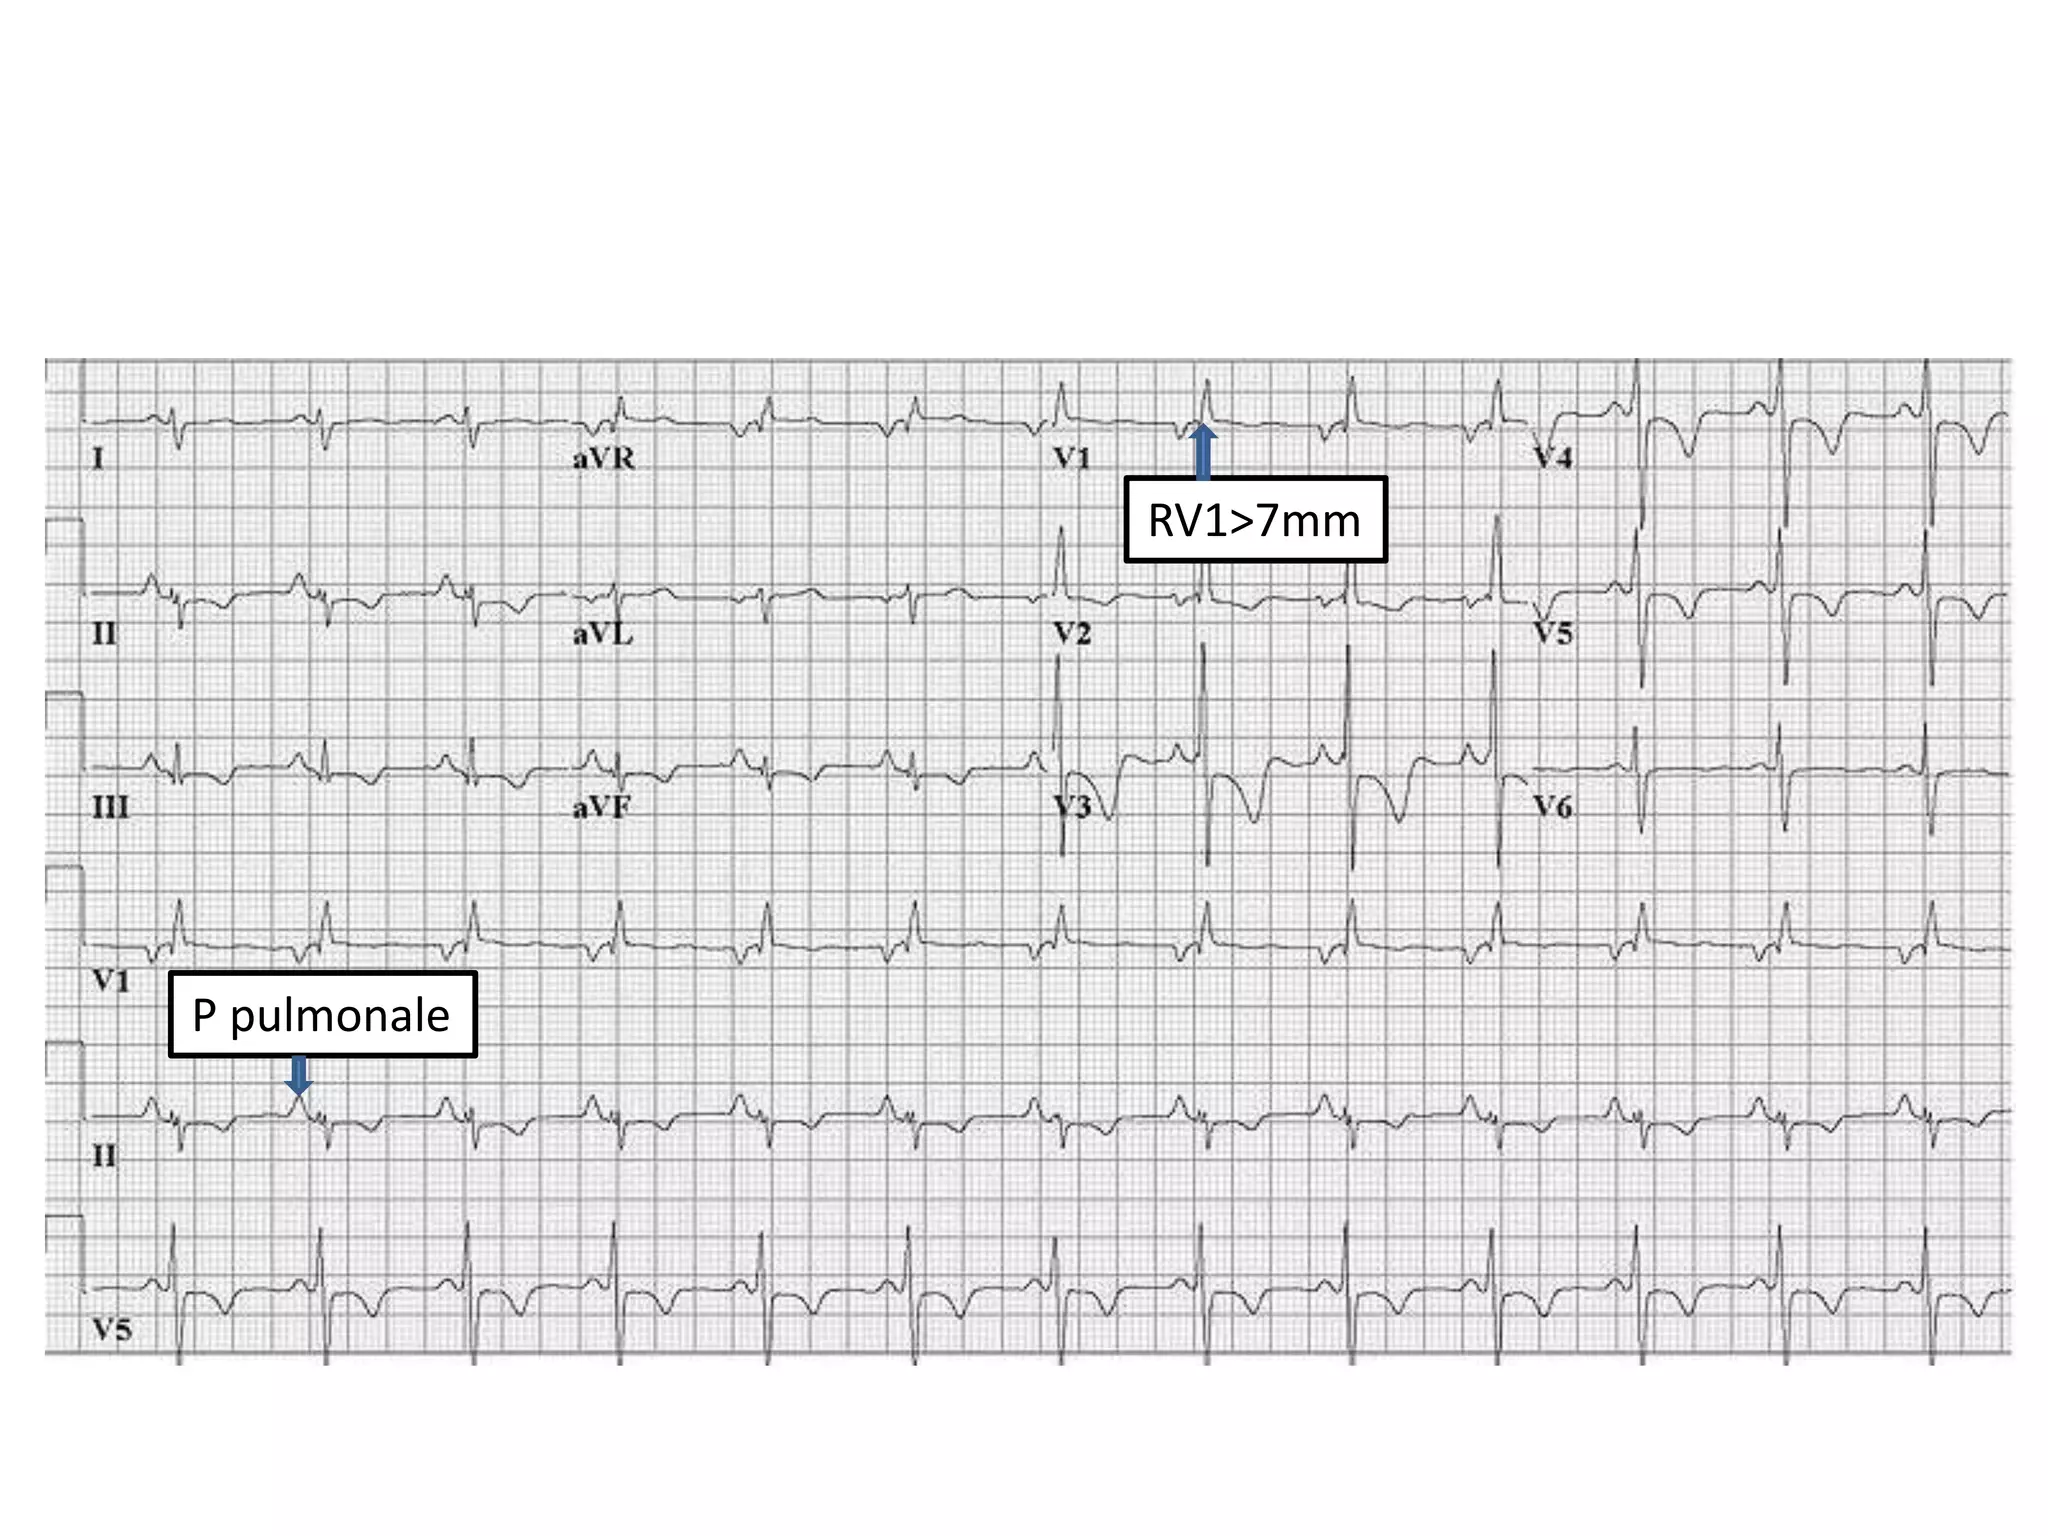
3. Common abnormalities seen in ECGs such as arrhythmias, conduction blocks, ventricular hypertrophy and myocardial infarction.
2. CONDUCTIVE SYSTEM
There are 5 specialized tissues called conductive
system of the heart. These are:
• SA node.
• AV node.
• Bundle of His.
• Right bundle branch (RBB) and left bundle branch
(LBB).
• Purkinje fibers.
4. ELECTROCARDIOGRAM
• It is the graphical representation of electrical
potentials produced when the electric current
passes through the heart.
• Electrical activity is the basic characteristic of
heart and is the stimulus for cardiac
contraction
5.
6. P wave Atrial depolarization.
PR interval
The time taken for the cardiac
impulse to spread over the atrium
and through AV node and His-
Purkinje system
QRS Complex Ventricular depolarization.
T wave Ventricular repolarization.
7. Waves of ECG
P wave
Height ≤2.5mm
Width ≤2.5mm
Q wave
Depth <2mm
Width <1mm
R wave
aVL <13mm
aVF <20mm
V5,V6 <25mm
QRS complex Width <3mm
T wave
Standard lead ≤5mm
Chest lead ≤10mm
8. Intervals of ECG
PR interval 0.12 to 0.20 sec (3- 5mm)
QT interval 0.35 to 0.43 seconds
9. In a normal ECG recording, there are 12 leads:
• 3 bipolar standard leads (LI, LII, LIII )
• 3 unipolar limb leads (aVR, aVL, aVF)
• 6 chest leads (V1, V2, V3, V4, V5, V6)
10. VIEW OF THE HEART IN ALL LEADS
V1 and V2 Right ventricle
V3 and V4 Interventricular septum
V5 and V6 Left ventricle
V1 to V6 Anterior aspect of heart
LI, aVL, V1 to V6
Extensive anterior aspect of
heart or anterolateral
LI, aVL, V5 and V6 Lateral
LI and aVL High lateral
LII, LIII and aVF Inferior aspect of heart
12. SYSTEMATIC APPROACH IN ECG
INTERPRETATION
•Rate—what is the rate ?
• Rhythm—regular or irregular, regularly followed by
occasional irregular.
• Characters of individual waves (P, PR, Q, R, QRS, ST, T,
U).
• Specific pathological changes.
13. Heart Rate
When the cardiac rhythm is regular:
• If large square is calculated
• If small square is calculated:
14. When the rhythm is irregular:
1. Count the number of R in 30 large squares
2. Then simply multiply this by 10
15. RHYTHM OF HEART
• If the RR interval is equal, it is called regular rhythm.
• If the RR interval is irregular, then it is called irregular
rhythm
16. Causes of Irregular Rhythm
1. Physiological: Sinus arrhythmia.
2. Pathological:
• Atrial fibrillation.
• Atrial flutter.
• Ectopic beat.
• SA block or sinus arrest.
• Atrial tachycardia with block.
• Second degree heart block.
• Ventricular fibrillation.
17. CARDIAC AXIS
• Normal axis is between –30° to +90°
Tall R in both LI andLII Axis is normal
Tall R in LI and deep S in LII Left axis deviation
Tall R in LII and deep S in LI Right axis deviation
18. LOW VOLTAGE ECG
Normal standardization 10 mm in height
CRITERIA OF LOW VOLTAGE TRACING
• In standard limb leads—QRS < 5 mm (mainly R wave).
• In chest leads—QRS < 10 mm (mainly R wave)
19. CAUSES OF LOW VOLTAGE ECG TRACING
• Incorrect standardization (i.e. if < 10 mm).
• Obesity.
• Emphysema
• Pericardial effusion.
• Chronic constrictive pericarditis.
• Myxedema.
• Hypothermia.
21. LEFT VENTRICULAR HYPERTROPHY
• S in V1 + R in V6 or V5 > 35 mm
• R in V5 or V6 > 26 mm
• R in aVL > 11 mm
• R in aVF > 20 mm
• Left axis deviation
S in V2 + R in V5 > 35 mm
36. VENTRICULAR ECTOPIC
• P—absent.
• QRS—wide > 0.12 second (3 small squares).
• T—opposite to major deflection.
P absent
Wide QRS
T opposite to major deflation
37. • Bigeminy — every other beat is a ventricular ectopic
• Trigeminy — every third beat is a ventricular ectopic
38. VENTRICULAR TACHYCARDIA
• P wave—absent
• QRS—broad , abnormal or bizarre pattern
• Rate > 100 beats /minute
40. VENTRICULAR FIBRILLATION
• Chaotic irregular deflections of varying
amplitude
• No identifiable P waves, QRS complexes, or T
waves
Irregular deflaction
42. SECOND DEGREE AV BLOCK
• Second degree AV block may be of 2 types:
• Mobitz type I (Wenckebach’s phenomenon).
• Mobitz type II.
43. MOBITZ TYPE I
• Progressive lengthening of PR interval
followed by absent QRS complex
Drop Beat
PR interval lengthening
44. MOBITZ TYPE II
• Some P waves are not followed by QRS
complexes
• PR interval is constant
Drop beat
PR constant
45. COMPLETE HEART BLOCK
• PP interval—constant
• RR interval- constant
• No relationship between P wave and QRS
complex
P P P P P PR R R
46. RIGHT BUNDLE BRANCH BLOCK
• RSR’—in V1 and V2 (M pattern).
• QRS complex— wide (3 small squre)
RSR’
QRS wide
47. LEFT BUNDLE BRANCH BLOCK
• RSR’—in V5 and V6, also in LI and aVL (M pattern).
• QRS—wide (3 small squares)
RSR’
QRS wide
48. MYOCARDIAL INFARCTION
Criteria for acute myocardial infarction:
Rise of Troponin I with at least one of the
following:
1. Symptoms of myocardial ischaemia
2. New ischaemic ECG changes
3. Development of pathological Q waves
4. Imaging evidence of new loss of viable myocardium
or new regional wall motion abnormality
5. Identification of a coronary thrombus by
angiography or autopsy
(Fourth universal definition of myocardial infarction (2018),ESC)
49. ECG Criteria of Acute MI
• ST elevation (with upward convexity).
• Pathological Q wave.
• T inversion
50. Masurement of ST elevation
All lead accept V2-V3 ≥1mm
V2-V3
Men
≥40 years ≥2mm
<40 years ≥2.5mm
Women ≥1.5mm
Fourth universal definition of myocardial infarction (2018),ESC
51. Sites of Myocardial Infarction is
Detected in Different Leads
Anteroseptal MI V1 to V3 or V4
Anterior MI V1 to V6.
Extensive anterior MI L1, aVL, V1 to V6.
Lateral MI L1, aVL, V5, V6
High lateral L1 and aVL
Inferior MI L2, L3 and aVF
Right ventricular infarction V3R to V6R
Posterior (true) MI V1 and V2
60. Posterior Myocardial Infarction
• Posterior MI is suggested by the following
changes in V1-3:
• Tall, broad R waves (>30ms)
• Horizontal ST depression
• Upright T waves
76. PULMONARY EMBOLISM
• Sinus tachycardia
• RBBB
• Right axis deviation
• S in LI, Q and T inversion in LIII (SI, QIII, TIII
pattern)
• ST depression and T wave inversion in right
precordial leads (V1 and V2)