Downloaded 116 times
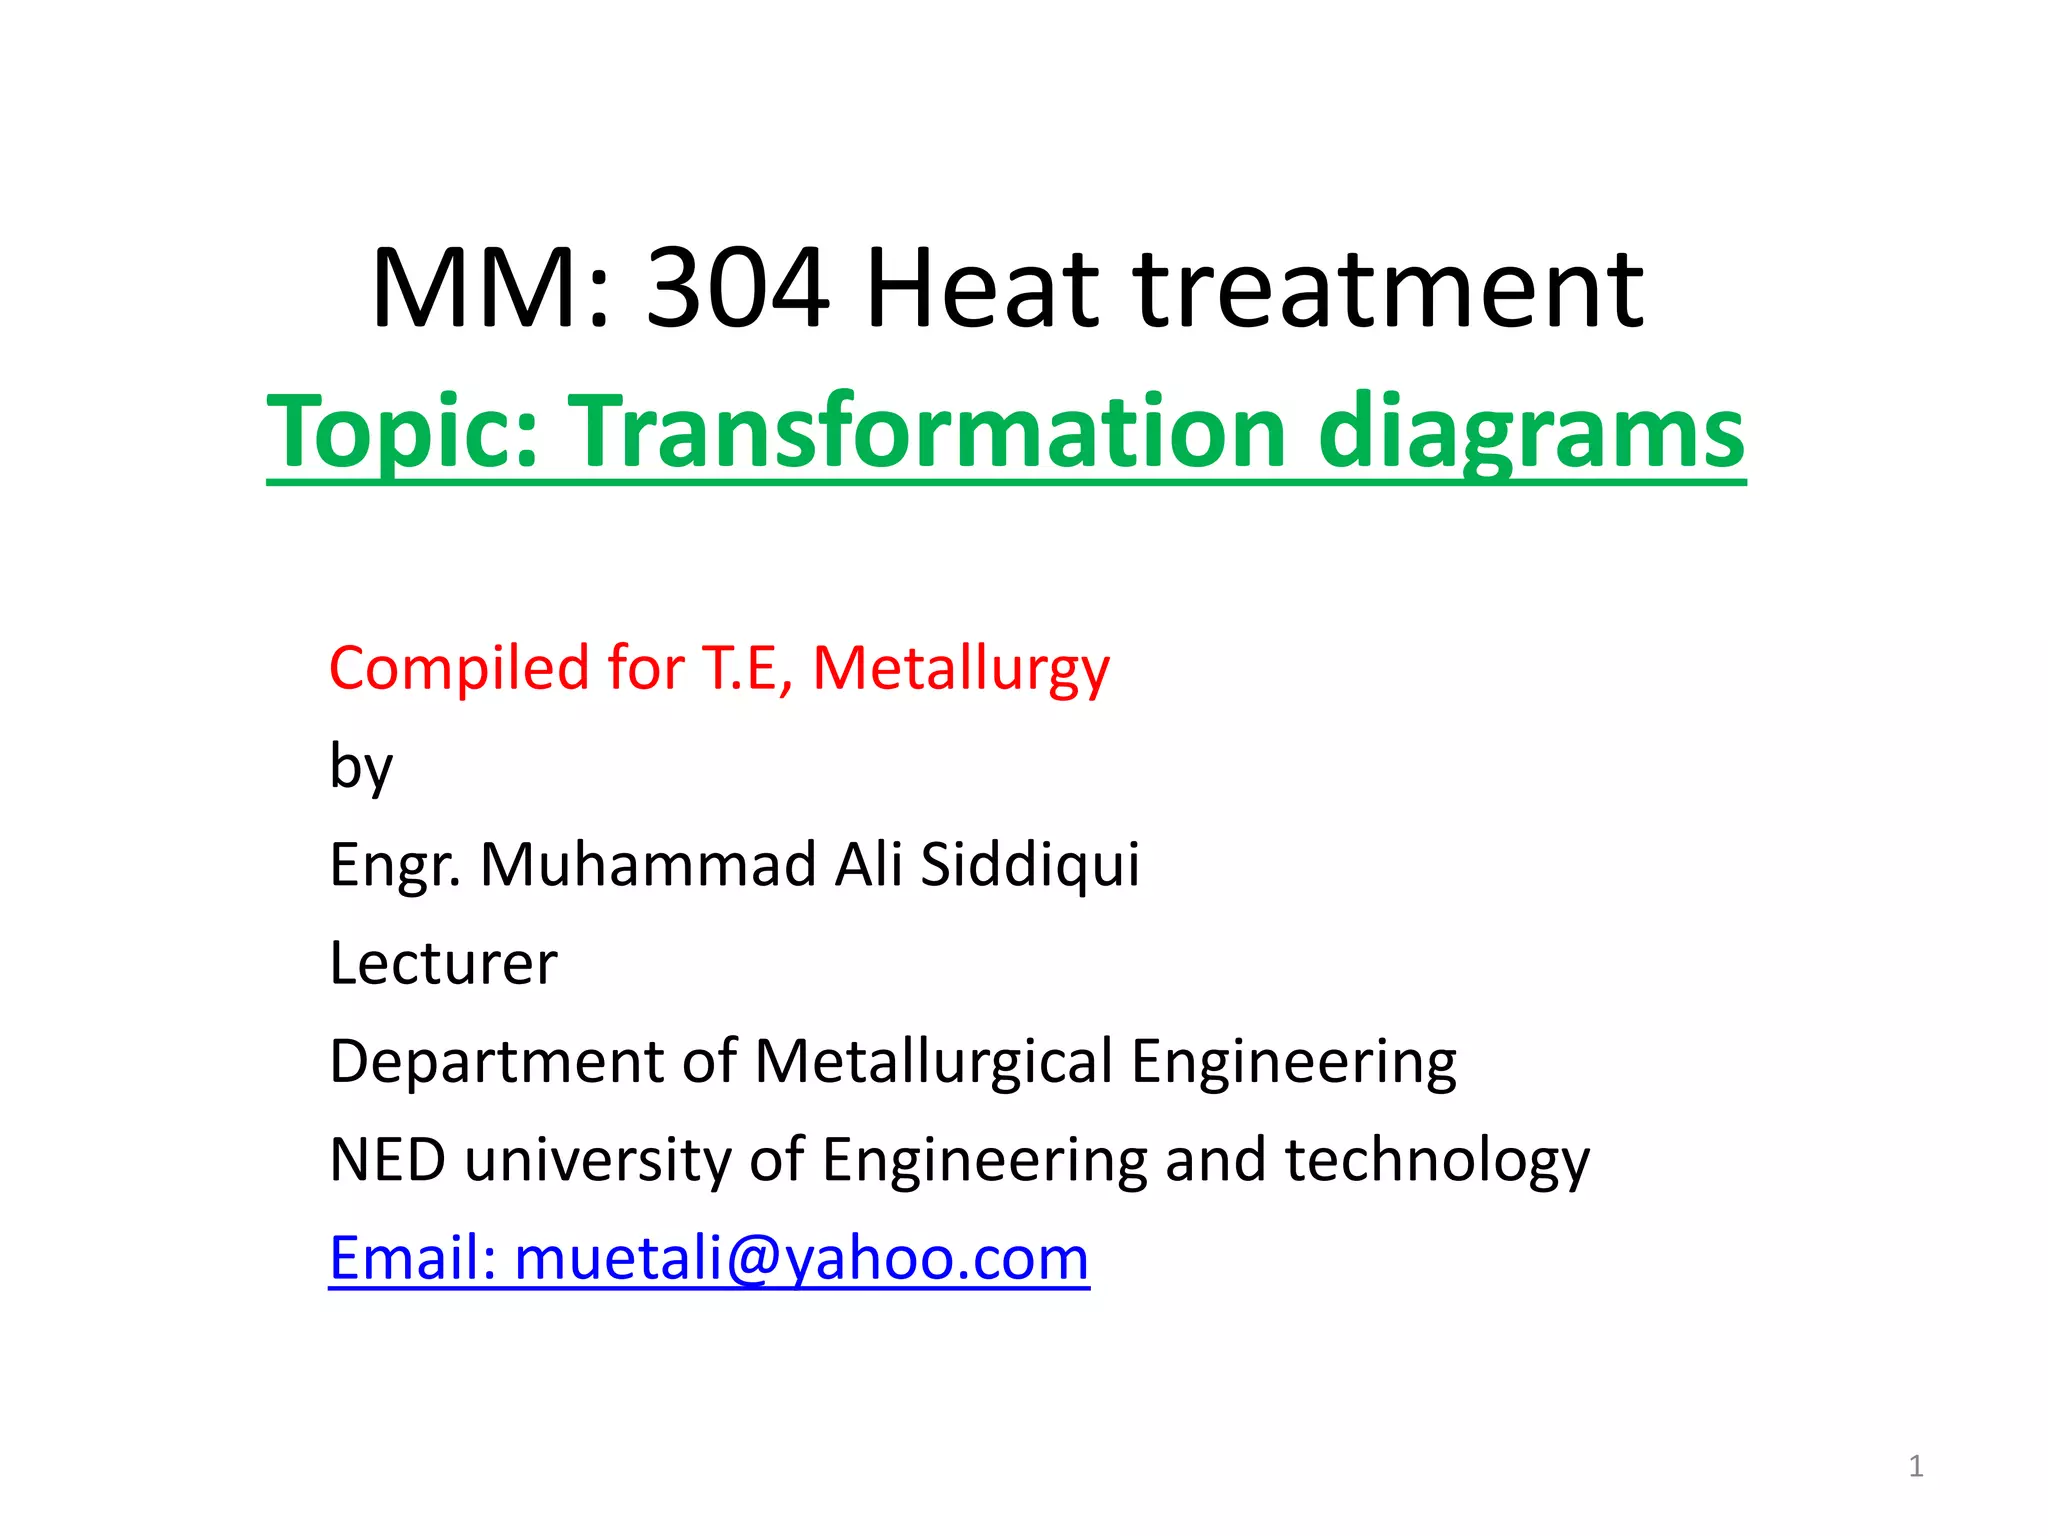
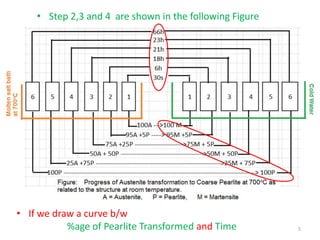
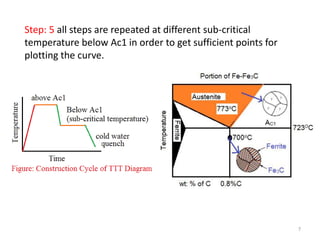
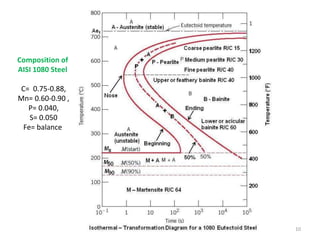
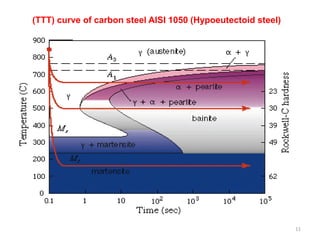
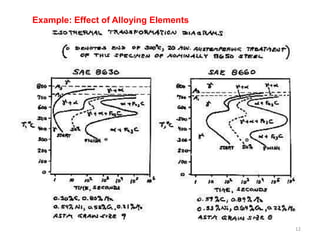
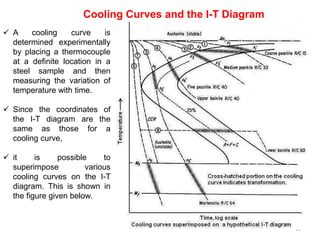

This document discusses isothermal transformation (TTT) diagrams. It explains that a TTT diagram plots temperature versus the logarithm of time for a steel of definite composition. It shows the transformations that begin and end during isothermal heat treatment of an austenitized alloy. The document provides steps for constructing a TTT diagram, including austenitizing a sample, cooling it to different subcritical temperatures and checking its hardness/microstructure over time. A TTT curve is generated by repeating these steps at different temperatures. An example TTT curve is shown for carbon steel AISI 1050. Cooling curves can also be superimposed on a TTT diagram.