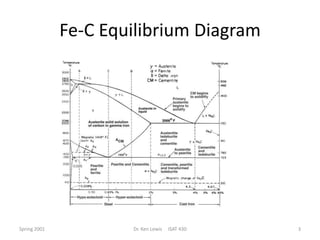
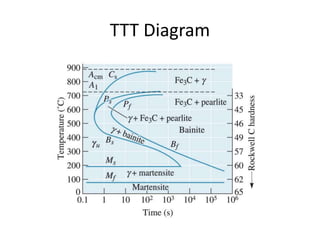
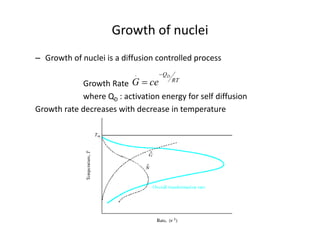
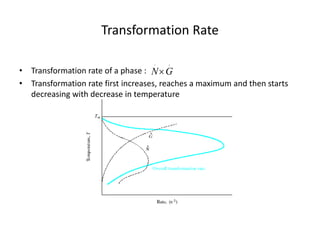
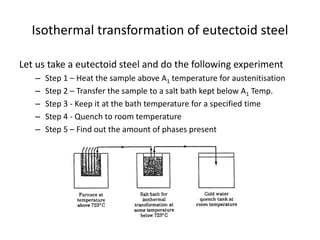
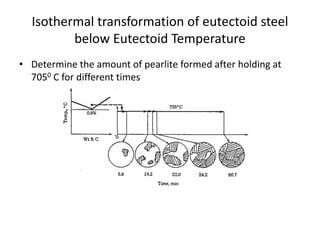
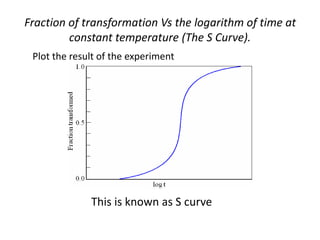
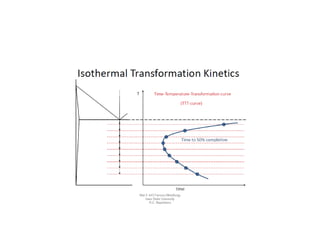
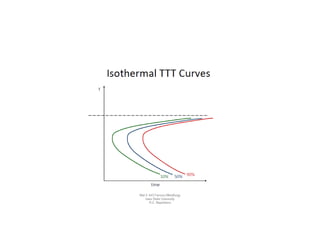
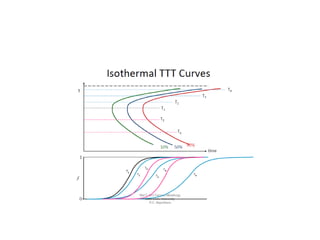
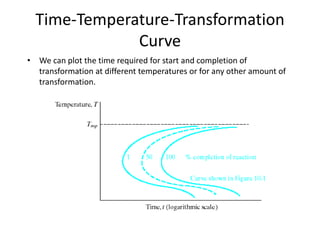
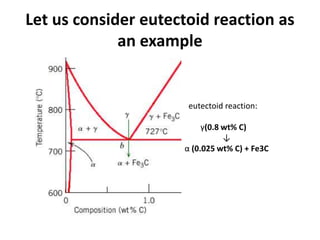
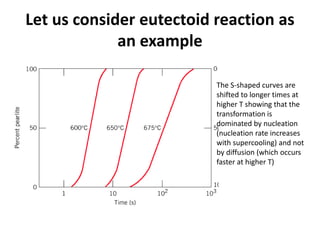
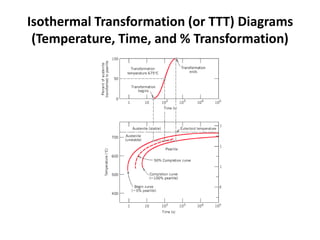
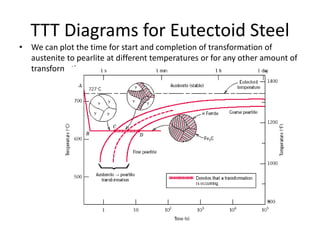
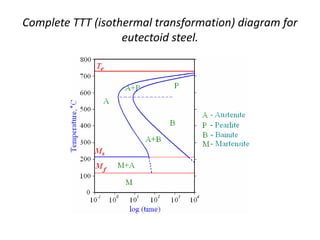
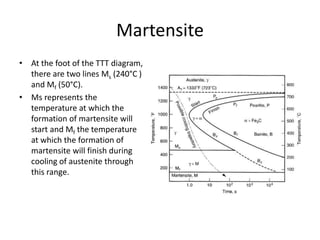
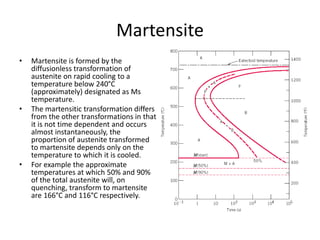
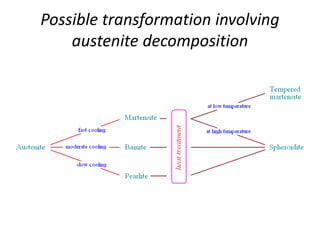
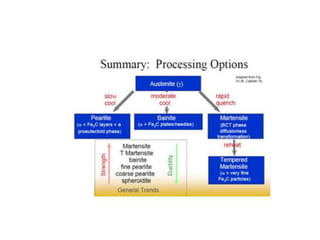
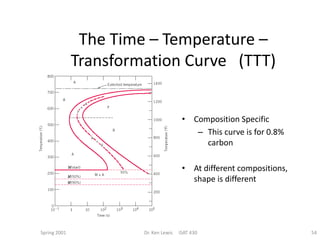
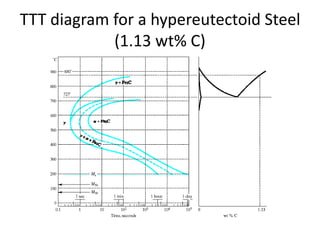
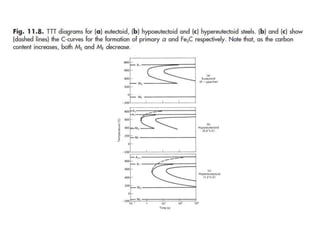
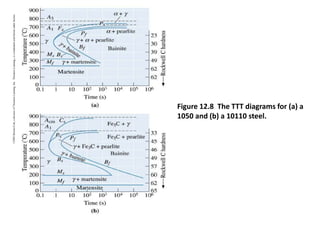
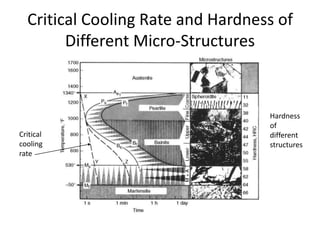
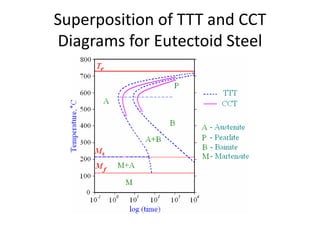
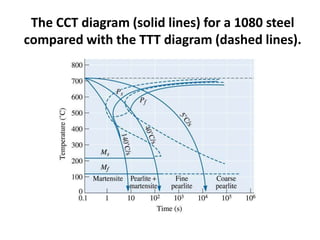
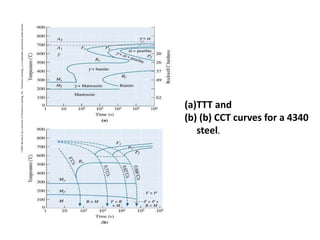
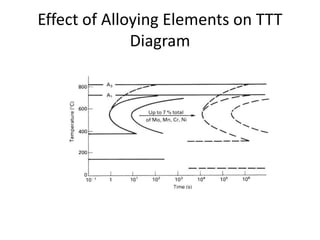
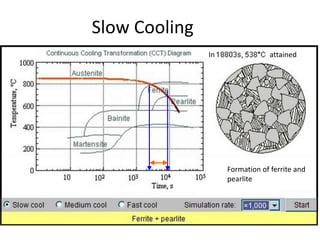
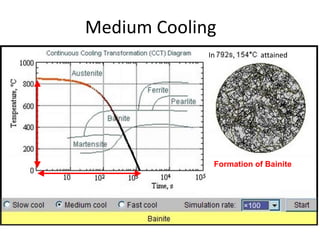
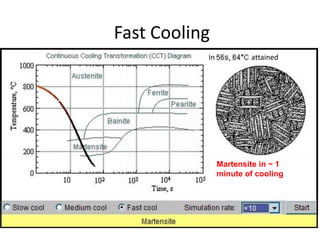
Quenching is a vital part of the heat treating process in manufacturing. This presentation by Houghton International will show you how to master the process for the most efficient quenching and heat treating operations.
Mumbai University.
Mechanical Engineering
SEM III
Material Technology
MOdule 3
TTT diagram, CCT diagram Hardenability concepts and tests, Graphitization of Iron- Grey iron, white iron, Nodular and malleable irons, their microstructures, properties and applications
Diagram ini menunjukkan transformasi fasa-fasa pada paduan baja saat temperatur yang isothermal (temperatur konstan) terhadap waktu yang dikenal dengan TTT diagram. Fasa-fasa ini bisa dilihat saat proses pemanasan hingga laju pendinginan.
Online aptitude test management system project report.pdfKamal Acharya
The purpose of on-line aptitude test system is to take online test in an efficient manner and no time wasting for checking the paper. The main objective of on-line aptitude test system is to efficiently evaluate the candidate thoroughly through a fully automated system that not only saves lot of time but also gives fast results. For students they give papers according to their convenience and time and there is no need of using extra thing like paper, pen etc. This can be used in educational institutions as well as in corporate world. Can be used anywhere any time as it is a web based application (user Location doesn’t matter). No restriction that examiner has to be present when the candidate takes the test.
Every time when lecturers/professors need to conduct examinations they have to sit down think about the questions and then create a whole new set of questions for each and every exam. In some cases the professor may want to give an open book online exam that is the student can take the exam any time anywhere, but the student might have to answer the questions in a limited time period. The professor may want to change the sequence of questions for every student. The problem that a student has is whenever a date for the exam is declared the student has to take it and there is no way he can take it at some other time. This project will create an interface for the examiner to create and store questions in a repository. It will also create an interface for the student to take examinations at his convenience and the questions and/or exams may be timed. Thereby creating an application which can be used by examiners and examinee’s simultaneously.
Examination System is very useful for Teachers/Professors. As in the teaching profession, you are responsible for writing question papers. In the conventional method, you write the question paper on paper, keep question papers separate from answers and all this information you have to keep in a locker to avoid unauthorized access. Using the Examination System you can create a question paper and everything will be written to a single exam file in encrypted format. You can set the General and Administrator password to avoid unauthorized access to your question paper. Every time you start the examination, the program shuffles all the questions and selects them randomly from the database, which reduces the chances of memorizing the questions.
Using recycled concrete aggregates (RCA) for pavements is crucial to achieving sustainability. Implementing RCA for new pavement can minimize carbon footprint, conserve natural resources, reduce harmful emissions, and lower life cycle costs. Compared to natural aggregate (NA), RCA pavement has fewer comprehensive studies and sustainability assessments.
NUMERICAL SIMULATIONS OF HEAT AND MASS TRANSFER IN CONDENSING HEAT EXCHANGERS...ssuser7dcef0
Power plants release a large amount of water vapor into the
atmosphere through the stack. The flue gas can be a potential
source for obtaining much needed cooling water for a power
plant. If a power plant could recover and reuse a portion of this
moisture, it could reduce its total cooling water intake
requirement. One of the most practical way to recover water
from flue gas is to use a condensing heat exchanger. The power
plant could also recover latent heat due to condensation as well
as sensible heat due to lowering the flue gas exit temperature.
Additionally, harmful acids released from the stack can be
reduced in a condensing heat exchanger by acid condensation. reduced in a condensing heat exchanger by acid condensation.
Condensation of vapors in flue gas is a complicated
phenomenon since heat and mass transfer of water vapor and
various acids simultaneously occur in the presence of noncondensable
gases such as nitrogen and oxygen. Design of a
condenser depends on the knowledge and understanding of the
heat and mass transfer processes. A computer program for
numerical simulations of water (H2O) and sulfuric acid (H2SO4)
condensation in a flue gas condensing heat exchanger was
developed using MATLAB. Governing equations based on
mass and energy balances for the system were derived to
predict variables such as flue gas exit temperature, cooling
water outlet temperature, mole fraction and condensation rates
of water and sulfuric acid vapors. The equations were solved
using an iterative solution technique with calculations of heat
and mass transfer coefficients and physical properties.
Water billing management system project report.pdfKamal Acharya
Our project entitled “Water Billing Management System” aims is to generate Water bill with all the charges and penalty. Manual system that is employed is extremely laborious and quite inadequate. It only makes the process more difficult and hard.
The aim of our project is to develop a system that is meant to partially computerize the work performed in the Water Board like generating monthly Water bill, record of consuming unit of water, store record of the customer and previous unpaid record.
We used HTML/PHP as front end and MYSQL as back end for developing our project. HTML is primarily a visual design environment. We can create a android application by designing the form and that make up the user interface. Adding android application code to the form and the objects such as buttons and text boxes on them and adding any required support code in additional modular.
MySQL is free open source database that facilitates the effective management of the databases by connecting them to the software. It is a stable ,reliable and the powerful solution with the advanced features and advantages which are as follows: Data Security.MySQL is free open source database that facilitates the effective management of the databases by connecting them to the software.
KuberTENes Birthday Bash Guadalajara - K8sGPT first impressionsVictor Morales
K8sGPT is a tool that analyzes and diagnoses Kubernetes clusters. This presentation was used to share the requirements and dependencies to deploy K8sGPT in a local environment.
Literature Review Basics and Understanding Reference Management.pptxDr Ramhari Poudyal
Three-day training on academic research focuses on analytical tools at United Technical College, supported by the University Grant Commission, Nepal. 24-26 May 2024
2. Phase Transformations in Steels
• Iron has having different crystal structures at
different temperatures.
• It changes from FCC to BCC at 910o C.
• This transformation results in austenite
transforming to pearlite at eutectoid
temperature.
• This transformation of austenite is time
dependant.
4. Fe-C Equilibrium Diagram
• Though the Fe-C equilibrium diagram is very useful, it does
not provide information about the transformation of
austenite to any structure other than equilibrium
structures, nor does it provide any details about the
influence of cooling rates on the formation of different
structures.
• In other words, Fe-C diagram does not explain the
decomposition of austenite under non-equilibrium
conditions or conditions involving faster rates of cooling
than equilibrium cooling.
• Several structures (e.g. martensite) not appearing on the
equilibrium diagram may be found in the microstructures in
steels.
5. TTT Diagram
• On the other hand, TTT diagram is a more
practical diagram.
• It shows what structures can be expected
after various rates of cooling.
• It graphically describes the cooling rate
required for the transformation of austenite to
pearlite, bainite or martensite.
• TTT diagram also gives the temperature at
which such transformations take place.
6. Phase diagram and TTT diagram
• Phase diagram :
– Describes equilibrium
microstructural development
that is obtained at extremely
slow cooling or heating
conditions.
– Provides no information on
time taken to form phase
• TTT diagram
– For a given alloy composition,
the percentage completion of
a given phase transformation
on temperature-time axes is
described.
Which information are obtained from phase diagram or
TTT diagram?
7. Transformation Diagrams
• There are two main types of transformation
diagrams that are helpful in selecting the
optimum steel and processing route to
achieve a given set of properties. These are
1. Time-temperature transformation (TTT) diagrams
2. Continuous cooling transformation (CCT) diagrams
8. Transformation Diagrams
• Time-temperature transformation (TTT)
diagrams
1. Indicates the amount of transformation at a
constant temperature.
2. Samples are austenitised and then cooled
rapidly to a lower temperature and held at that
temperature whilst the amount of transformation
is measured, for example by dilatometry.
3. Obviously a large number of experiments are
required to build up a complete TTT diagram.
9. Transformation Diagrams
• Continuous cooling transformation (CCT) diagrams
1. Indicates the extent of transformation as a function
of time for a continuously decreasing temperature.
2. Samples are austenitised and then cooled at a
predetermined rate and the degree of transformation
is measured, for example by dilatometry.
3. In this case also a large number of experiments are
required to build up a complete CCT diagram also
10. Transformation Diagrams
• CCT diagrams are generally more appropriate
for engineering applications as components
are cooled (air cooled, furnace cooled,
quenched etc.) from a processing temperature
as this is more economic than transferring to a
separate furnace for an isothermal treatment.
13. Fe-C Equilibrium Diagram
• Austenite is stable above A1 temperature
• Below this temperature, austenite is unstable.
Spring 2001 Dr. Ken Lewis ISAT 430 13
Eutectoid
Steel
14. How Transformation Ocures?
• Transformation of austenite to pearlite ocures
by nucleation and growth mechanism.
• This transformation requires diffusion.
15. Nucleation rate
• As temperature decreases below eutectoid temperature, r* (critical size of
nucleus) decreases increasing the nucleation rate N.
• At very low temperature, nucleation rate decreases due to large decrease
in diffusion rate.
• At intermediate temperature, nucleation rate is maximum
16. Growth of nuclei
– Growth of nuclei is a diffusion controlled process
Growth Rate
where QD : activation energy for self diffusion
Growth rate decreases with decrease in temperature
RT
QD
ce
G
.
17. Transformation Rate
• Transformation rate of a phase :
• Transformation rate first increases, reaches a maximum and then starts
decreasing with decrease in temperature
.
.
G
N
18. Time for Transformation
• Time required for transformation as a function of temperature
follows a reverse trend than the rate of transformation.
Time required for transformation fist decreases, reaches a
minimum and then starts increasing with decrease in
temperature.
20. Isothermal transformation of eutectoid steel
Let us take a eutectoid steel and do the following experiment
– Step 1 – Heat the sample above A1 temperature for austenitisation
– Step 2 – Transfer the sample to a salt bath kept below A1 Temp.
– Step 3 - Keep it at the bath temperature for a specified time
– Step 4 - Quench to room temperature
– Step 5 – Find out the amount of phases present
21. Isothermal transformation of eutectoid steel
below Eutectoid Temperature
• Determine the amount of pearlite formed after holding at
7050 C for different times
22. Fraction of transformation Vs the logarithm of time at
constant temperature (The S Curve).
Plot the result of the experiment
This is known as S curve
23. Fraction of transformation Vs the logarithm of time at
constant temperature (The S Curve).
The transformation starts but it takes some time before we can see a
precipitate. The time required for transformation required to initiate the
transformation is known as Incubation Period.
The rate of transformation first increases and then starts decreasing
24. Time required for completion of
transformation
• Now repeat the experiment at different temperatures below A1 temp.
• Plot the time for completion of transformation at different temperatures.
30. Let us consider eutectoid reaction as
an example
eutectoid reaction:
γ(0.8 wt% C)
↓
α (0.025 wt% C) + Fe3C
31. Let us consider eutectoid reaction as
an example
The S-shaped curves are
shifted to longer times at
higher T showing that the
transformation is
dominated by nucleation
(nucleation rate increases
with supercooling) and not
by diffusion (which occurs
faster at higher T)
33. TTT Diagrams for Eutectoid Steel
• We can plot the time for start and completion of transformation of
austenite to pearlite at different temperatures or for any other amount of
transformation.
34. Transformations of austenite to Pearlite
Transformations of austenite :
→ + Fe3C
1) At slightly lower T below 727 ℃ : T <<
• Coarse pearlite
: nucleation rate is very low.
: diffusion rate is very high.
2) As the T (trans. temp.) decreases to
500 ℃
• Fine pearlite
: nucleation rate increases.
: diffusion rate decreases.
Strength : (MPa) = 139 + 46.4 S-1
S : inter-lamellar spacing
655
℃
600
℃
534
℃
487
℃
pearlite
35. But at lower temperatures ….
• At lower temperatures, the austenite
transforms to bainite.
• Bainite is also a mixture of ferrite and
cementite but not in the form of alternate
layers.
36. Transformations of austenite to Bainite
3) At further lower temperatures, 250 ℃ < Tt < 500 ℃, below the nose in
TTT diagram.
• Driving force for the transformation ( → + Fe3C) is very high.
• Diffusion rate is very low.
• Nucleation rate is very high.
→ + Fe3C (But not in the form of alternate layers)
: Bainite ; cementite in the form of needle type.
495 ℃ 410 ℃
bainite
37. TTT diagram for eutectoid steel
• Plot the time for start and completion of transformation at
different temperatures at still lower temperatures
38. On further decreasing the
transformation temperature
• Below a certain temperature, the austenite
changes or transforms to martensite.
• Martensite is a super saturated solid solution
of carbon in iron.
• It is a diffusionless transformation.
• It is also known as shear transformation as the
interface between austenite and martensite
moves as a shear wave at the speed of sound.
39. Transformations of austenite to Martensite
4. When the austenite is quenched to temp. below Ms
→ ’ (martensite)
: Driving force for trans. of austenite → extremely high.
Diffusion rate is extremely slow.
: Instead of the diffusional migration of carbon atoms to produce
separate and Fe3C phases, the matensite transformation involves
the sudden reorientation of C and Fe atoms from the austenite (FCC)
to a body centered tetragonal (bct) solid solution.
→ ’ (martensite), a super saturated
solid solution of carbon in iron
formed by shear transformation
(diffusionless transformation)
→ very hard and brittle phase
martensite
40. Diffusionless Transformation
1) Diffusionless transformation → no compositional change during
transformation.
2) The temperature at which the transformation of → ’ starts is
known as at Ms temp. and finishes at Mf temp.
3) Degree of super saturation and c/a ratio increases as the carbon
content increases.
42. Time Temperature Transformation
(TTT) Diagram
• Below A1 , austenite is unstable, i.e., it can transform
into pearlite, bainite or martensite.
• The phases finally formed during cooling depend upon
time and temperature.
• TTT diagram shows the time required for
transformation to various phases at constant
temperature, and, therefore, gives a useful initial guide
to likely transformations.
• In addition to the variations in the rate of
transformation with temperature, there are variations
in the structure of the transformation products also.
43. Spring 2001 Dr. Ken Lewis ISAT 430 43
The Time – Temperature –
Transformation Curve (TTT)
• At slow cooling rates the trajectory
can pass through the Pearlite and
Bainite regions
• Pearlite is formed by slow cooling
– Trajectory passes through Ps
above the nose of the TTT
curve
• Bainite
– Produced by rapid cooling to a
temperature above Ms
– Nose of cooling curve avoided.
44. Spring 2001 Dr. Ken Lewis ISAT 430 44
The Time – Temperature –
Transformation Curve (TTT)
• If cooling is rapid enough
austenite is transformed into
Martensite.
– FCC → BCT
– diffusion separation of carbon
and iron is not possible
• Transformation begins at Ms and
ends at Mf.
– If cooling is stopped at a
temperature between Ms and
Mf , it will transform into
martensite and bainite .
45. Full TTT Diagram
The complete TTT
diagram for an iron-
carbon alloy of eutectoid
composition.
A: austenite
B: bainite
M: martensite
P: pearlite
46. TTT Diagram
• Transformations at temperatures between
approximately 705°C and 550°C result in the
characteristic lamellar microstructure of pearlite.
• At a temperature just below A1 line, nucleation
of cementite from austenite will be very slow, but
diffusion and growth of nuclei will proceed at
maximum speed, so that there will be few large
lamellae and the pearlite will be coarse.
• However, as the transformation temperature is
lowered, i.e., it is just above the nose of the C-
curve, the pearlite becomes fine.
47. Bainite
• At temperatures between 550°C and 240°C (the approximate, Ms
temperature line), transformation becomes more sluggish as the
temperature falls, for, although austenite becomes increasingly
unstable, the slower rate of diffusion of carbon atoms in austenite
at lower temperatures outstrips the increased urge of the austenite
to transform. In this temperature range the transformation product
is bainite.
• Bainite consists (like pearlite) of a ferrite matrix in which particles of
cementite are embedded. The individual particles are much finer
than in pearlite. The appearance of bainite may vary between
– feathery mass of fine cementite and ferrite for bainite formed around
480°C and
– dark acicular (needle shaped) crystals for bainite formed in the region
of around 310°C).
48. Martensite
• At the foot of the TTT diagram,
there are two lines Ms (240°C )
and Mf (50°C).
• Ms represents the
temperature at which the
formation of martensite will
start and Mf the temperature
at which the formation of
martensite will finish during
cooling of austenite through
this range.
49. Martensite
• Martensite is formed by the
diffusionless transformation of
austenite on rapid cooling to a
temperature below 240°C
(approximately) designated as Ms
temperature.
• The martensitic transformation differs
from the other transformations in that
it is not time dependent and occurs
almost instantaneously, the
proportion of austenite transformed
to martensite depends only on the
temperature to which it is cooled.
• For example the approximate
temperatures at which 50% and 90%
of the total austenite will, on
quenching, transform to martensite
are 166°C and 116°C respectively.
50. Martensite
(i) Martensite is a metastable phase of steel,
formed by transformation of austenite below
Ms temperature.
(ii) Martensite is an interstitial supersaturated
solid solution of carbon in iron having a body-
centered tetragonal lattice.
(iii) Martensite is normally a product of
quenching.
(iv) Martensite is very hard, strong and brittle.
54. Spring 2001 Dr. Ken Lewis ISAT 430 54
The Time – Temperature –
Transformation Curve (TTT)
• Composition Specific
– This curve is for 0.8%
carbon
• At different compositions,
shape is different
55. TTT Diagram
• The TTT digrams for hypo-eutectoid steels and
hyper-eutectoid steels will differ from that of
eutectoid steels
• The TTT digrams for hypo-eutectoid steels will
have an additional curve to show the
precipitation of ferrite from martensite before
transformation of remaining austenite to
pearlite
57. TTT Diagram
• The TTT digrams for hyper-eutectoid steels
will differ from that of eutectoid steels
• The TTT diagrams for hyper-eutectoid steels
will have an additional curve to show the
precipitation of cementite from martensite
before transformation of remaining austenite
to pearlite
62. CCT Diagram
• If you don’t hold at one temperature and allow
temperature to change with time, you are “Continuously
Cooling”.
• In continuous cooling, the constant temperature basis of
TTT diagram becomes obviously unrepresentative.
• More relevant information can, thus, be obtained from a
CCT diagram in which phase changes are tracked for a
variety of cooling rates.
• Therefore, a CCT diagram’s transition lines will be different
than a TTT diagram.
• Plotting actual cooling curves on such a diagram will show
the types of transformation product formed and their
proportions.
63. Continuous cooling transformation diagram for eutectoid steels
• Annealing : heat the steel into
region → cool it in furnace
(power off) → coarse pearlite
• Normalizing : heat the steel
into region → cool it in air →
fine pearlite
• Hardening : heat the steel into
region → quench it in water
→ Martensite
65. Effect of Cooling Rate on the Formation of
Different Reaction Products
• Very slow cooling rate (furnace cooling), typical of
conventional annealing, will result in coarse
pearlite with low hardness.
• Air cooling is a faster cooling rate than annealing
and is known as nonmalizing. It produces fine
pearlite.
• In water quenching, entire substance remains
austentic until the Ms line is reached, and
changes to martensite between the Ms and Mf
lines.
66. Effect of Cooling Rate on the Formation of
Different Reaction Products
• It is possible to form 100% pearlite or 100%
martensite by continuous cooling, but it is not
possible to form 100% Bainite.
• To obtain a bainitic structure, cool rapidly
enough to miss the nose of curve and then
holding in the temperature range at which
bainite is formed.
67. Critical Cooling Rate (CCR)
• If the cooling curve is tangent to the nose of
TTT curve, the cooling rate associated with
this cooling curve is Critical Cooling Rate (CCR)
for this steel.
• Any cooling rate equal to or faster than CCR
will form only martensite.
68. Critical Cooling Rate and Hardness of
Different Micro-Structures
Critical
cooling
rate
Hardness
of
different
structures
69. Factors Affecting Critical Cooling Rate
• Any thing which shifts the TTT diagrm towards
right will decrease the critical cooling rate
• The following factor affect the critical coolin rate
– 1. Grain size
– 2. Carbon content
– 3. Alloying elements
Increase in grain size, carbon content or alloying
elements shifts the TTT diagram towards right and
hence reduces the critical cooling rate as shown in
next slide.
70. Effect of Carbon Content and Grain
Size on Critical Cooling Rate
75. Effect of Grain Size
• Fine grain steels tend to promote formation of
ferrite and pearlite from austenite.
• Hence decrease in grain size shifts the TTT
diagram towards left.
• Therefore, critical cooling rate increases with
decrease in grain size.
76. Effect of Carbon Content
• There is a significant influence of composition on
the TTT and CCT diagrams. For the
transformation diagrams we see the effect
through a shift in the transformation curves. For
example:
– An increase in carbon content shifts the CCT and TTT
curves to the right (this corresponds to an increase in
hardenability as it increases the ease of forming
martensite - i.e. the cooling rate required to attain
martensite is less severe).
– An increase in carbon content decreases the Ms
(martensite start) temperature.
77. Effect of Alloying Elements
• Different alloying elements have their
different effects on TTT diagram.
• An increase in alloy content shifts the CCT and
TTT curves to the right and
• Alloying elements also modify the shape of
the TTT diagram and separate the ferrite +
pearlite region from the bainite region making
the attainment of a bainitic structure more
controllable.