VIP Mumbai Call Girls Thakur village Just Call 9920874524 with A/C Room Cash ...
Unit 3.pdf
1. UNIT 3
STRENGTHENING PROCESSES
Heat treatment of steel: TTT diagram and CCT diagram. Heat treatment processes: Annealing,
Normalizing, Tempering and Quenching, Jominy quency test for hardenability. Case hardening:
Carburizing, Nitriding, Cyaniding, Carbonitriding, Flame hardening and Induction hardening. Others:
Dispersion strengthening & Precipitation hardening
--------------------------
1. TTT diagram
Time-Temperature-Transformation (TTT) diagram or Isothermal transformation diagram or S-
curve refers to only one steel of a particular composition at a time, which applies to all carbon steels.
This diagram is also called as C-curve isothermal (decomposition of austenite) diagram and Bain’s
curve. The effect of time-temperature on the microstructure changes of steel can be shown by the TTT
diagram. These diagrams are extensively used in the assessment of the decomposition of austenite in
heat-treatable steels. Further, iron-carbon phase diagram does not show time as a variable and hence
the effects of different cooling rates on the structures of steels are not revealed.
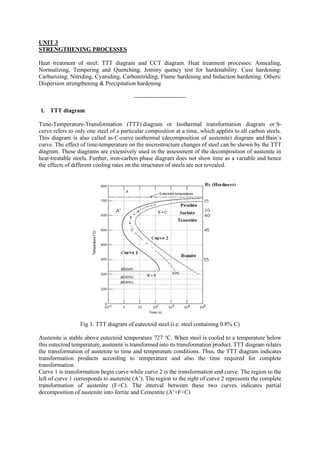
Fig 1. TTT diagram of eutectoid steel (i.e. steel containing 0.8% C)
Austenite is stable above eutectoid temperature 727 °C. When steel is cooled to a temperature below
this eutectoid temperature, austenite is transformed into its transformation product. TTT diagram relates
the transformation of austenite to time and temperature conditions. Thus, the TTT diagram indicates
transformation products according to temperature and also the time required for complete
transformation.
Curve 1 is transformation begin curve while curve 2 is the transformation end curve. The region to the
left of curve 1 corresponds to austenite (A’). The region to the right of curve 2 represents the complete
transformation of austenite (F+C). The interval between these two curves indicates partial
decomposition of austenite into ferrite and Cementite (A’+F+C)
2. Fig 4. Detailed TTT diagram of eutectoid steel (i.e., steel containing 0.8% C)
Close to the eutectoid temperature, the undercooling is low so that the driving force for the
transformation is small. However, as the undercooling increases transformation accelerates until the
maximum rate is obtained at the “nose” of the curve. Below this temperature the driving force for
transformation continues to increase but the reaction is now impeded by slow diffusion. This is why
TTT curve takes on a “C” shape with most rapid overall transformation at some intermediate
temperature.
Pearlitic transformation is reconstructive. At a given temperature (say T1) the transformation starts after
an incubation period (t2, at T1). Locus of t2 for different for different temperature is called transformation
start line. After 50% transformation locus of that time (t3 at T1) for different temperatures is called 50%
transformation line. While transformation completes that time (t4 at T1) is called transformation finish,
locus of that is called transformation finish line. Therefore, TTT diagram consists of different lines of
which 1%, 50% and 99% transformation lines are shown in the diagram. At high temperature while
underlooling is low form coarse pearlite. At the nose temperature fine pearlite and upper bainite form
simultaneously though the mechanisms of their formation are entirely different.
On cooling of metastable austenite 1% martensite forms at about 230 °C. The transformation is athermal
in nature. i.e., amount of transformation is time independent (characteristic amount of transformation
completes in a very short time) but function of temperature alone. This temperature is called the
martensite start temperature or MS. Below MS while metastable austenite is quenched at different
temperature amount of martensite increases with decreasing temperature and does not change with time.
The temperature at which 99% martensite forms is called martensite finish temperature or MF. Hardness
values are plotted on right Y-axis. Therefore, a rough idea about mechanical properties can be guessed
about the phase mix.
2. CCT diagram
Heat-treating operations are not carried out using isothermal process, but using continuous cooling. As
a result, the TTT curves representing the transformation of austenite are not strictly applicable to heat-
treating operations. The diagrams provide an estimate, but do not provide accurate microstructure
information. Because of this limitation, Continuous Cooling Transformation (CCT) diagrams were
developed to overcome the limitations of TTT curves.
The primary difference between TTT diagrams and CCT diagrams is that TTT diagrams examine the
progress of transformation as a function of time, at a fixed temperature. CCT diagrams examine the
3. progress of transformation as a function of changing temperature. In general, in CCT diagrams, the
transformations of austenite are shifted to lower temperatures and longer times. The CCT diagrams
allow the prediction of microstructure and hardness, which is not possible using a TTT curve.
A) CCT diagram depends on composition of steel, nature of cooling, austenite grain size, extent of
austenite homogenising, as well as austenitising temperature and time.
B) Similar to TTT diagrams there are different regions for different transformation (i.e.,
cementite/ferrite, pearlite, bainite and martensite). There is transformation start and transformation
finish line. However, depending on factors mentioned earlier some of the transformation may be
absent or some transformation may be incomplete.
C) In general for ferrite, pearlite and bainite transformation start and finish temperature moves
towards lower temperature and transformation time towards higher timing in comparison to
isothermal transformation. Transformation curve moves down and right.
D) The bainite reaction can be sufficiently retarded such that transformation takes shelter completely
under pearlitic transformation in case of eutectoid plain carbon steel and therefore bainite region
vanishes. However, in other steel it may be partially sheltered. Therefore, bainitic region observed
in non-eutectoid plain carbon steel or alloy steels.
E) C-curves nose move to lower temperature and longer time. So actual critical cooling rate required
to avoid diffusional transformation during continuous cooling is less than as prescribed by TTT
diagram. Actual hardenability is higher than that predicted by TTT.
F) MS temperature is unaffected by the conventional cooling rate; however, it can be lowered at lower
cooling rate if cooling curves such that austenite enriches with carbon due to bainite or ferrite
formation (in hypoeutectoid steel). On the other, MS can go up for lower cooling rate such that
austenite become lean in carbon due to carbide separation (in hypereutectoid steel).
G) Large variety of microstructure like ferrite/cementite/carbide +pearlite+bainite+martensite can be
obtained in suitable cooling rate. It is not feasible or limited in case of isothermal transformation.
Pearlite is a layered metallic structure of two-phases, which compose of alternating layers of ferrite
(87.5 wt%) and cementite (12.5 wt%) that occurs in some steels and cast irons. It is named for its
resemblance to mother of pearl.
Martensite is a very hard metastable structure with a body-centered tetragonal (BCT) crystal structure.
Martensite is formed in steels when the cooling rate from austenite is at such a high rate that carbon
atoms do not have time to diffuse out of the crystal structure in large enough quantities to form cementite
(Fe3C).
4. Bainite is a plate-like microstructure that forms in steels from austenite when cooling rates are not rapid
enough to produce martensite but are still fast enough so that carbon does not have enough time to
diffuse to form pearlite. Bainitic steels are generally stronger and harder than pearlitic steels; yet they
exhibit a desirable combination of strength and ductility.
3. Heat treatment processes
It is defined as an operation involving the heating and cooling of a metal or an alloy in the solid-state
to obtain certain desirable properties without change composition. The process of heat treatment is
carried out to change the grain size, to modify the structure of the material, and to relieve the stresses
set up the material after hot or cold working.
• Process of controlled heating and cooling of metals
• Alter their physical and mechanical properties
• Without changing the product shape
• Sometimes takes place inadvertently due to manufacturing processes that either heat or cool the
metal such as welding or forming.
Heat treatment done for one of the following objectives:
• Hardening
• Softening
• Property modification.