Downloaded 247 times


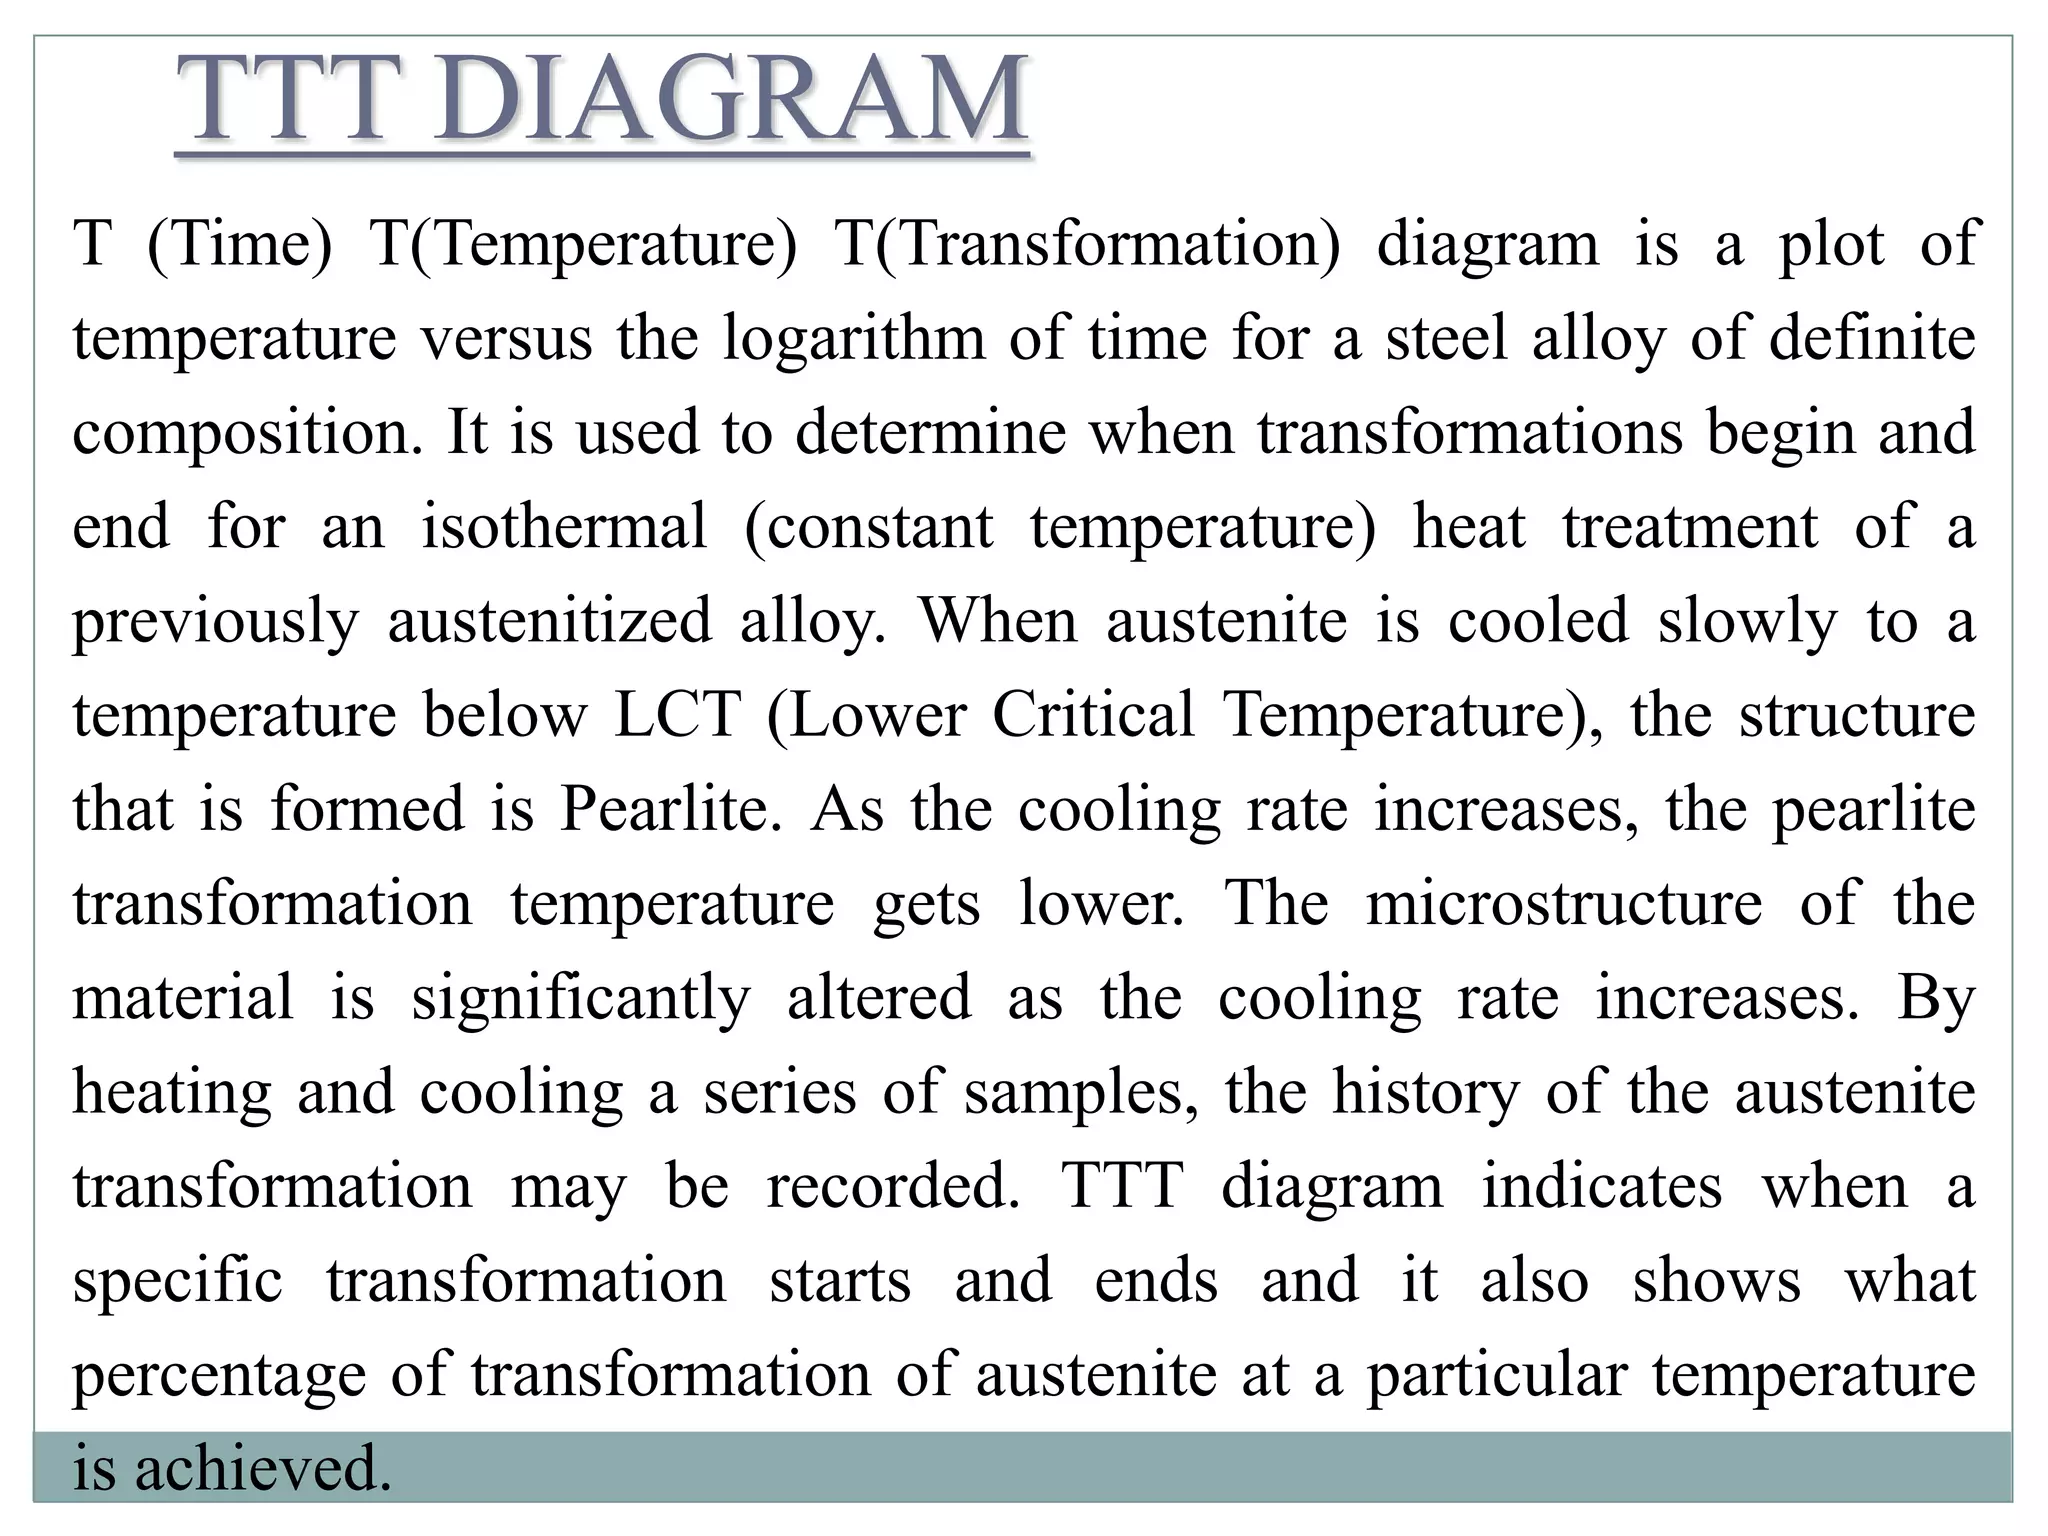


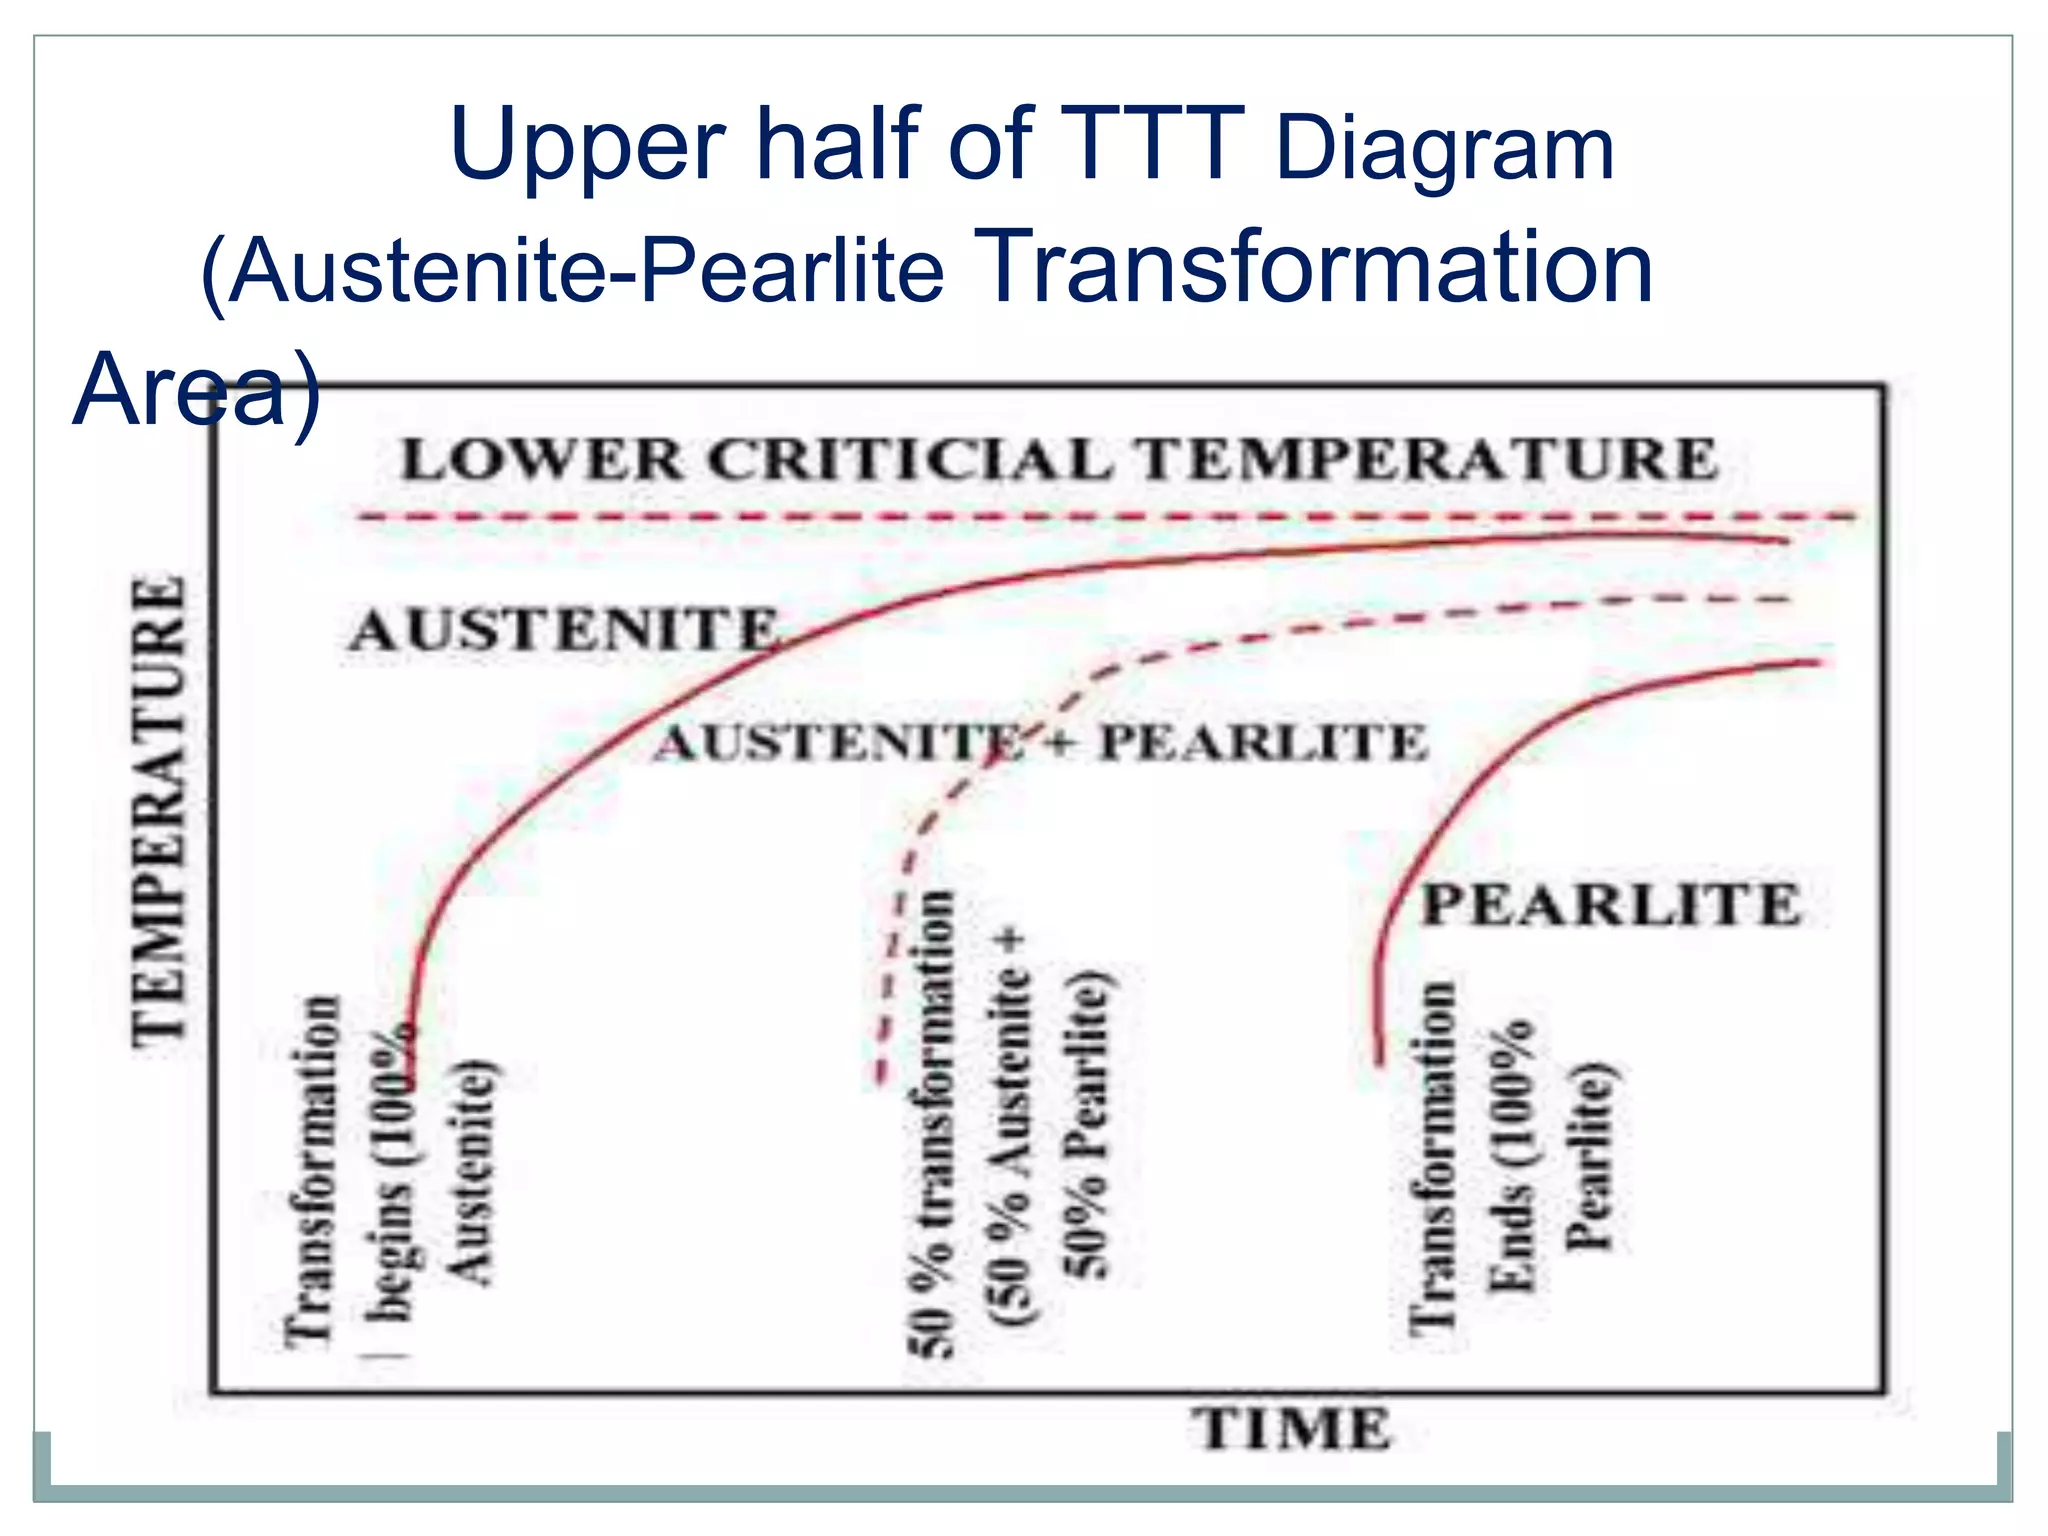

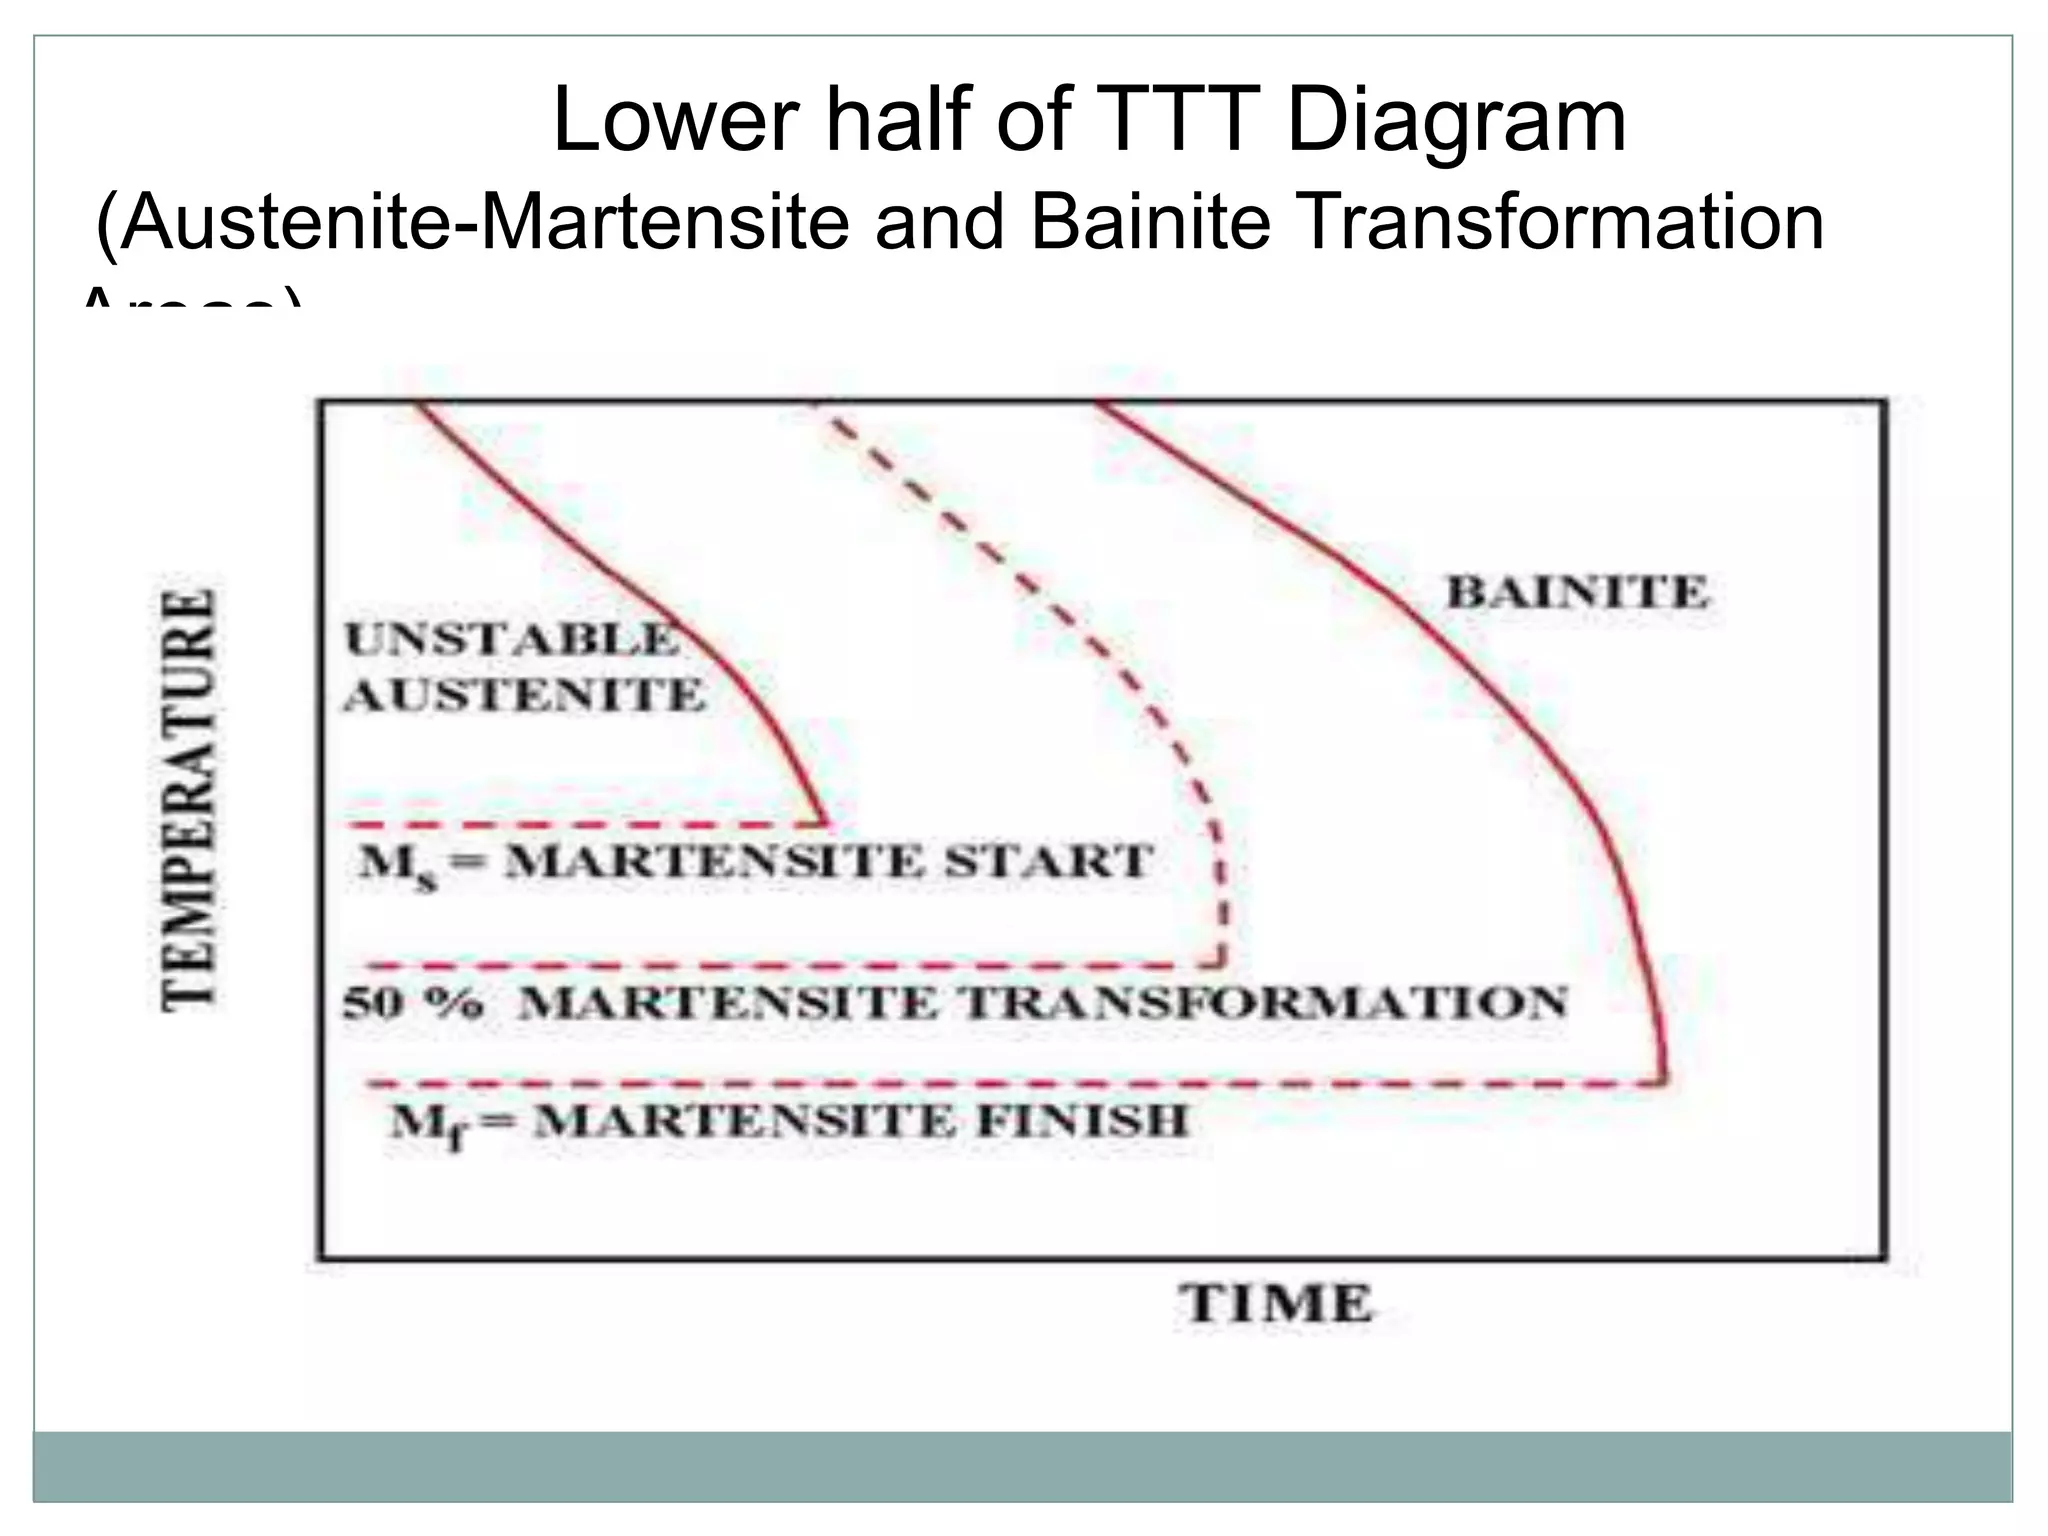

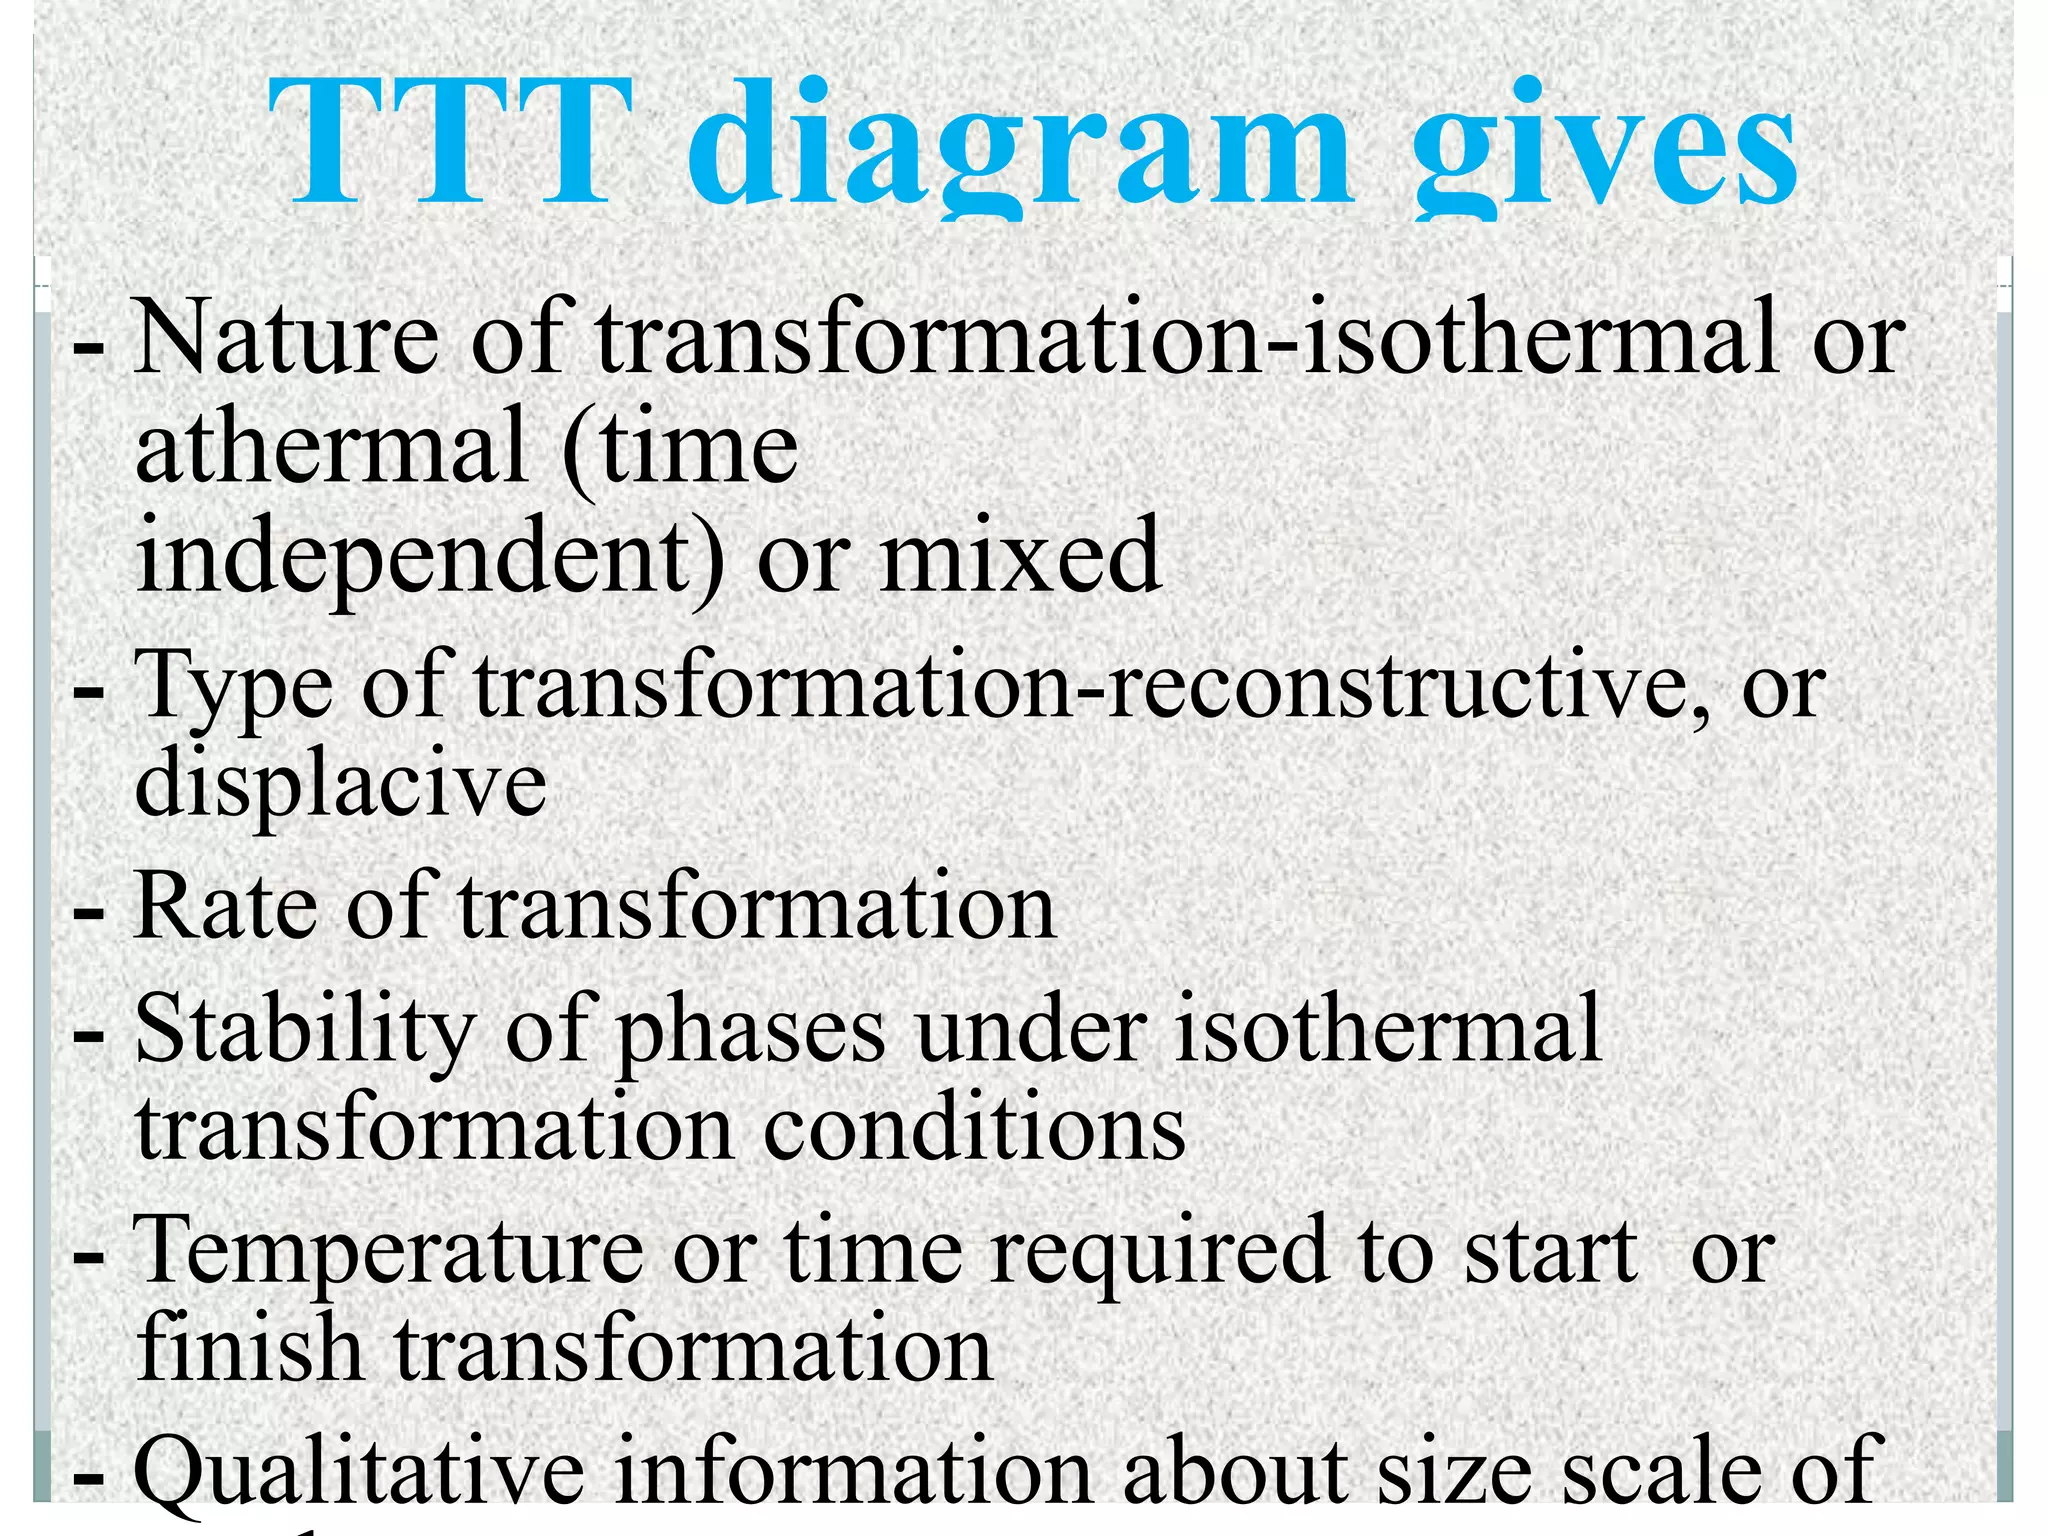


The document discusses time-temperature-transformation (TTT) diagrams, which show the kinetics of isothermal transformations in steel alloys. TTT diagrams plot temperature versus the logarithm of time and indicate when specific transformations start and end. They show that austenite is stable above the lower critical temperature but unstable below it. Depending on the cooling rate, austenite can transform into pearlite, bainite, or martensite. Slow cooling leads to full pearlite transformation, while very fast cooling results in full martensite formation. TTT diagrams provide information about transformation rates, temperatures, phases, and microstructure sizes.


