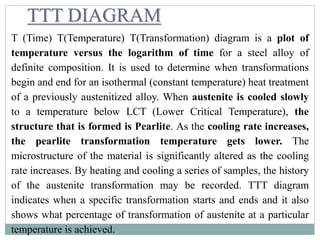
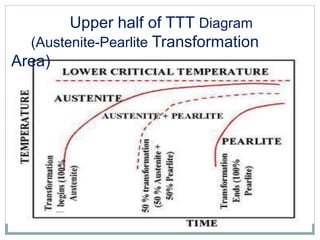
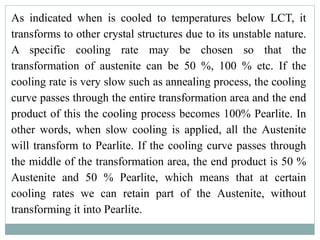
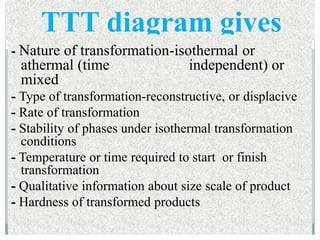
1) The document discusses TTT (time-temperature-transformation) diagrams, which show the kinetics of isothermal transformations by plotting temperature versus the logarithm of time.
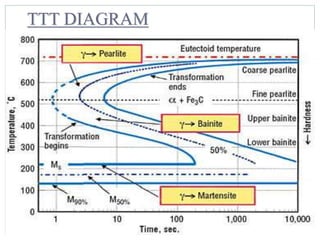
2) TTT diagrams indicate when specific transformations start and end for heat treatments, and what percentage of austenite transformation is achieved at different temperatures.
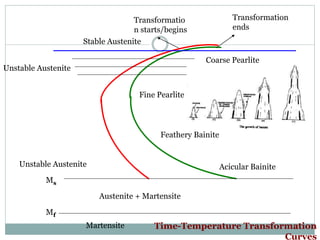
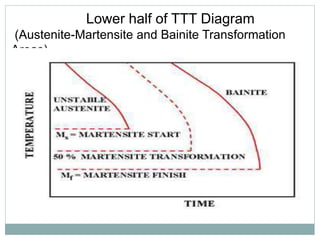
3) In the upper half of the TTT diagram, slower cooling allows full austenite to pearlite transformation, while faster cooling can retain some percentage of untransformed austenite. In the lower half, very fast cooling leads to full austenite to martensite transformation.