Downloaded 115 times


The document outlines the scientific method and experimental design. It describes the 5 main steps of the scientific method as: 1) making observations and asking questions, 2) forming a testable hypothesis, 3) conducting experiments to gather data, 4) analyzing the data, and 5) drawing a conclusion by accepting or rejecting the original hypothesis. It also explains key aspects of experimental design such as having an independent variable, dependent variable, and control group. The independent variable is the factor being manipulated, the dependent variable is the outcome being measured, and the control group is unchanged for comparison.
Overview of the scientific method outlining its systematic approach and reliance on fact-based observations.
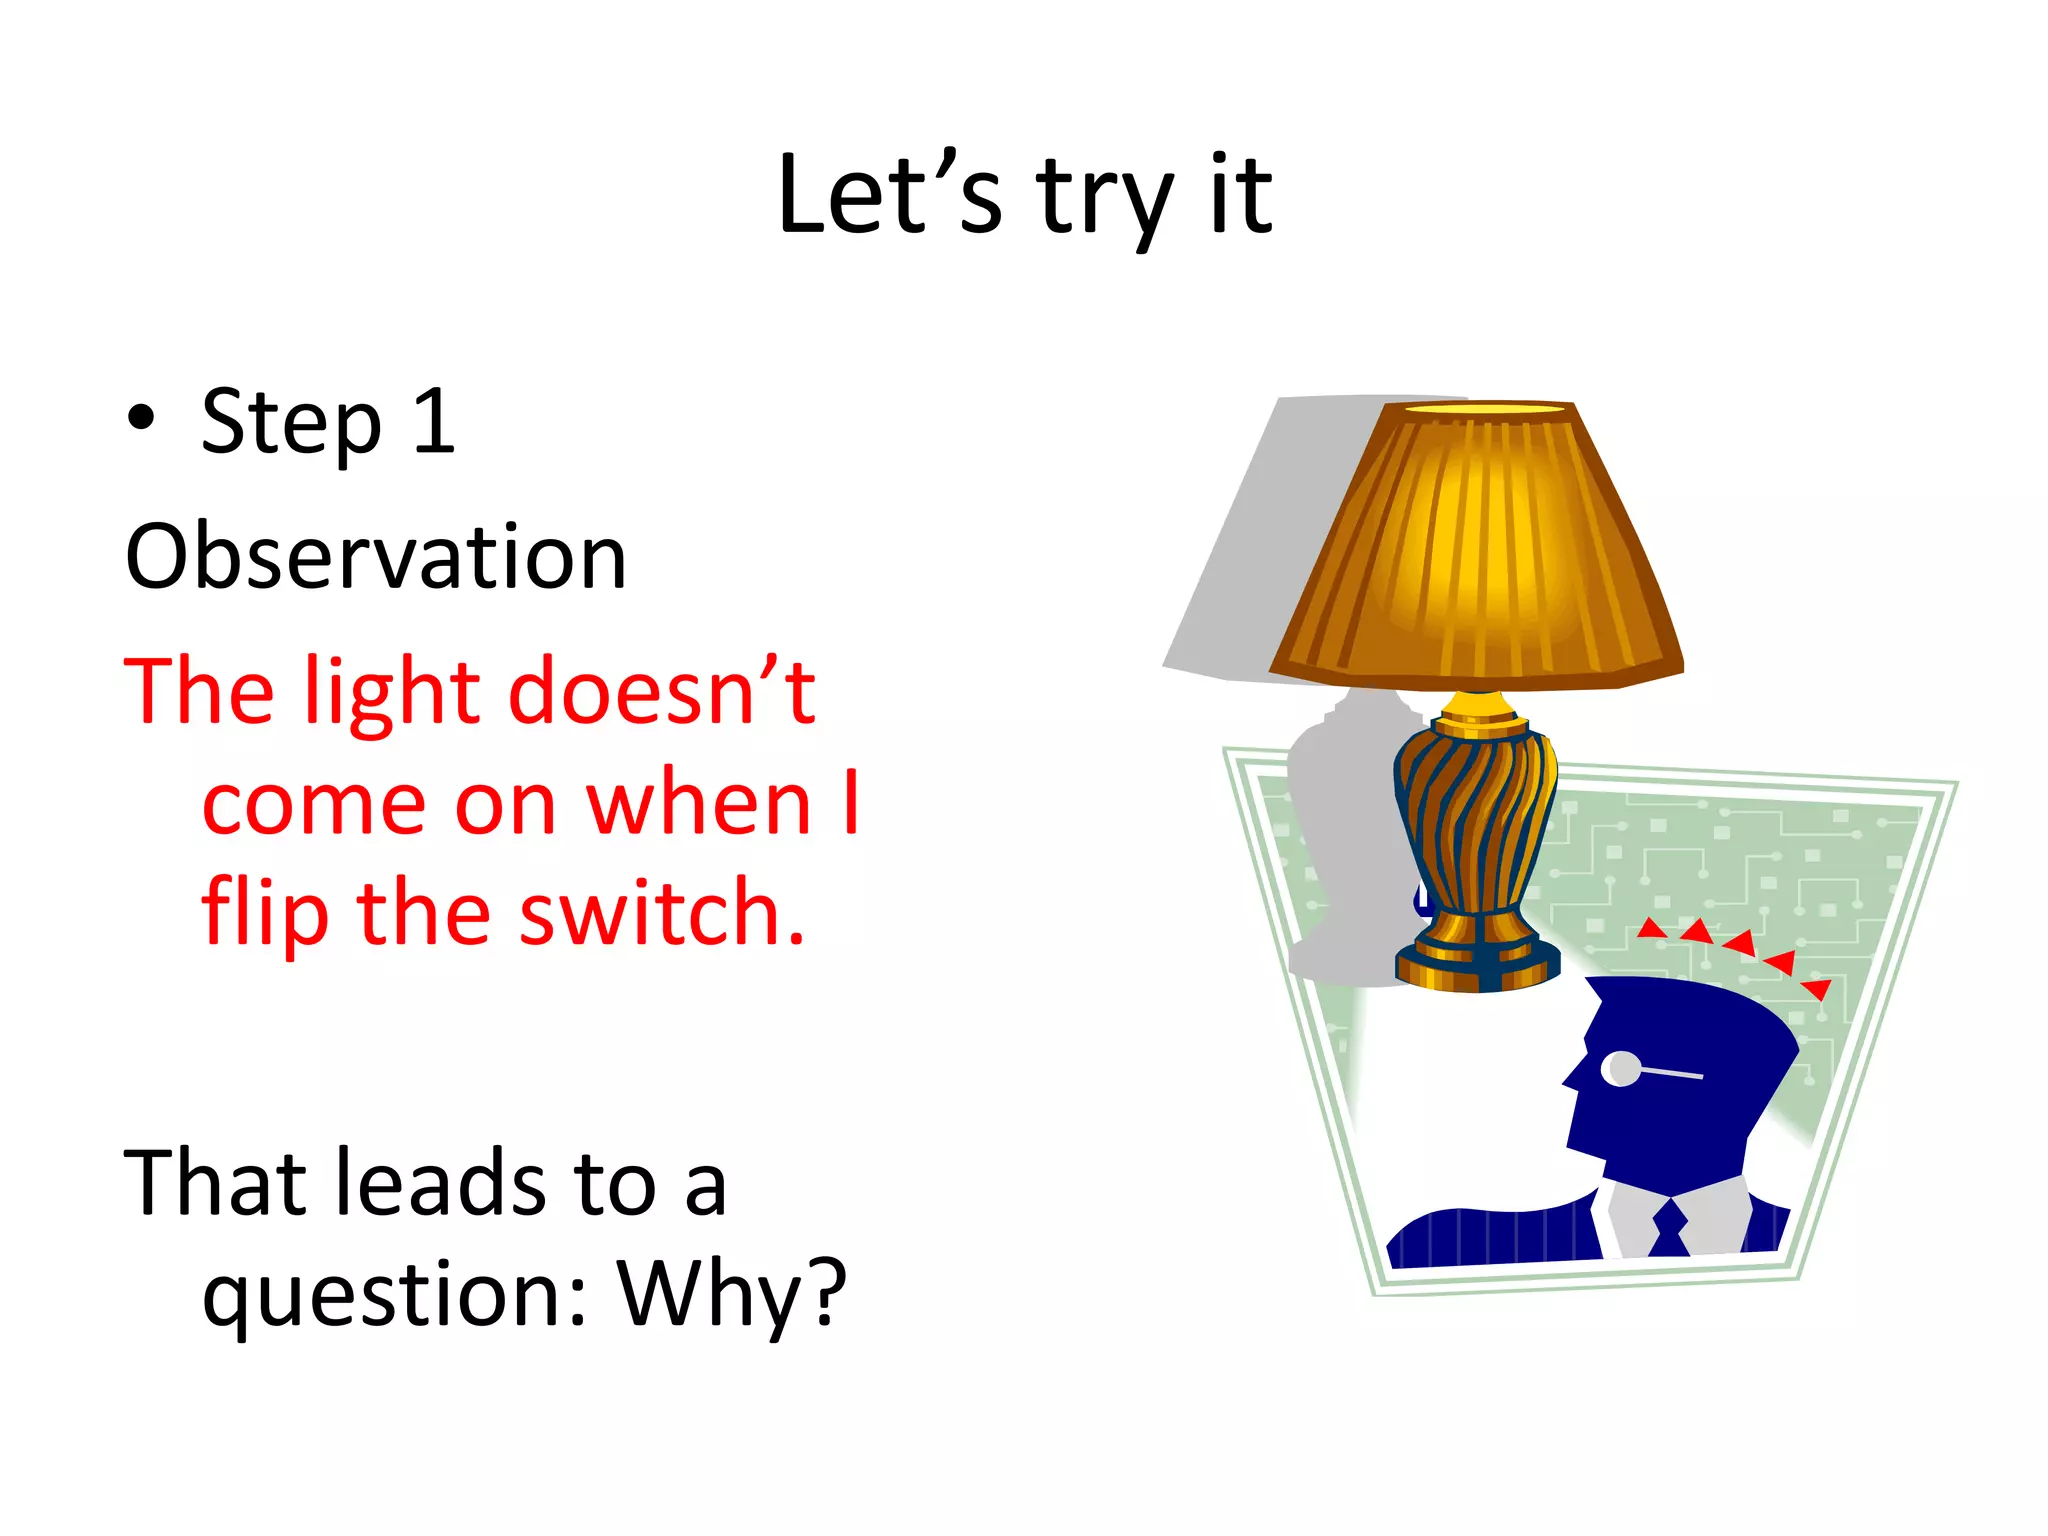
Describes the initial steps of observation leading to questions and forming testable hypotheses.
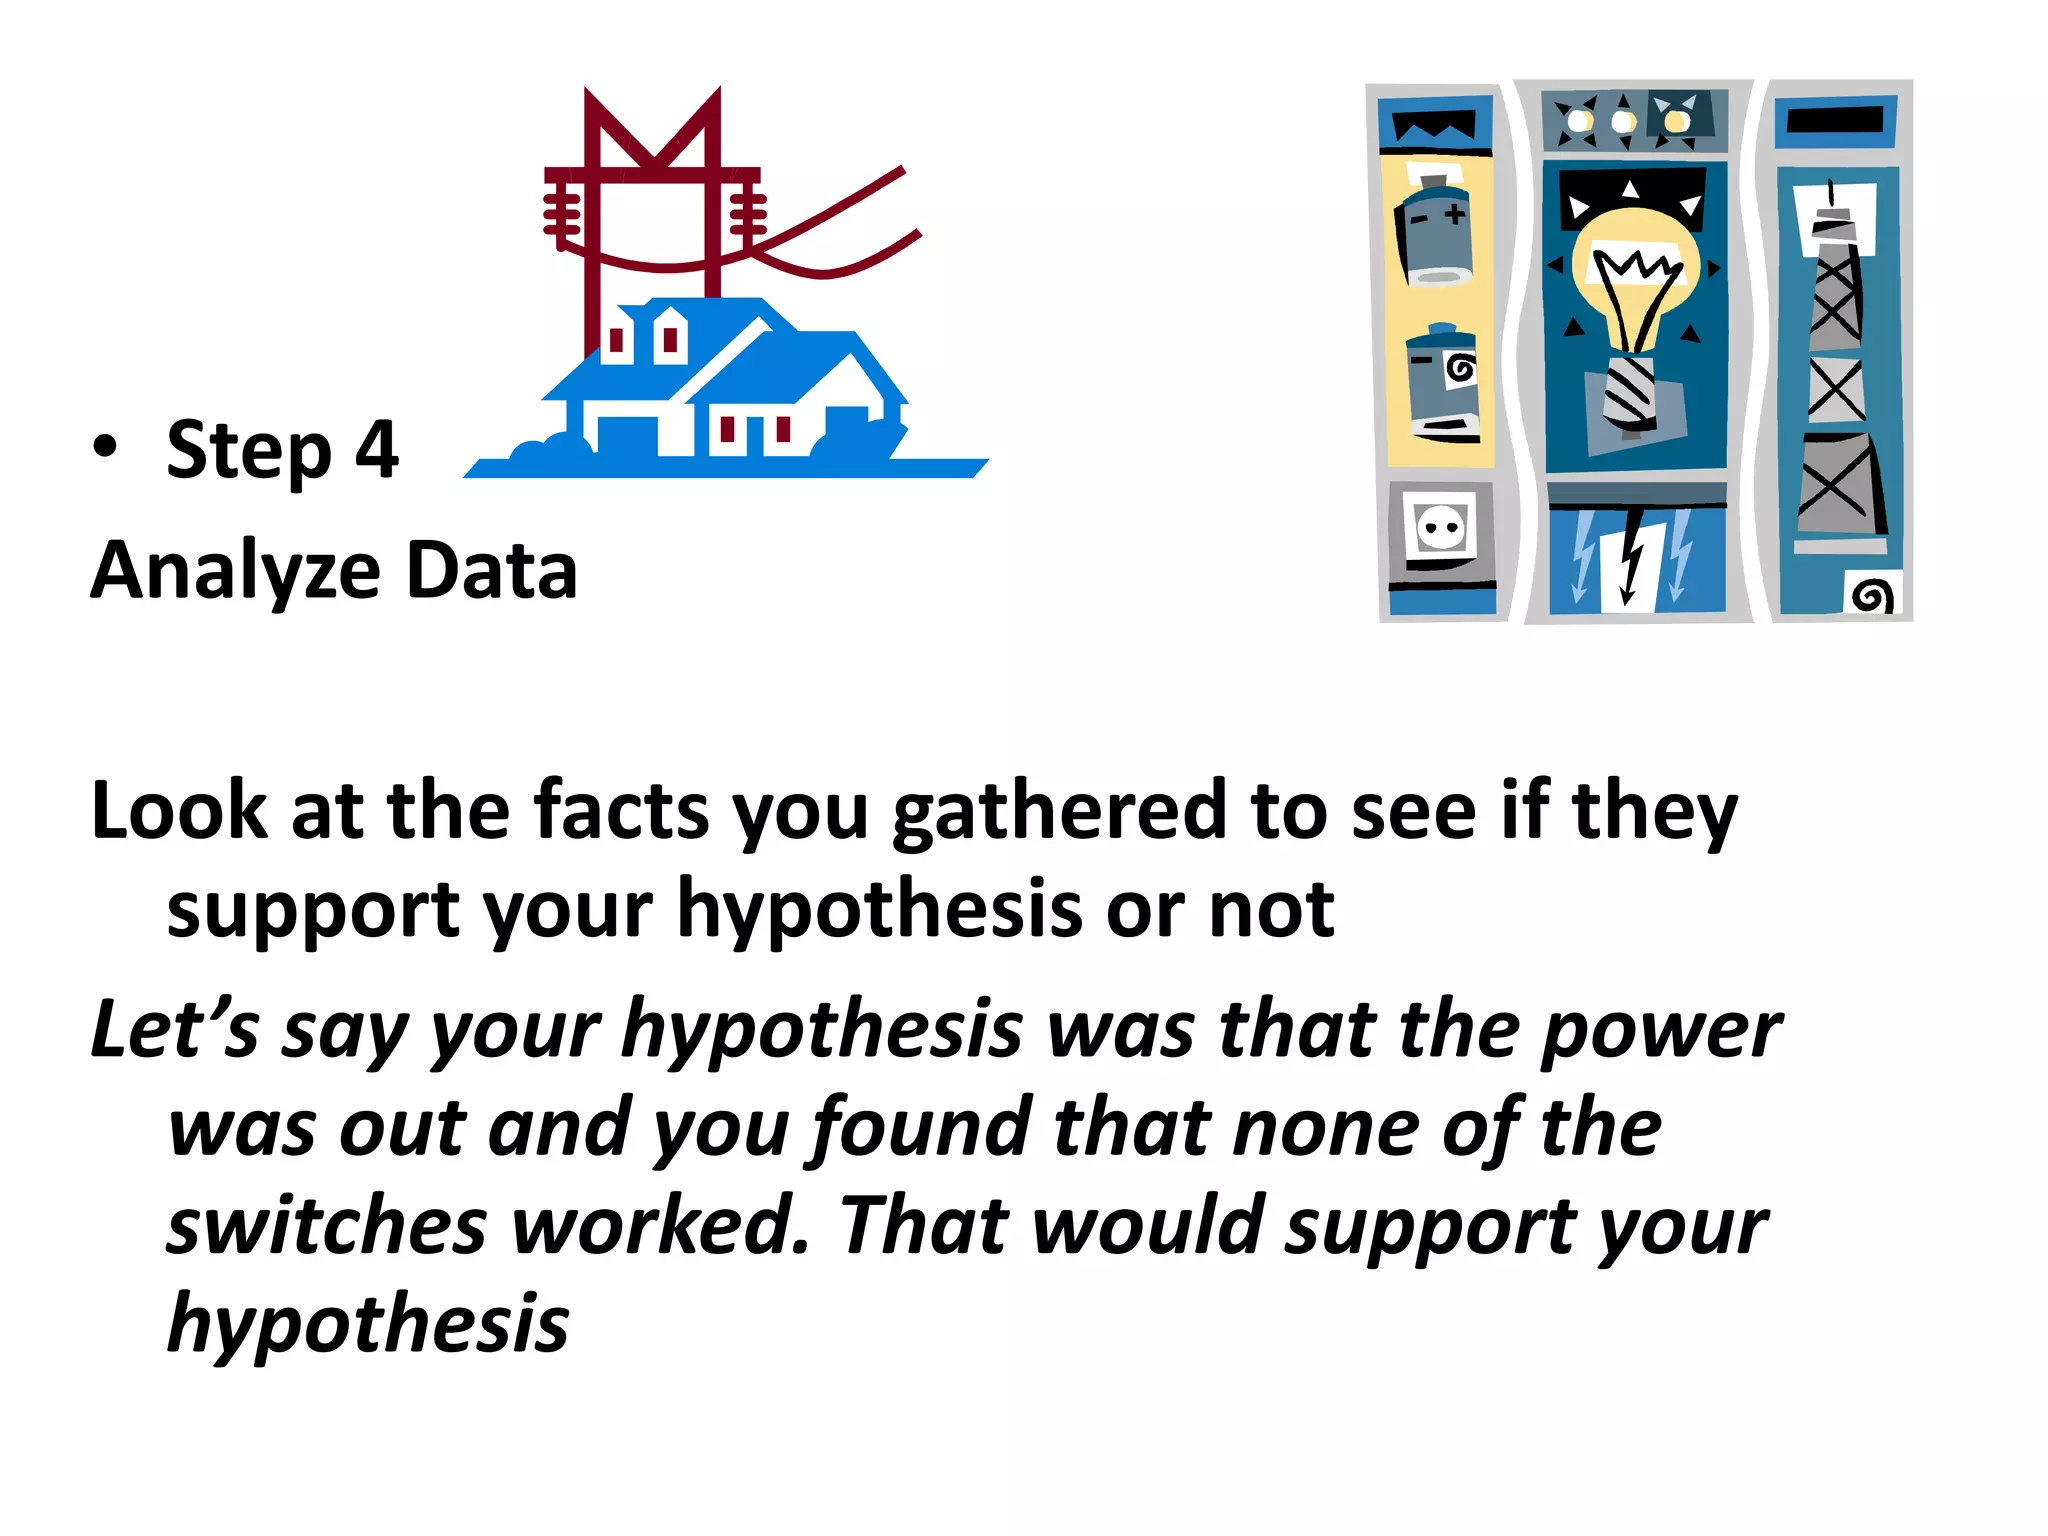
Steps for conducting experiments, gathering data, analyzing results, and concluding based on evidence.
Illustrates the scientific method through practical examples involving observation, hypothesis, and testing.
Key elements of designing experiments, including independent and dependent variables, and control groups.
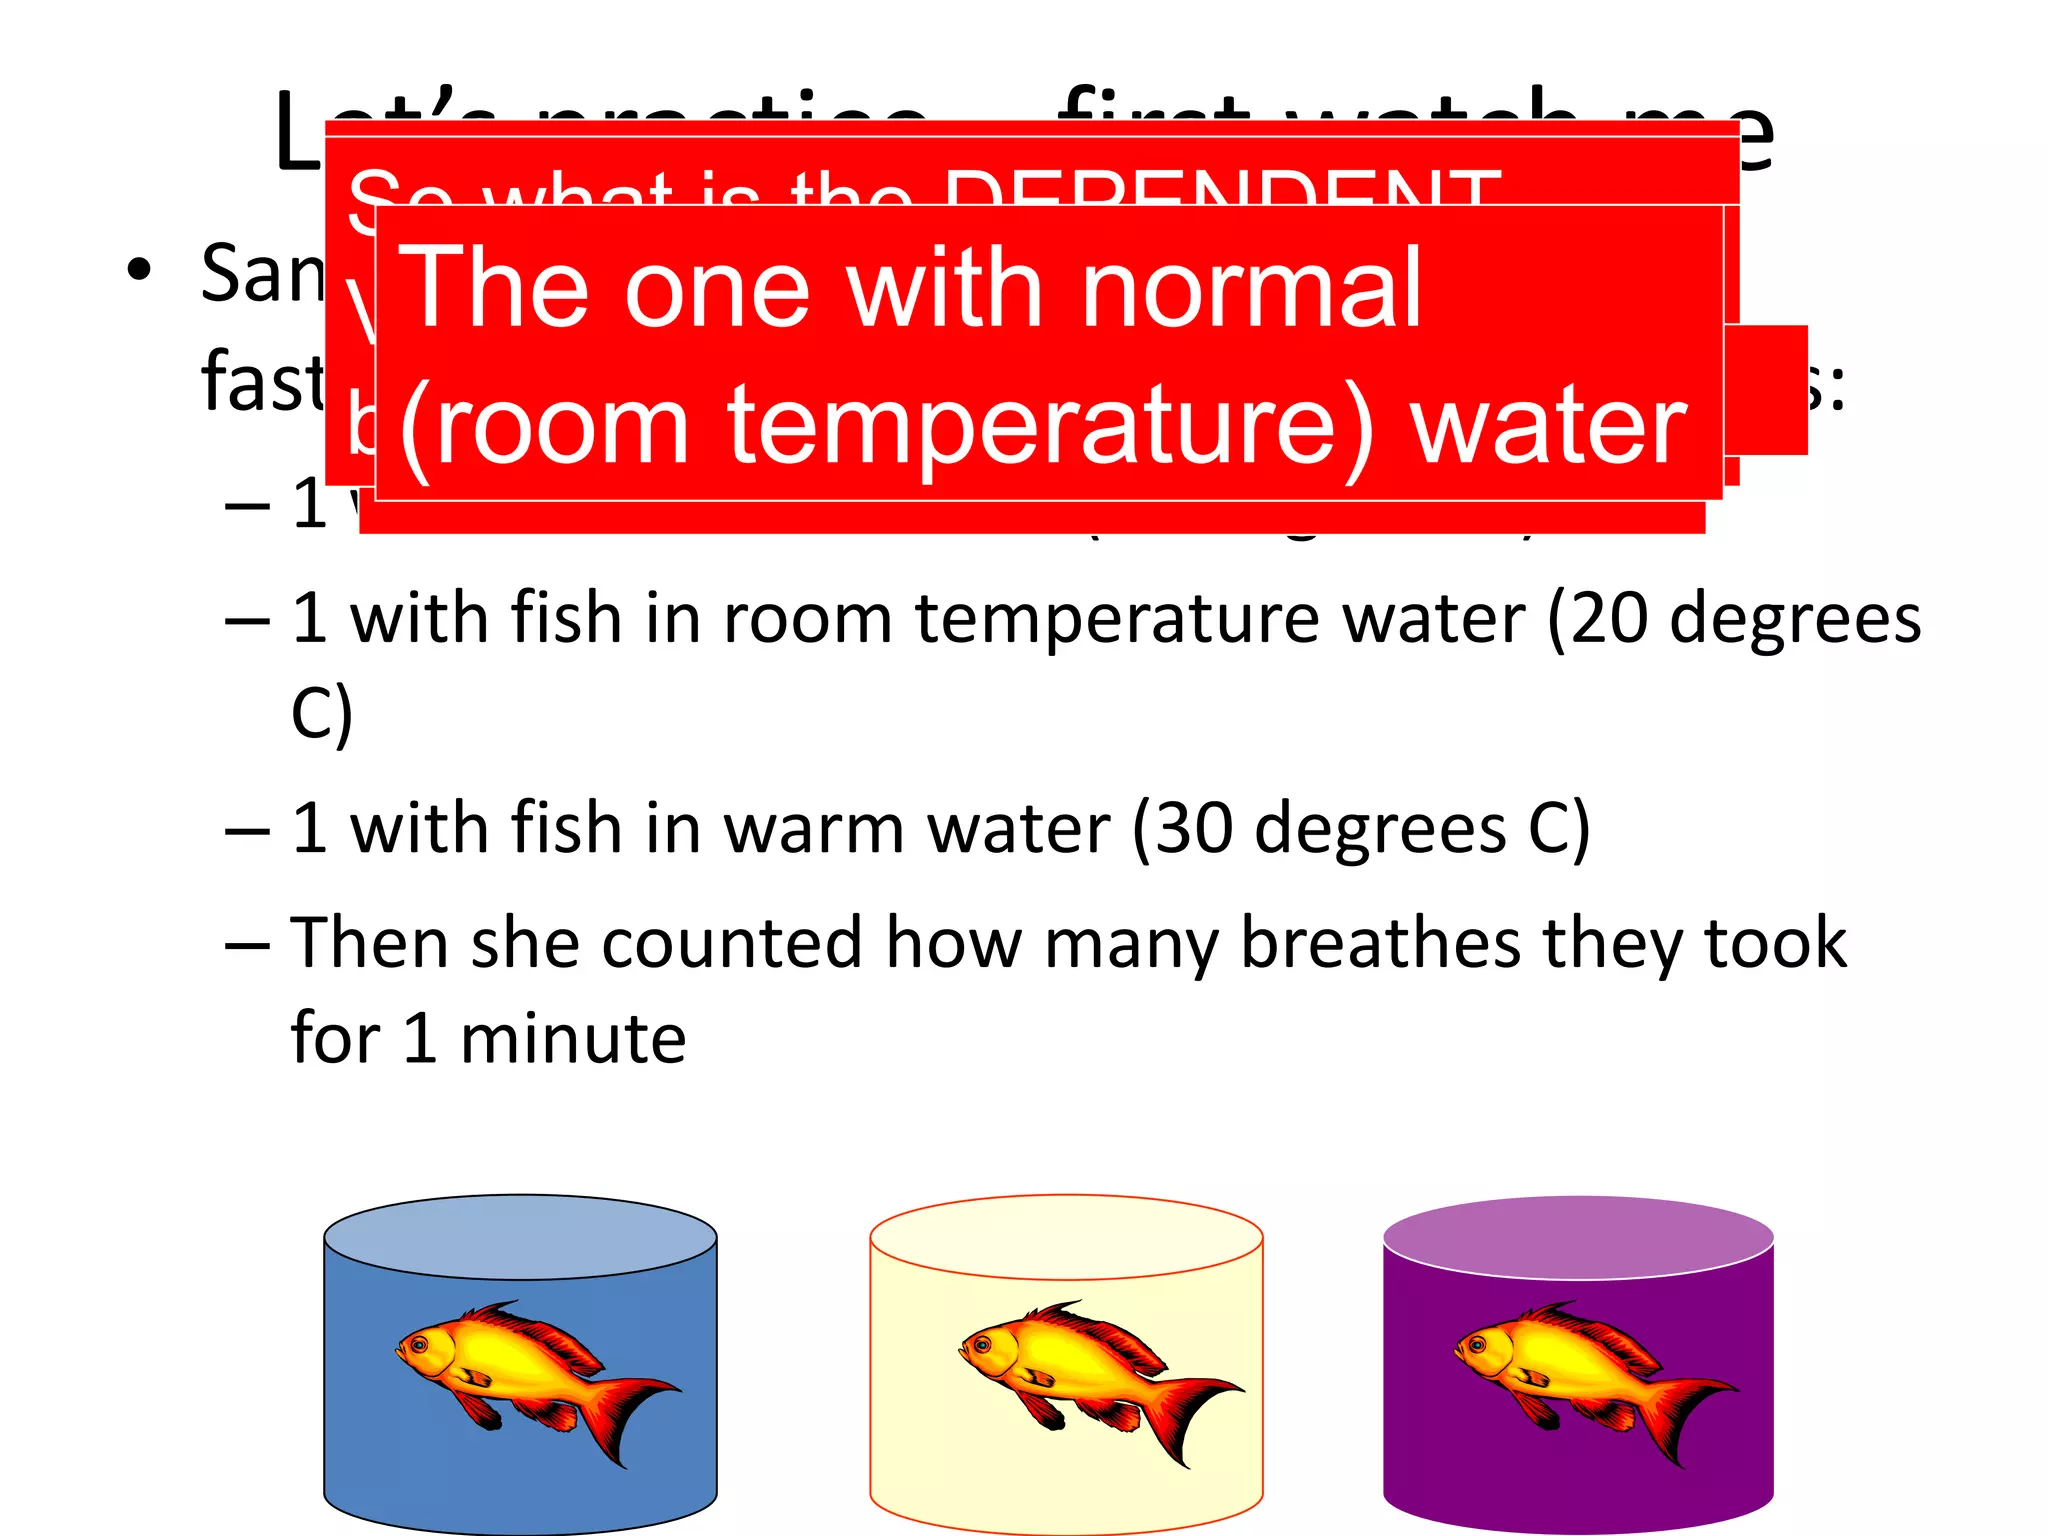
Examples of experimental design regarding fish breathing rates and strawberry plant fertilization.
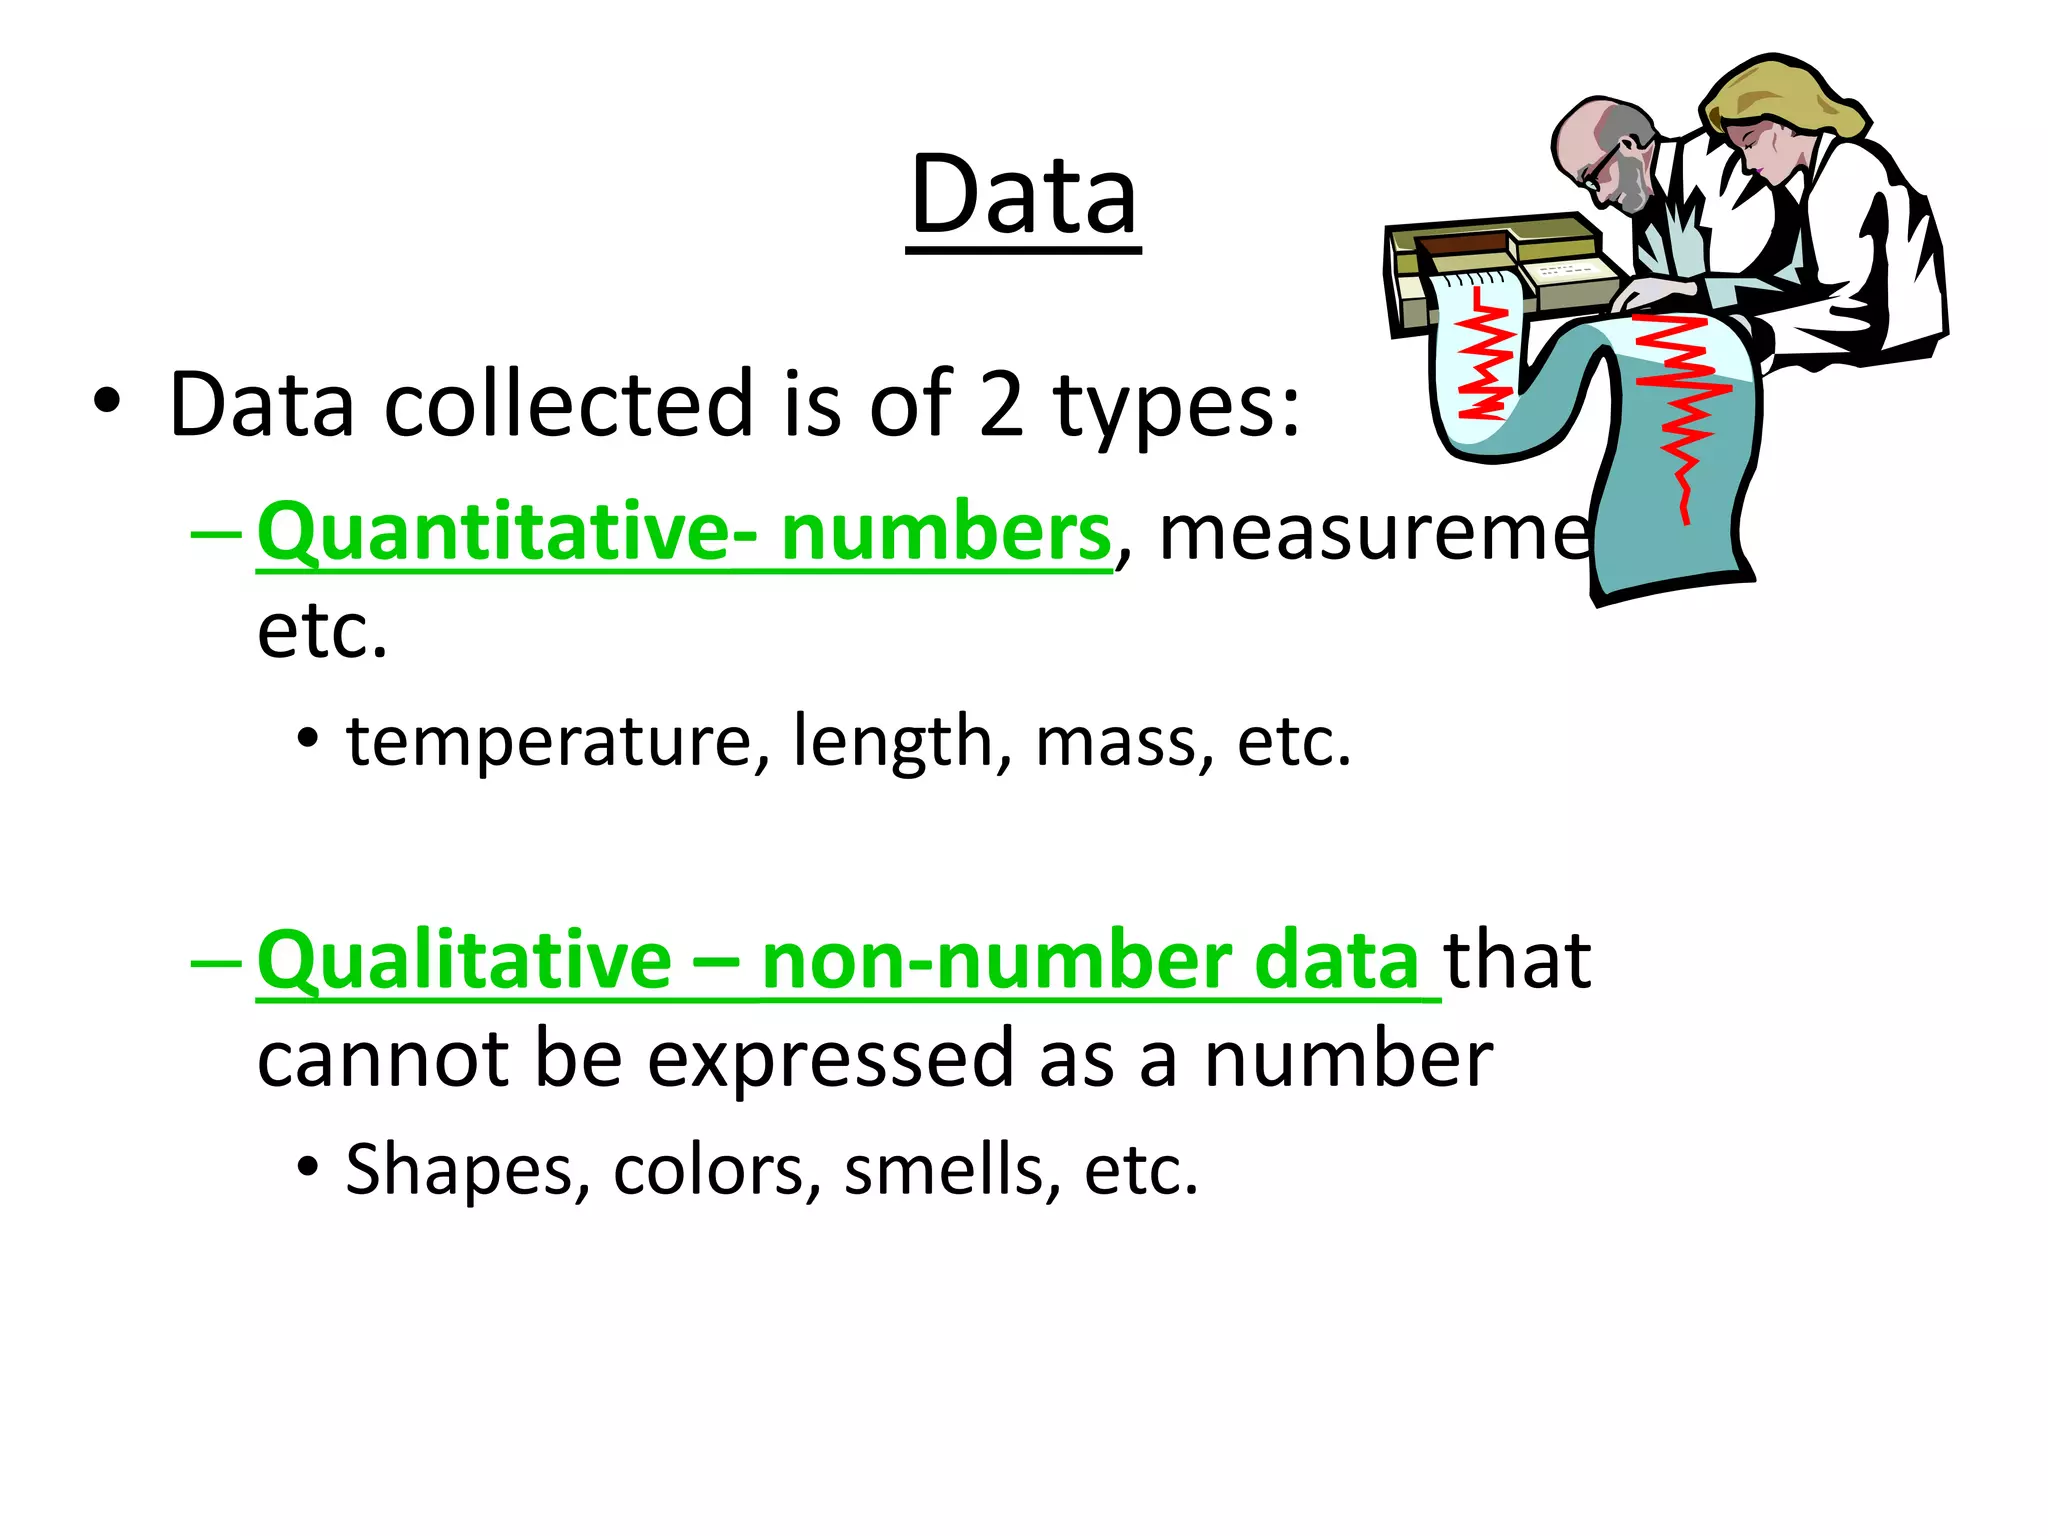
Classification and understanding of quantitative and qualitative data collected during experiments.
Identifies common mistakes in experiments including measurement inaccuracies and researcher bias.


