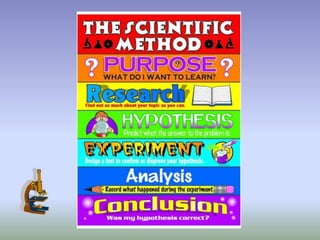
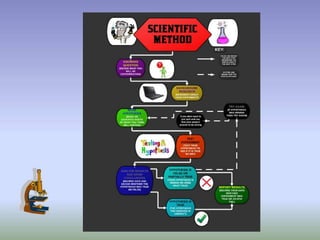
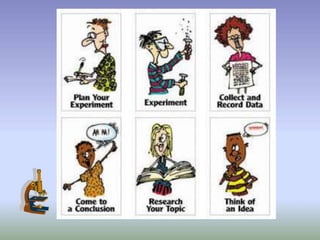
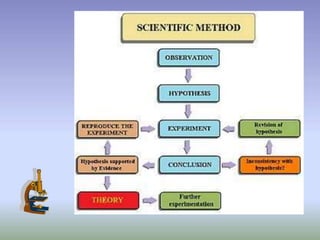
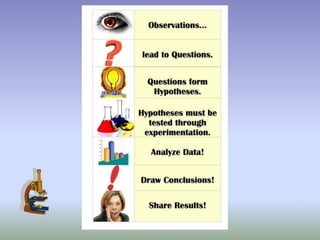
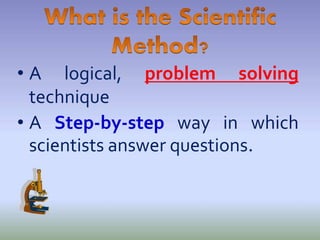
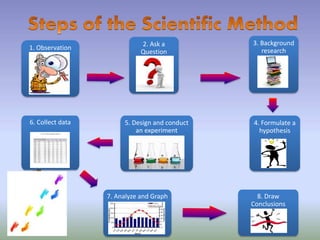
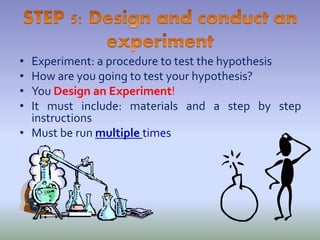
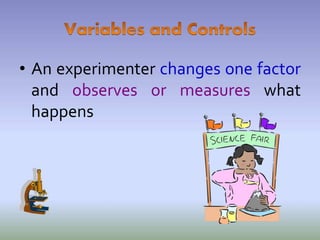
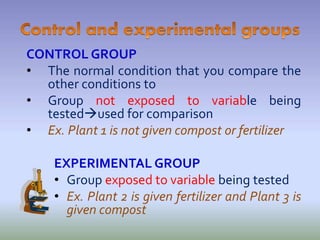
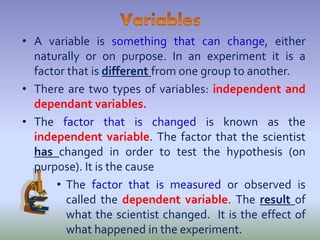
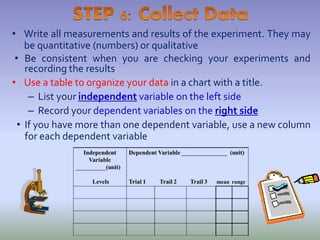
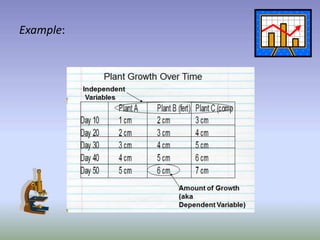
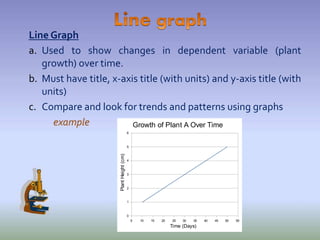
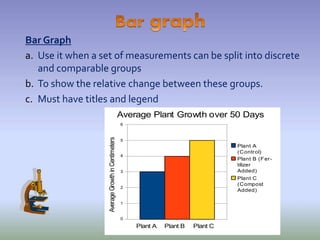
• A logical, problem solving
technique
• A Step-by-step way in which
scientists answer questions.
1. Observation
2. Ask a
Question
3. Background
research
5. Design and conduct
an experiment
6. Collect data
7. Analyze and Graph
Data
8. Draw
Conclusions
4. Formulate a
hypothesis
• You observe something in the material world,
using your senses or machines which are
basically extensions of those senses.
AH—Look at this!
• The problem identifies what you want to find out. State
the problem in the form of a question:
• Examples:
Ex. Do bean seeds grow faster when fed
compost or fertilizer?
How does __________ affect _______?
What is the effect of _______ on ________?
Why” and “What would happen if..” are also good
beginnings of scientific questions.
• They must be testable:
For example: Are Canaries prettier than blue birds?
Not testable
Scientists never start from scratch in putting together a plan for answering a
question. You should use library and Internet research to help you find the
best way to do things and insure that you don't repeat mistakes from the
past.
• Background research is necessary so that you know how to design and
understand your experiment and how to write a hypothesis.
• Use a table with the "question words" (why, how, who, what, when,
where) to generate research questions from your keywords.
For example:
When does a plant grow the most, with fertilizer or compost?
What plants are most suitable for my experiment?
How many plants must I use?
• Plan to do background research on the history of similar
experiments or inventions.
• Ask other people with more experience than yourself: your
parents and teachers.
• A hypothesis is NOT just an educated guess about
what you think will happen. It must beTESTABLE!!!!
a) Answers the observation and predicts an
outcome of the experiment.
b) “If… then… because” Statement
c) If…..independent variable,
then ….dependent variable
Ex. If given compost, then bean plants
will grow faster than those given fertilizer
• Experiment: a procedure to test the hypothesis
• How are you going to test your hypothesis?
• You Design an Experiment!
• It must include: materials and a step by step
instructions
• Must be run multiple times
• An experimenter changes one factor
and observes or measures what
happens
CONTROL GROUP
• The normal condition that you compare the
other conditions to
• Group not exposed to variable being
testedused for comparison
• Ex. Plant 1 is not given compost or fertilizer
EXPERIMENTAL GROUP
• Group exposed to variable being tested
• Ex. Plant 2 is given fertilizer and Plant 3 is
given compost
• A variable is something that can change, either
naturally or on purpose. In an experiment it is a
factor that is different from one group to another.
• There are two types of variables: independent and
dependant variables.
• The factor that is changed is known as the
independent variable. The factor that the scientist
has changed in order to test the hypothesis (on
purpose). It is the cause
• The factor that is measured or observed is
called the dependent variable. The result of
what the scientist changed. It is the effect of
what happened in the experiment.
The factor that the scientist has changed or
manipulated in order to test the hypothesis (on
purpose). It is the cause
Ex. Amount of Plant 1, Plant 2, Plant 3
• The result of what the scientist changed. It is
the effect of what happened in the
experiment
• It is measured in the experiment
• Changes because of the independent variable
• “Depends” on the independent variable
Ex. Plant growth
• They are what the scientist kept the same in
both the control group and the experimental
group
• Everything except the independent variable
• Keeps the experiment ‘fair’
• Ex: type of plant, type of soil…
• For example, suppose you want to figure out the
fastest route to walk home from school.
• You will try several different routes and time how
long it takes you to get home by each one.
• Since you are only interested in finding a route that
is fastest for you, you will do the walking yourself.
• Varying the route is the independent variable
• The time it takes is the dependent variable
• Keeping the same walker throughout makes
the walker a control variable.
• Write all measurements and results of the experiment. They may
be quantitative (numbers) or qualitative
• Be consistent when you are checking your experiments and
recording the results
• Use a table to organize your data in a chart with a title.
– List your independent variable on the left side
– Record your dependent variables on the right side
• If you have more than one dependent variable, use a new column
for each dependent variable
Example:
• Make the data table into a graph
• Graphs make it easier to see patterns in the data.
Graphs
X-axis independent variable
Y-axis dependent variable
Line Graph
a. Used to show changes in dependent variable (plant
growth) over time.
b. Must have title, x-axis title (with units) and y-axis title (with
units)
c. Compare and look for trends and patterns using graphs
example
5 10 15 20 25 30 35 40 45 50 55
0
1
2
3
4
5
6
Growth of Plant A Over Time
Time (Days)
PlantHeight(cm)
Bar Graph
a. Use it when a set of measurements can be split into discrete
and comparable groups
b. To show the relative change between these groups.
c. Must have titles and legend
0
1
2
3
4
5
6
Average Plant Growth over 50 Days
Plant A
(Control)
Plant B (Fer-
tilizer
Added)
Plant C
(Compost
Added)
Plant A Plant B Plant C
AverageGrowthinCentimeters
Pie Graph
a. When showing parts of a whole..i.e. percentages
b. Must have a title and a legend
• Indicate the results. Explain why those results
where given.
• Answer:
– Do your results/data support your hypothesis?
Why or why not?
– What are ways you can improve your data?
– What would you do differently if you were to
repeat the experiment?
Claim
a. Restate your hypothesis
b. Ex. If given compost, then bean plants will grow taller than those given
fertilizer.
Evidence
a. Accept or reject your hypothesis
b. Use the numbers from your chart and graph to explain why.
c. Ex. Plant C which was given only compost grew to a maximum height of
5 cm, Plant B which was given fertilizer grew to a maximum height of
4cm and Plant A which was given nothing at all grew to a maximum
height of 3cm. Therefore, the hypothesis is accepted.
Reasoning
a. Scientifically explain WHY what happened occurred.
b. Ex. Fertilizer contains only trace elements such as phosphorous,
nitrogen and sulphur while compost contains decaying matter
which can provide many complex organic nutrients for a bean
plant. Therefore, the plant treated with compost grows taller.
• When you write you conclusion, you will be
answering your research question, so make
sure you discuss how it was answered. Also
discuss your hypothesis, and if it was
supported or not. Make sure to have a very
clear statement of your final conclusion.
• Did you prove it?
• you cannot prove your hypothesis correct,
you can only support it
• make sure to discuss the data thatsupports
your thinking
• Data, data, data
• make sure to discuss the data, actually
use numbers with units to discuss your
findings refer to the table and graph to
help support your thoughts
• Research have you found information
elsewhere to support your ideas? if so,
then use a proper citation
• Your method probably wasn’t perfect, that’s ok, as long
as you discuss the issues. There are two types of errors
in your method, the first type is reliability.
• Reliability according to Worthen is “The measure of how
stable, dependable, trustworthy, and consistent a test is
in measuring the same thing each time (1993).
• Consistency did your method allow for a consistent set
of data to be collected, or did the measurements
change because of your method?
• two people measuring the same thing differently is an
issue with reliability
• Measuring tools
using poor tools to measure may affect reliability counting
out loud is not a very reliable way to measure time, a
stopwatch is much more reliable
• The second type of error in method is validity.
Worthen describes a method as being valid in “the degree to which
they accomplish the purpose for which they are being used” (1993).
Meaning, does your method actually measure what you are trying to
measure.
• Proper variables
make sure your variables are actually the correct ones to assess
what you’re trying to investigate
if you’re interested in health, is measuring someone’s weight the
most valid measurement, or would BMI be better?
• Proper tools
make sure your measurement tool is the proper way to measure
your variable
if you want to measure the change in acidity, then blue-red litmus
paper will not give you a valid set of data, you may need a pH probe
• A lab report MUST be written after every
investigation.
• A lab report contains the following parts:
1.Title
2. Introduction
3. Materials
4. Procedure
5. Results
6. Conclusions

Ppt scientific method

  • 10.
    • A logical,problem solving technique • A Step-by-step way in which scientists answer questions.
  • 11.
    1. Observation 2. Aska Question 3. Background research 5. Design and conduct an experiment 6. Collect data 7. Analyze and Graph Data 8. Draw Conclusions 4. Formulate a hypothesis
  • 12.
    • You observesomething in the material world, using your senses or machines which are basically extensions of those senses. AH—Look at this!
  • 13.
    • The problemidentifies what you want to find out. State the problem in the form of a question: • Examples: Ex. Do bean seeds grow faster when fed compost or fertilizer? How does __________ affect _______? What is the effect of _______ on ________? Why” and “What would happen if..” are also good beginnings of scientific questions. • They must be testable: For example: Are Canaries prettier than blue birds? Not testable
  • 14.
    Scientists never startfrom scratch in putting together a plan for answering a question. You should use library and Internet research to help you find the best way to do things and insure that you don't repeat mistakes from the past. • Background research is necessary so that you know how to design and understand your experiment and how to write a hypothesis. • Use a table with the "question words" (why, how, who, what, when, where) to generate research questions from your keywords. For example: When does a plant grow the most, with fertilizer or compost? What plants are most suitable for my experiment? How many plants must I use? • Plan to do background research on the history of similar experiments or inventions. • Ask other people with more experience than yourself: your parents and teachers.
  • 15.
    • A hypothesisis NOT just an educated guess about what you think will happen. It must beTESTABLE!!!! a) Answers the observation and predicts an outcome of the experiment. b) “If… then… because” Statement c) If…..independent variable, then ….dependent variable Ex. If given compost, then bean plants will grow faster than those given fertilizer
  • 16.
    • Experiment: aprocedure to test the hypothesis • How are you going to test your hypothesis? • You Design an Experiment! • It must include: materials and a step by step instructions • Must be run multiple times
  • 17.
    • An experimenterchanges one factor and observes or measures what happens
  • 18.
    CONTROL GROUP • Thenormal condition that you compare the other conditions to • Group not exposed to variable being testedused for comparison • Ex. Plant 1 is not given compost or fertilizer EXPERIMENTAL GROUP • Group exposed to variable being tested • Ex. Plant 2 is given fertilizer and Plant 3 is given compost
  • 19.
    • A variableis something that can change, either naturally or on purpose. In an experiment it is a factor that is different from one group to another. • There are two types of variables: independent and dependant variables. • The factor that is changed is known as the independent variable. The factor that the scientist has changed in order to test the hypothesis (on purpose). It is the cause • The factor that is measured or observed is called the dependent variable. The result of what the scientist changed. It is the effect of what happened in the experiment.
  • 20.
    The factor thatthe scientist has changed or manipulated in order to test the hypothesis (on purpose). It is the cause Ex. Amount of Plant 1, Plant 2, Plant 3
  • 21.
    • The resultof what the scientist changed. It is the effect of what happened in the experiment • It is measured in the experiment • Changes because of the independent variable • “Depends” on the independent variable Ex. Plant growth
  • 22.
    • They arewhat the scientist kept the same in both the control group and the experimental group • Everything except the independent variable • Keeps the experiment ‘fair’ • Ex: type of plant, type of soil…
  • 23.
    • For example,suppose you want to figure out the fastest route to walk home from school. • You will try several different routes and time how long it takes you to get home by each one. • Since you are only interested in finding a route that is fastest for you, you will do the walking yourself. • Varying the route is the independent variable • The time it takes is the dependent variable • Keeping the same walker throughout makes the walker a control variable.
  • 24.
    • Write allmeasurements and results of the experiment. They may be quantitative (numbers) or qualitative • Be consistent when you are checking your experiments and recording the results • Use a table to organize your data in a chart with a title. – List your independent variable on the left side – Record your dependent variables on the right side • If you have more than one dependent variable, use a new column for each dependent variable
  • 25.
  • 26.
    • Make thedata table into a graph • Graphs make it easier to see patterns in the data. Graphs X-axis independent variable Y-axis dependent variable
  • 27.
    Line Graph a. Usedto show changes in dependent variable (plant growth) over time. b. Must have title, x-axis title (with units) and y-axis title (with units) c. Compare and look for trends and patterns using graphs example 5 10 15 20 25 30 35 40 45 50 55 0 1 2 3 4 5 6 Growth of Plant A Over Time Time (Days) PlantHeight(cm)
  • 28.
    Bar Graph a. Useit when a set of measurements can be split into discrete and comparable groups b. To show the relative change between these groups. c. Must have titles and legend 0 1 2 3 4 5 6 Average Plant Growth over 50 Days Plant A (Control) Plant B (Fer- tilizer Added) Plant C (Compost Added) Plant A Plant B Plant C AverageGrowthinCentimeters
  • 29.
    Pie Graph a. Whenshowing parts of a whole..i.e. percentages b. Must have a title and a legend
  • 30.
    • Indicate theresults. Explain why those results where given. • Answer: – Do your results/data support your hypothesis? Why or why not? – What are ways you can improve your data? – What would you do differently if you were to repeat the experiment?
  • 31.
    Claim a. Restate yourhypothesis b. Ex. If given compost, then bean plants will grow taller than those given fertilizer. Evidence a. Accept or reject your hypothesis b. Use the numbers from your chart and graph to explain why. c. Ex. Plant C which was given only compost grew to a maximum height of 5 cm, Plant B which was given fertilizer grew to a maximum height of 4cm and Plant A which was given nothing at all grew to a maximum height of 3cm. Therefore, the hypothesis is accepted. Reasoning a. Scientifically explain WHY what happened occurred. b. Ex. Fertilizer contains only trace elements such as phosphorous, nitrogen and sulphur while compost contains decaying matter which can provide many complex organic nutrients for a bean plant. Therefore, the plant treated with compost grows taller.
  • 32.
    • When youwrite you conclusion, you will be answering your research question, so make sure you discuss how it was answered. Also discuss your hypothesis, and if it was supported or not. Make sure to have a very clear statement of your final conclusion. • Did you prove it? • you cannot prove your hypothesis correct, you can only support it • make sure to discuss the data thatsupports your thinking
  • 33.
    • Data, data,data • make sure to discuss the data, actually use numbers with units to discuss your findings refer to the table and graph to help support your thoughts • Research have you found information elsewhere to support your ideas? if so, then use a proper citation
  • 34.
    • Your methodprobably wasn’t perfect, that’s ok, as long as you discuss the issues. There are two types of errors in your method, the first type is reliability. • Reliability according to Worthen is “The measure of how stable, dependable, trustworthy, and consistent a test is in measuring the same thing each time (1993). • Consistency did your method allow for a consistent set of data to be collected, or did the measurements change because of your method? • two people measuring the same thing differently is an issue with reliability • Measuring tools using poor tools to measure may affect reliability counting out loud is not a very reliable way to measure time, a stopwatch is much more reliable
  • 35.
    • The secondtype of error in method is validity. Worthen describes a method as being valid in “the degree to which they accomplish the purpose for which they are being used” (1993). Meaning, does your method actually measure what you are trying to measure. • Proper variables make sure your variables are actually the correct ones to assess what you’re trying to investigate if you’re interested in health, is measuring someone’s weight the most valid measurement, or would BMI be better? • Proper tools make sure your measurement tool is the proper way to measure your variable if you want to measure the change in acidity, then blue-red litmus paper will not give you a valid set of data, you may need a pH probe
  • 36.
    • A labreport MUST be written after every investigation. • A lab report contains the following parts: 1.Title 2. Introduction 3. Materials 4. Procedure 5. Results 6. Conclusions