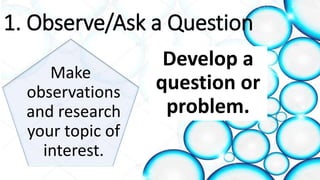
1. Observe/Ask aQuestion
Develop a
question or
problem.
Make
observations
and research
your topic of
interest.
9.
1. Observe/Ask aQuestion
"What am I
interested
in?"
"What subject do
I want to learn
about?"
10.
Example 1: Johnwatches his Grandma bake
bread. Grandma explains that yeast eats
sugar in the bread dough and releases gas
which makes the bread rise.
John wonders – Will the amount of sugar in
the recipe affect the size of a bread loaf?
1. Observe/Ask a Question
11.
1. Observe/Ask aQuestion
Example 2: For the past days of acid
raining, Leah discovered some of
her plants are dying, and some are
wilted.
She asked herself, how does acid
rain affect plant growth?
Dependent Variable –responds to
changes you made with the independent
variable
Independent variable – you can change
or manipulate in an experiment
Controlled variable – kept constant
during the experiment
16.
You design an
experimenttesting
the effects of
temperature on the
volume of Helium
gas in a balloon.
IV
DV
CV
Temperature
Volume of
He gas
Type of gas,
type of
balloon
Sample:
17.
Sample:
You want to
testif the type
of water will
affect the
plant growth
IV
DV
CV
Type of water
Plant growth
Type of plant
18.
2. Formulate aHypothesis
A clear
statement of
what you expect
the answer to
your question to
be.
Which one soundslike a
hypothesis?
a.Eating sweetcorn causes weight loss.
b.Eating sweetcorn will help you lose
weight..
c.Eating sweetcorn may help you lose
weight..
Proper Form
If-Then FORMAT
Ifsweetcorn helps in the process
of weight loss, then a person
who eats more sweetcorn will
tend to lose weight faster.
IV
DV
CV
Proper Form
If skincancer is related to UV light,
then people with prolonged
exposure to UV light will have
skin cancer.
IV
DV
CV
25.
2. Formulate aHypothesis
Follow the If, Then method…
Example 1: “If the amount of sugar affects
the bread loaf size, then more sugar will yield
to bigger bread..”
Example 2: “If the amount of acid rain
inhibits the growth of the plant, then the
plant will wilt and become shorter than
26.
Steps
1. Observe/Ask aquestion
2. Formulate a hypothesis
3. Design and perform an
experiment
4. Analyze data and results
5. Draw a conclusion
27.
Review
•Uncle Jerry wantsto test
what type of worm will the
yellowfin fish eat faster in
the hook of the fishing rod.
https://www.mentimeter.com/s/717b5e6e3ea0bad7e
58cfb6390eae864/d441da1012f3
28.
Steps
1. Observe/Ask aquestion
2. Formulate a hypothesis
3. Design and perform an
experiment
4. Analyze data and results
5. Draw a conclusion
29.
What is anExperiment?
https://www.mentimeter.com/s/b2eedddf2ca0507cefeee2c06be90848/d27558
258d18
30.
•It tests thehypothesis
•It demonstrates fair testing…
•Has more than one trial or
group
31.
•Example 1:
•Controlled: Thereis 100 grams of sugar
added to the dough.
•Experimental 1: There is 200 grams of sugar
added to the dough.
•Experimental 2: There is 300 grams of sugar
added to the dough.
3. Design and Perform
32.
•Example 2:
•Controlled: Aplant is watered
with normal water.
•Experimental: A plant is
watered with acid rain.
3. Design and Perform an Experiment
33.
Steps
1. Observe/Ask aquestion
2. Formulate a hypothesis
3. Design and perform an
experiment
4. Analyze data and results
5. Draw a conclusion
•Among the threeset-ups, set-up
1 got the highest volume of
bread (1612 cm³). Set-up 1 got
1344 cm³, while set-up 2 got
1380 cm³.
36.
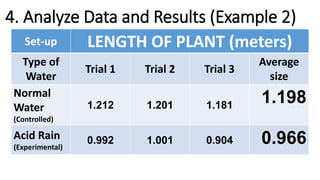
4. Analyze Dataand Results (Example 2)
Set-up LENGTH OF PLANT (meters)
Type of
Water
Trial 1 Trial 2 Trial 3
Average
size
Normal
Water
(Controlled)
1.212 1.201 1.181
1.198
Acid Rain
(Experimental)
0.992 1.001 0.904 0.966
37.
4. Analyze Dataand Results
•With the use of normal
water, the plant gets to grow
taller than the acid rain-
watered plant, having 1.198
m compared to 0.966 m.
38.
Steps
1. Observe/Ask aquestion
2. Formulate a hypothesis
3. Design and perform an
experiment
4. Analyze data and results
5. Draw a conclusion