Downloaded 880 times


![Useful references…
1. A Brief Introduction to Design of Experiments by
Jacqueline K. Telford
[Retrieved from
www.jhuapl.edu/techdigest/TD/td2703/telford.pdf]
2. Design and Analysis of Experiments (John Wiley &
Sons, Inc.) by Douglas C. Montgomery
31](https://image.slidesharecdn.com/introtodoebytecknamang-141217215049-conversion-gate02/75/Introduction-to-Design-of-Experiments-by-Teck-Nam-Ang-University-of-Malaya-31-2048.jpg)


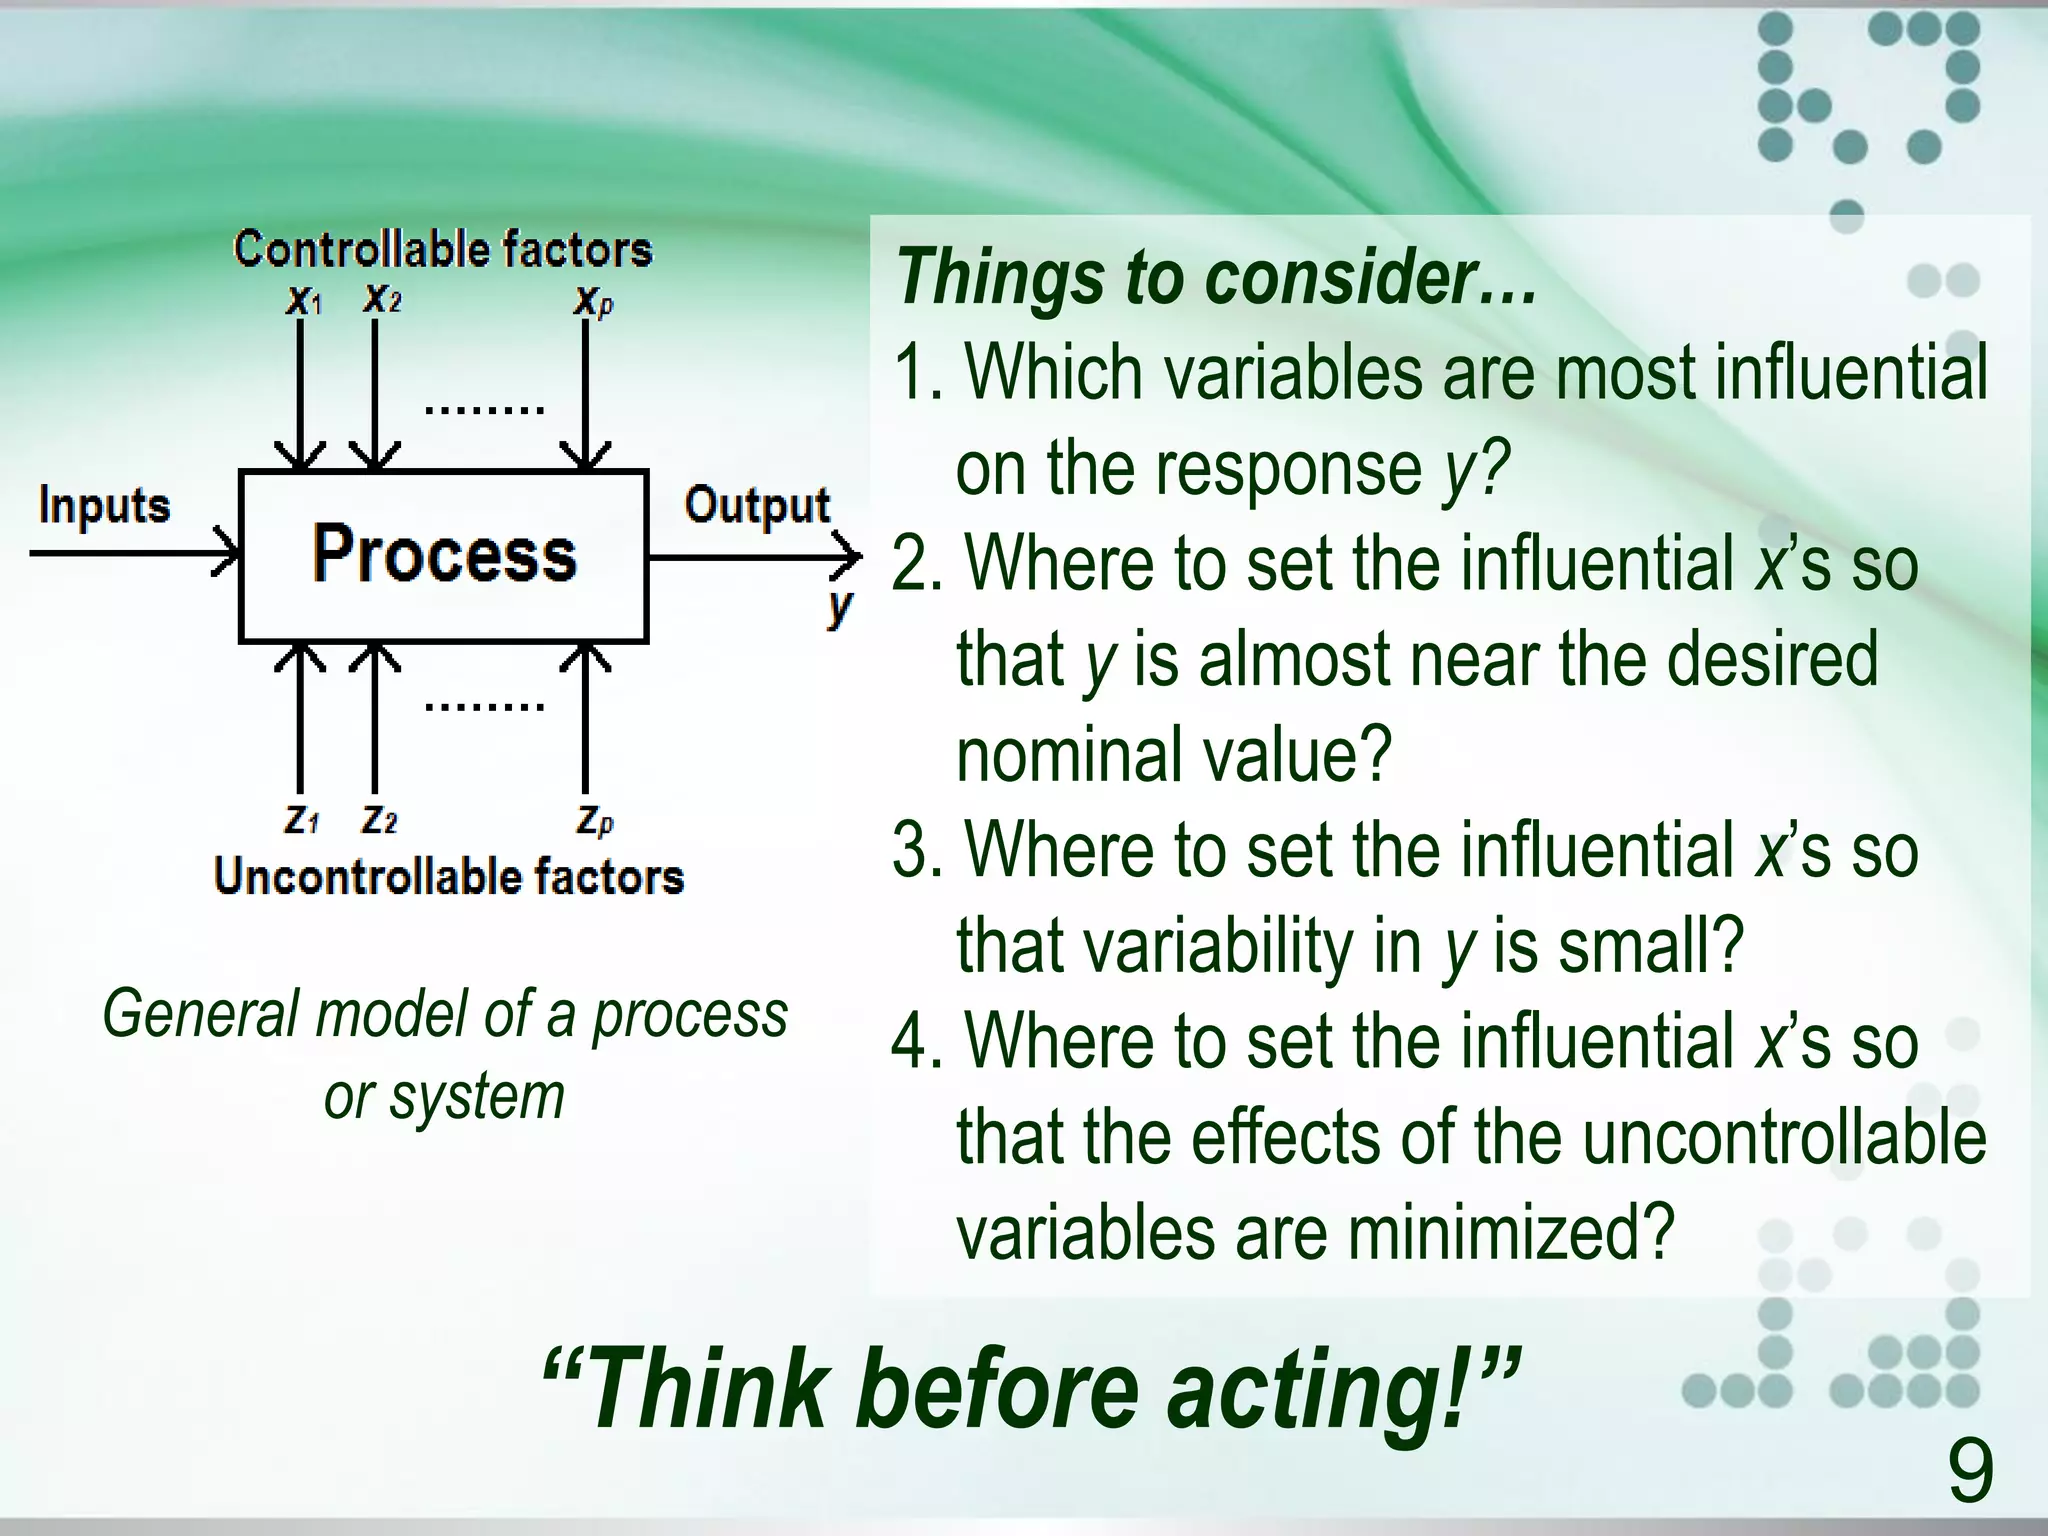
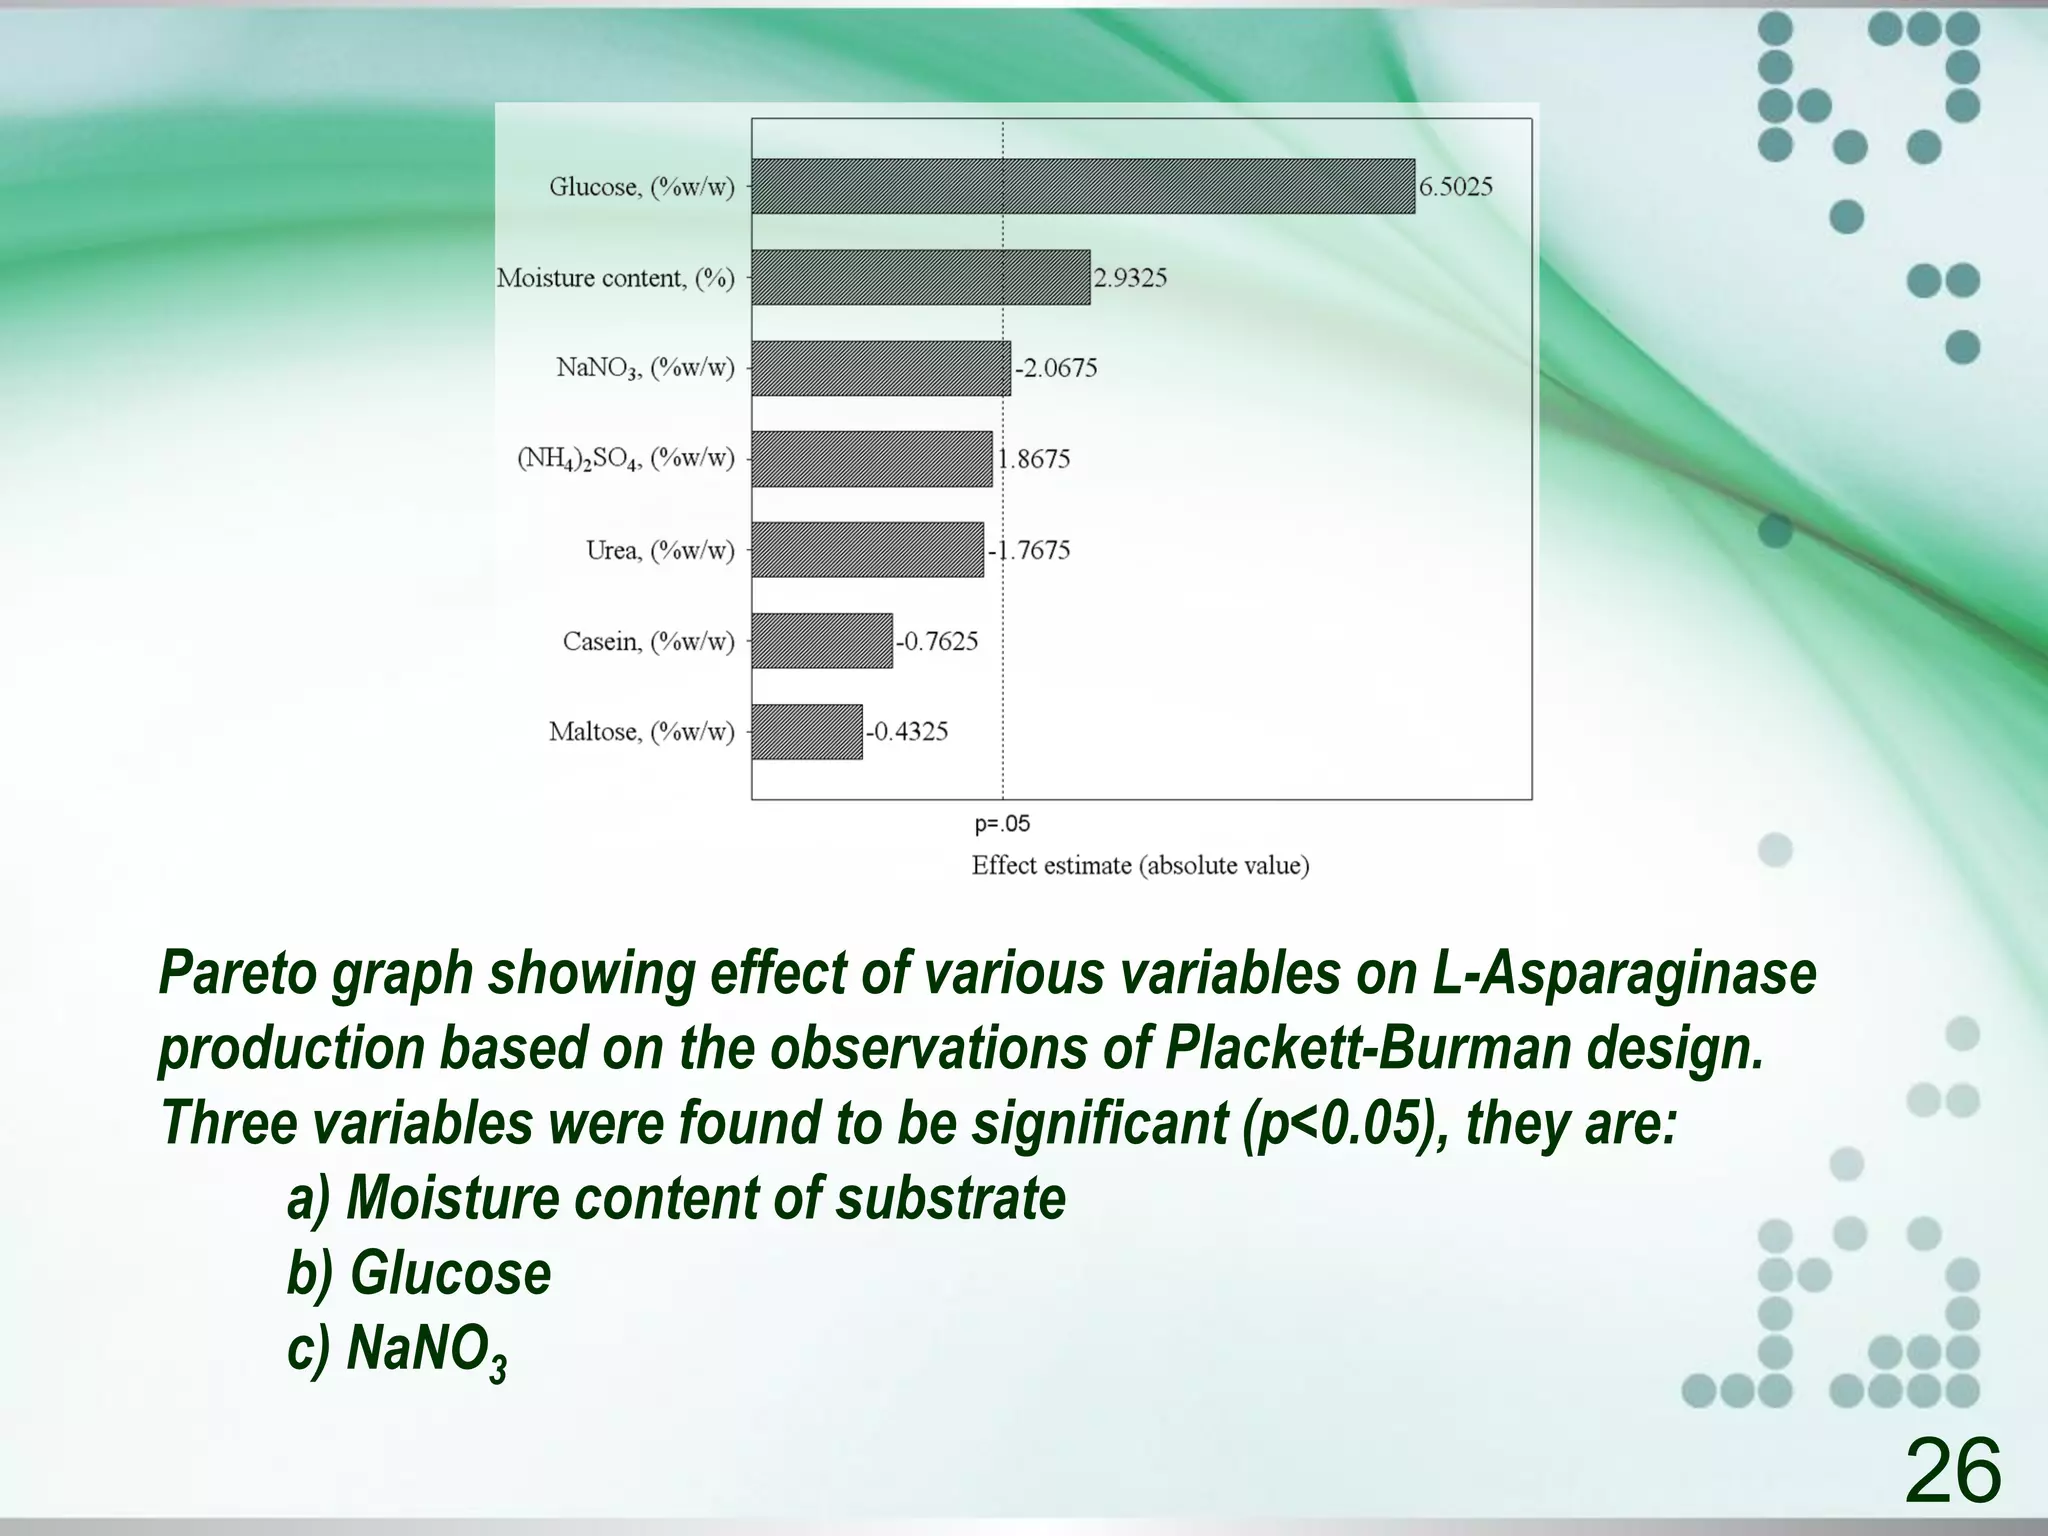
The document presents an introduction to the design of experiments, outlining its purpose, strategies, and planning guidelines. It emphasizes the importance of a well-designed experimental plan to maximize information and control reliability, and provides various methodologies like factorial experiments and response surface methodology for optimizing processes. Additionally, it highlights the significance of statistical analysis and offers examples of experimental designs, such as the Plackett-Burman design and its application in optimizing l-asparaginase production.