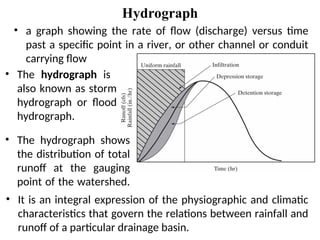
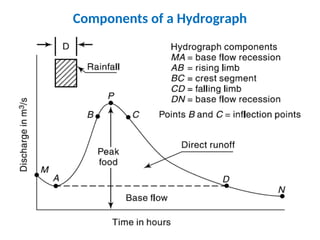
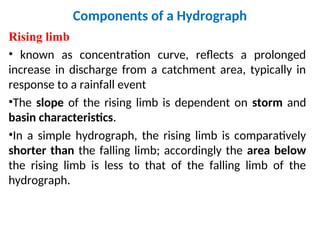
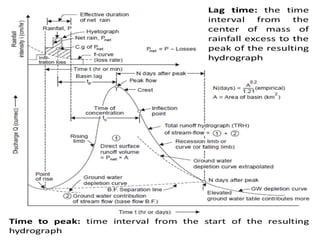
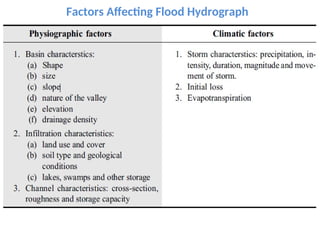
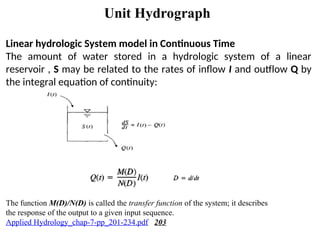
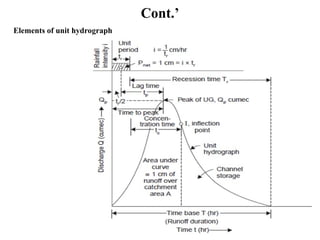
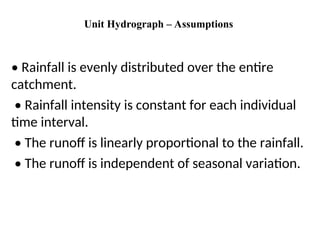
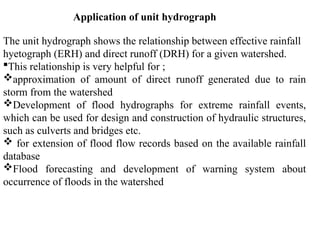
CHAPTER 7 - HYDROGRAPH
Hydrograph
• a graph showing the rate of flow (discharge) versus time
past a specific point in a river, or other channel or conduit
carrying flow
• The hydrograph is
also known as storm
hydrograph or flood
hydrograph.
• The hydrograph shows
the distribution of total
runoff at the gauging
point of the watershed.
• It is an integral expression of the physiographic and climatic
characteristics that govern the relations between rainfall and
runoff of a particular drainage basin.
Components of a Hydrograph
Rising limb
• known as concentration curve, reflects a prolonged
increase in discharge from a catchment area, typically in
response to a rainfall event
•The slope of the rising limb is dependent on storm and
basin characteristics.
•In a simple hydrograph, the rising limb is comparatively
shorter than the falling limb; accordingly the area below
the rising limb is less to that of the falling limb of the
hydrograph.
Components of a Hydrograph
Crest Segment
•It is extended from the point of inflection on the rising limb to a
similar inflection point in the falling limb.
•Crest segment is an indication of the peak flow rate.
•Generally when all parts of the watershed start to yield the
runoff simultaneously to the outlet, the peak flow occurs.
•In large watersheds, it occurs after end of rainfall.
•It is controlled by storm and watershed characteristics, as these
two affect the time interval between the center of mass of
rainfall and the peak of the hydrograph.
Components of a Hydrograph
Recession (falling) limb
•The recession limb extends from the peak flow rate onward.
•The inflection point on recession limb represents the time at
which the end of storm flow (quick flow or direct runoff) and
the return to groundwater-derived flow (base flow).
•The shape of the falling limb is independent of storm
characteristics, but completely dependent on the watershed
characteristics.
Factors Affecting Flood Hydrograph
• The shape of hydrograph depends on the runoff volume and
it’s time to peak.
i. climatic factors
 Direction of storm movement
• The direction of the storm movement with respect to the
orientation of the catchments drainage network affects both
the magnitude of peak flow and the duration of the
hydrograph.
• The storm direction has the effect on elongated catchments,
where storms moving upstream tend to produce lower peaks
and broader time base of surface runoff than storms that move
downstream towards the catchment outlet.
Cont.’
Rainfall duration
Determines peak flow & time period of
surface runoff
Isochrones = helpful for explaining the effect
of the duration of a uniform rainfall on the
shape of hydrograph.
Isochrones are imaginary lines across the
catchment from where water particles traveling downward take the
same time to reach the catchment outlet.
• If the rainfall event starts at time zero, then the hydrograph at the
catchment outlet will go on rising and after a time ‘Δt’, the flow from
the isochrones I would have reached the catchment outlet. Thus,
after a gap of time Δt, all the area A1 contributes to the outflow
hydrograph.
Cont.’
• After a lapse of time ‘4Δt’, all the catchment area would be
contributing to the catchment outflow, provided the rain
continues to fall for at least up to a time 4Δt.
• If rainfall continues further, then the hydrograph would not
increase further.
Cont.’
Spatial distribution of rainfall
• If only area A1 receives rainfall but the
other areas do not, then this region is
nearest to the catchment outlet, the
resulting hydrograph immediately rises.
• If the rainfall continues for a time more
than ‘Δt’, then the hydrograph would
reach saturation equal to re.A1, where re is
the intensity of the effective rainfall.
• If a rainfall of constant intensity is falling only within area A4, Since
the lower boundary of A4 is the Isochrone III, there would be no
resulting hydrograph till time ‘3Δt’ at the outlet.
• If the rain continues beyond a time ‘4Δt’, then the hydrograph would
reach a saturation level equal to re A4.
Cont.’
Rainfall intensity
•Increase in rainfall intensity increases the peak discharge and volume
of runoff for a given infiltration rate
•The rainfall runoff relation follows a linear relationship
ii. Physiographic characteristics
Shape of the catchment
•A catchment that is shaped in the form of a pear, with the narrow end towards the
upstream and the broader end nearer the catchment outlet (Figure 1a) have a
hydrograph that is fast rising and has a rather concentrated high peak (Figure 1b).
Cont.’
• A catchment with the same area as in Figure 1 but shaped with its
narrow end towards the outlet has a hydrograph that is slow rising
and with a somewhat lower peak (Figure 2) for the same amount
of rainfall.
• Though the volume of water that passes through the outlets of
both the catchments is same (as areas and effective rainfall have
been assumed same for both), the peak in case of the latter is
attenuated.
Cont.’
Size of the catchment
•Naturally, the volume of runoff expected for a given rainfall input
would be proportional to the size of the catchment.
•But the response characteristics of large catchment is significantly
different from a small catchment due to the relative importance of the
different phases of runoff (overland flow, inter flow, base flow, etc.)
for these two catchments.
Slope
•Slope of the main stream cutting across the catchment and that of the
valley sides or general land slope affects the shape of the hydrograph.
•Hence, for the same rainfall input to two catchments of the same area
but with different slopes, the one with a steeper slope would
generate a hydrograph with steeper rising and falling limits.
Base flow separation
 a portion of streamflow that is not directly generated from the
excess rainfall
 In other words, it is the flow that would exist in the stream without
the contribution of direct runoff from the rainfall.
 Estimation of base-flow and direct runoff is useful to understand
the hydrology of a watershed, including;
 interaction of surface and sub-surface water
 role of urbanization on runoff generation, and
 the health of aquatic habitat within a stream
 The surface flow hydrograph is obtained from the total storm
hydrograph by separating the quick response flow from the slow
response runoff.
It is usual to consider the interflow as part of surface flow in view of its
quick response.
 Thus only the base flow is to be deducted from the total storm
hydrograph to obtain the surface flow hydrograph.
Base flow separation
There are three methods of base-flow separation that are in common
use.
i. straight line method
oinvolves drawing a horizontal line from the point at which surface
runoff begins to the intersection with the recession limb.
oThis is applicable to ephemeral streams.
ii. Fixed base method
othe surface runoff is assumed to end a fixed time N after the
hydrograph peak.
oThe baseflow before the surface runoff began is projected ahead to
the time of the peak.
oA straight line is used to connect this projection at the peak to the
point on the recession limb at time N after the peak.
Base flow separation
iii. Variable slope method
othe baseflow curve before the surface runoff began is extrapolated
forward to the time of peak discharge, and the baseflow curve after
surface runoff ceases is extrapolated backward to the time of the
point of inflection on the recession limb.
oA straight line is used to connect the endpoints of the extrapolated
curves.
Unit Hydrograph
 the hydrograph of direct runoff resulting from a unit depth (1cm)
of rainfall excess occurring uniformly over the basin and at
a uniform rate for a specified duration (D hours).
• It is the unit pulse response
function of a linear hydrologic
system. The duration being a
very important characteristic,
is used as a prefix to a specific
unit hydrograph.
• Thus one has a 4-h unit hydrograph, 8-h unit hydrograph, etc. and
in general a D-h unit hydrograph applicable to a given catchment.
Unit Hydrograph
 The definition of unit hydrograph implies the following
 a simple linear model that can be used to derive the hydrograph
resulting from any amount of excess rainfall.
 represents the lumped response of the catchment to a unit rainfall
excess of D-h duration to produce a direct-runoff hydrograph.
 Hence, the volume of water contained in the unit hydrograph must
be equal to a volume given by 1 cm depth of rainfall excess over
the catchment.
 The rainfall is considered to have an average intensity of excess
rainfall (ER) of L/D cm/h for the duration D- h of the storm.
 The distribution of the storm is considered to be uniform all over
the catchment
Unit Hydrograph
The function M(D)/N(D) is called the transfer function of the system; it describes
the response of the output to a given input sequence.
Applied Hydrology_chap-7-pp_201-234.pdf 203
Linear hydrologic System model in Continuous Time
The amount of water stored in a hydrologic system of a linear
reservoir , S may be related to the rates of inflow I and outflow Q by
the integral equation of continuity:
Cont.’
Elements of unit hydrograph
Unit Hydrograph – Assumptions
• Rainfall is evenly distributed over the entire
catchment.
• Rainfall intensity is constant for each individual
time interval.
• The runoff is linearly proportional to the rainfall.
• The runoff is independent of seasonal variation.
The unit hydrograph shows the relationship between effective rainfall
hyetograph (ERH) and direct runoff (DRH) for a given watershed.
This relationship is very helpful for ;
approximation of amount of direct runoff generated due to rain
storm from the watershed
Development of flood hydrographs for extreme rainfall events,
which can be used for design and construction of hydraulic structures,
such as culverts and bridges etc.
 for extension of flood flow records based on the available rainfall
database
Flood forecasting and development of warning system about
occurrence of floods in the watershed
Application of unit hydrograph
The convolution formula for unit hydrograph model is,
• Example:
• A river catchment has a 2 hour unit hydrograph with the
ordinates 0, 3, 11, 35, 55, 66, 63, 40, 22, 9 and 2 m3
/s. Assume
that the base flow at time t=0 hour is 20 m3
/s and linearly
increases to 44m3
/s at t=24 hours.
• a) Compute the hydrograph resulting from two successive 2 hour
periods of effective rain of 2.0cm and 1.5 cm respectively.
• b) To prevent downstream flooding, the maximum flow to be
released from the catchment is set at 180 m3
/s. Calculate the
space needed to store the excess water from this event (in m3
).
The results can be illustrated in Figure 5.7
Limitation of Unit hydrograph and
Unit hydrograph theory has various limitations
It assumes that the rainfall excess should be uniformly distributed over the watershed in
addition to constant intensity of rainfall excess with in its duration. This assumption is never
satisfied in the watershed during any storm.
in a very large size watershed, the center of storm is likely to vary from storm to storm,
causing variations in DRHs. It possesses the errors in the development of unit hydrograph. The
watershed ranging from 200ha to 5000km2
is found satisfactory for development of unit
hydrograph.
The watershed should not consist of large size storages i.e. tanks, ponds etc. because they
affect the linearity assumptions of unit hydrograph.
Snow or other solid forms of precipitation do not result satisfactory unit hydrograph.
Synthetic Unit Hydrograph
The unit hydrograph developed from rainfall and streamflow data
on a watershed applies only for that watershed and for the point on
the stream where the stream flow data were measured.
There are many drainage basins (catchments) for which no stream
flow records are available and unit hydrographs may be required
for such basins.
• In such cases, hydrographs may be synthesized directly from other
catchments, which are hydrologically and meteorologically
homogeneous
30

CHAPTER 7 - HYDROGRAPH CHAPTER 7 - HYDRO

  • 1.
    CHAPTER 7 -HYDROGRAPH
  • 2.
    Hydrograph • a graphshowing the rate of flow (discharge) versus time past a specific point in a river, or other channel or conduit carrying flow • The hydrograph is also known as storm hydrograph or flood hydrograph. • The hydrograph shows the distribution of total runoff at the gauging point of the watershed. • It is an integral expression of the physiographic and climatic characteristics that govern the relations between rainfall and runoff of a particular drainage basin.
  • 3.
    Components of aHydrograph
  • 4.
    Components of aHydrograph Rising limb • known as concentration curve, reflects a prolonged increase in discharge from a catchment area, typically in response to a rainfall event •The slope of the rising limb is dependent on storm and basin characteristics. •In a simple hydrograph, the rising limb is comparatively shorter than the falling limb; accordingly the area below the rising limb is less to that of the falling limb of the hydrograph.
  • 5.
    Components of aHydrograph Crest Segment •It is extended from the point of inflection on the rising limb to a similar inflection point in the falling limb. •Crest segment is an indication of the peak flow rate. •Generally when all parts of the watershed start to yield the runoff simultaneously to the outlet, the peak flow occurs. •In large watersheds, it occurs after end of rainfall. •It is controlled by storm and watershed characteristics, as these two affect the time interval between the center of mass of rainfall and the peak of the hydrograph.
  • 6.
    Components of aHydrograph Recession (falling) limb •The recession limb extends from the peak flow rate onward. •The inflection point on recession limb represents the time at which the end of storm flow (quick flow or direct runoff) and the return to groundwater-derived flow (base flow). •The shape of the falling limb is independent of storm characteristics, but completely dependent on the watershed characteristics.
  • 8.
  • 9.
    Factors Affecting FloodHydrograph • The shape of hydrograph depends on the runoff volume and it’s time to peak. i. climatic factors  Direction of storm movement • The direction of the storm movement with respect to the orientation of the catchments drainage network affects both the magnitude of peak flow and the duration of the hydrograph. • The storm direction has the effect on elongated catchments, where storms moving upstream tend to produce lower peaks and broader time base of surface runoff than storms that move downstream towards the catchment outlet.
  • 10.
    Cont.’ Rainfall duration Determines peakflow & time period of surface runoff Isochrones = helpful for explaining the effect of the duration of a uniform rainfall on the shape of hydrograph. Isochrones are imaginary lines across the catchment from where water particles traveling downward take the same time to reach the catchment outlet. • If the rainfall event starts at time zero, then the hydrograph at the catchment outlet will go on rising and after a time ‘Δt’, the flow from the isochrones I would have reached the catchment outlet. Thus, after a gap of time Δt, all the area A1 contributes to the outflow hydrograph.
  • 11.
    Cont.’ • After alapse of time ‘4Δt’, all the catchment area would be contributing to the catchment outflow, provided the rain continues to fall for at least up to a time 4Δt. • If rainfall continues further, then the hydrograph would not increase further.
  • 12.
    Cont.’ Spatial distribution ofrainfall • If only area A1 receives rainfall but the other areas do not, then this region is nearest to the catchment outlet, the resulting hydrograph immediately rises. • If the rainfall continues for a time more than ‘Δt’, then the hydrograph would reach saturation equal to re.A1, where re is the intensity of the effective rainfall. • If a rainfall of constant intensity is falling only within area A4, Since the lower boundary of A4 is the Isochrone III, there would be no resulting hydrograph till time ‘3Δt’ at the outlet. • If the rain continues beyond a time ‘4Δt’, then the hydrograph would reach a saturation level equal to re A4.
  • 13.
    Cont.’ Rainfall intensity •Increase inrainfall intensity increases the peak discharge and volume of runoff for a given infiltration rate •The rainfall runoff relation follows a linear relationship ii. Physiographic characteristics Shape of the catchment •A catchment that is shaped in the form of a pear, with the narrow end towards the upstream and the broader end nearer the catchment outlet (Figure 1a) have a hydrograph that is fast rising and has a rather concentrated high peak (Figure 1b).
  • 14.
    Cont.’ • A catchmentwith the same area as in Figure 1 but shaped with its narrow end towards the outlet has a hydrograph that is slow rising and with a somewhat lower peak (Figure 2) for the same amount of rainfall. • Though the volume of water that passes through the outlets of both the catchments is same (as areas and effective rainfall have been assumed same for both), the peak in case of the latter is attenuated.
  • 15.
    Cont.’ Size of thecatchment •Naturally, the volume of runoff expected for a given rainfall input would be proportional to the size of the catchment. •But the response characteristics of large catchment is significantly different from a small catchment due to the relative importance of the different phases of runoff (overland flow, inter flow, base flow, etc.) for these two catchments. Slope •Slope of the main stream cutting across the catchment and that of the valley sides or general land slope affects the shape of the hydrograph. •Hence, for the same rainfall input to two catchments of the same area but with different slopes, the one with a steeper slope would generate a hydrograph with steeper rising and falling limits.
  • 16.
    Base flow separation a portion of streamflow that is not directly generated from the excess rainfall  In other words, it is the flow that would exist in the stream without the contribution of direct runoff from the rainfall.  Estimation of base-flow and direct runoff is useful to understand the hydrology of a watershed, including;  interaction of surface and sub-surface water  role of urbanization on runoff generation, and  the health of aquatic habitat within a stream  The surface flow hydrograph is obtained from the total storm hydrograph by separating the quick response flow from the slow response runoff. It is usual to consider the interflow as part of surface flow in view of its quick response.  Thus only the base flow is to be deducted from the total storm hydrograph to obtain the surface flow hydrograph.
  • 17.
    Base flow separation Thereare three methods of base-flow separation that are in common use. i. straight line method oinvolves drawing a horizontal line from the point at which surface runoff begins to the intersection with the recession limb. oThis is applicable to ephemeral streams. ii. Fixed base method othe surface runoff is assumed to end a fixed time N after the hydrograph peak. oThe baseflow before the surface runoff began is projected ahead to the time of the peak. oA straight line is used to connect this projection at the peak to the point on the recession limb at time N after the peak.
  • 18.
    Base flow separation iii.Variable slope method othe baseflow curve before the surface runoff began is extrapolated forward to the time of peak discharge, and the baseflow curve after surface runoff ceases is extrapolated backward to the time of the point of inflection on the recession limb. oA straight line is used to connect the endpoints of the extrapolated curves.
  • 19.
    Unit Hydrograph  thehydrograph of direct runoff resulting from a unit depth (1cm) of rainfall excess occurring uniformly over the basin and at a uniform rate for a specified duration (D hours). • It is the unit pulse response function of a linear hydrologic system. The duration being a very important characteristic, is used as a prefix to a specific unit hydrograph. • Thus one has a 4-h unit hydrograph, 8-h unit hydrograph, etc. and in general a D-h unit hydrograph applicable to a given catchment.
  • 20.
    Unit Hydrograph  Thedefinition of unit hydrograph implies the following  a simple linear model that can be used to derive the hydrograph resulting from any amount of excess rainfall.  represents the lumped response of the catchment to a unit rainfall excess of D-h duration to produce a direct-runoff hydrograph.  Hence, the volume of water contained in the unit hydrograph must be equal to a volume given by 1 cm depth of rainfall excess over the catchment.  The rainfall is considered to have an average intensity of excess rainfall (ER) of L/D cm/h for the duration D- h of the storm.  The distribution of the storm is considered to be uniform all over the catchment
  • 21.
    Unit Hydrograph The functionM(D)/N(D) is called the transfer function of the system; it describes the response of the output to a given input sequence. Applied Hydrology_chap-7-pp_201-234.pdf 203 Linear hydrologic System model in Continuous Time The amount of water stored in a hydrologic system of a linear reservoir , S may be related to the rates of inflow I and outflow Q by the integral equation of continuity:
  • 22.
  • 23.
    Unit Hydrograph –Assumptions • Rainfall is evenly distributed over the entire catchment. • Rainfall intensity is constant for each individual time interval. • The runoff is linearly proportional to the rainfall. • The runoff is independent of seasonal variation.
  • 24.
    The unit hydrographshows the relationship between effective rainfall hyetograph (ERH) and direct runoff (DRH) for a given watershed. This relationship is very helpful for ; approximation of amount of direct runoff generated due to rain storm from the watershed Development of flood hydrographs for extreme rainfall events, which can be used for design and construction of hydraulic structures, such as culverts and bridges etc.  for extension of flood flow records based on the available rainfall database Flood forecasting and development of warning system about occurrence of floods in the watershed Application of unit hydrograph
  • 25.
    The convolution formulafor unit hydrograph model is,
  • 26.
    • Example: • Ariver catchment has a 2 hour unit hydrograph with the ordinates 0, 3, 11, 35, 55, 66, 63, 40, 22, 9 and 2 m3 /s. Assume that the base flow at time t=0 hour is 20 m3 /s and linearly increases to 44m3 /s at t=24 hours. • a) Compute the hydrograph resulting from two successive 2 hour periods of effective rain of 2.0cm and 1.5 cm respectively. • b) To prevent downstream flooding, the maximum flow to be released from the catchment is set at 180 m3 /s. Calculate the space needed to store the excess water from this event (in m3 ).
  • 28.
    The results canbe illustrated in Figure 5.7
  • 29.
    Limitation of Unithydrograph and Unit hydrograph theory has various limitations It assumes that the rainfall excess should be uniformly distributed over the watershed in addition to constant intensity of rainfall excess with in its duration. This assumption is never satisfied in the watershed during any storm. in a very large size watershed, the center of storm is likely to vary from storm to storm, causing variations in DRHs. It possesses the errors in the development of unit hydrograph. The watershed ranging from 200ha to 5000km2 is found satisfactory for development of unit hydrograph. The watershed should not consist of large size storages i.e. tanks, ponds etc. because they affect the linearity assumptions of unit hydrograph. Snow or other solid forms of precipitation do not result satisfactory unit hydrograph.
  • 30.
    Synthetic Unit Hydrograph Theunit hydrograph developed from rainfall and streamflow data on a watershed applies only for that watershed and for the point on the stream where the stream flow data were measured. There are many drainage basins (catchments) for which no stream flow records are available and unit hydrographs may be required for such basins. • In such cases, hydrographs may be synthesized directly from other catchments, which are hydrologically and meteorologically homogeneous 30