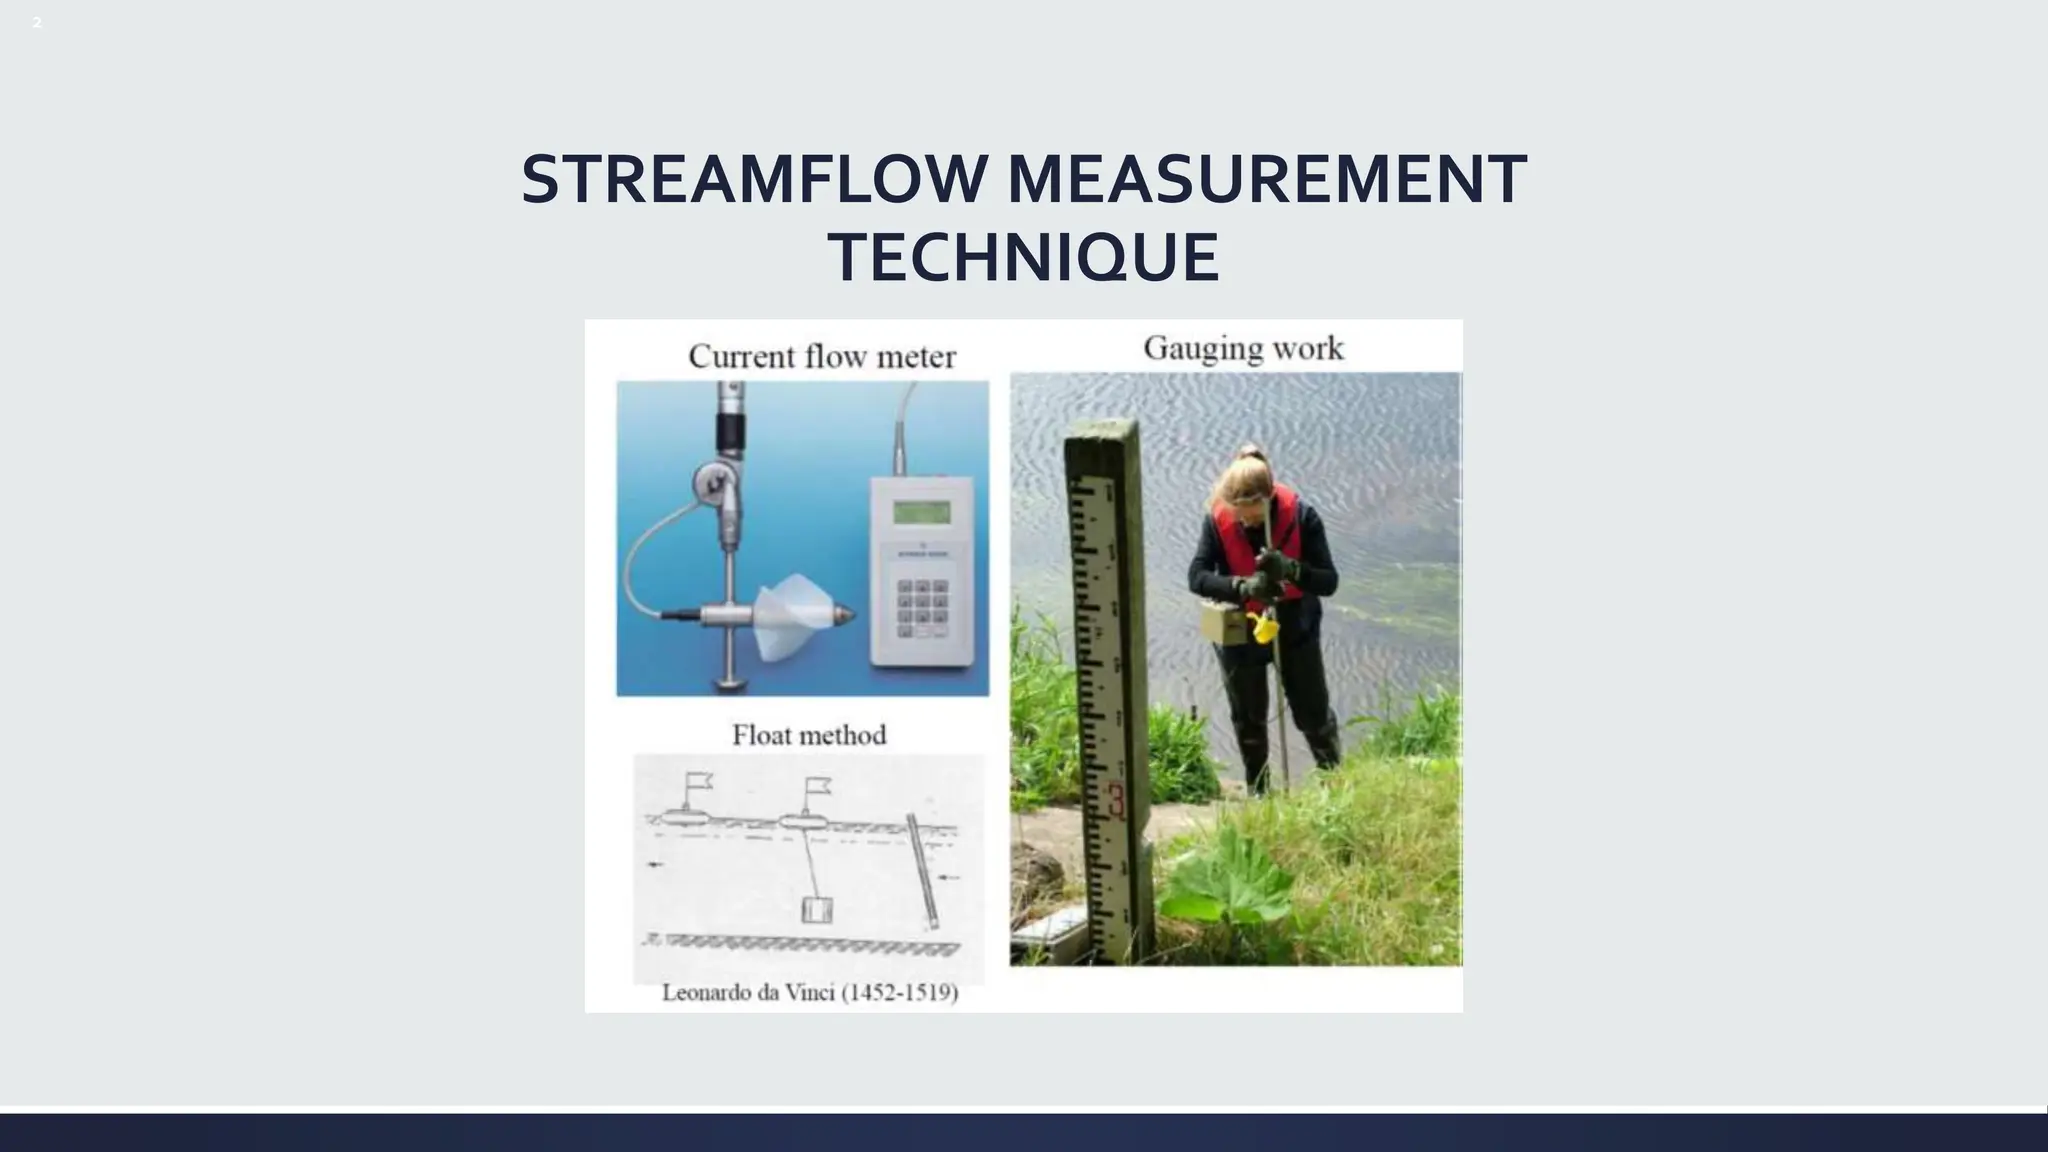
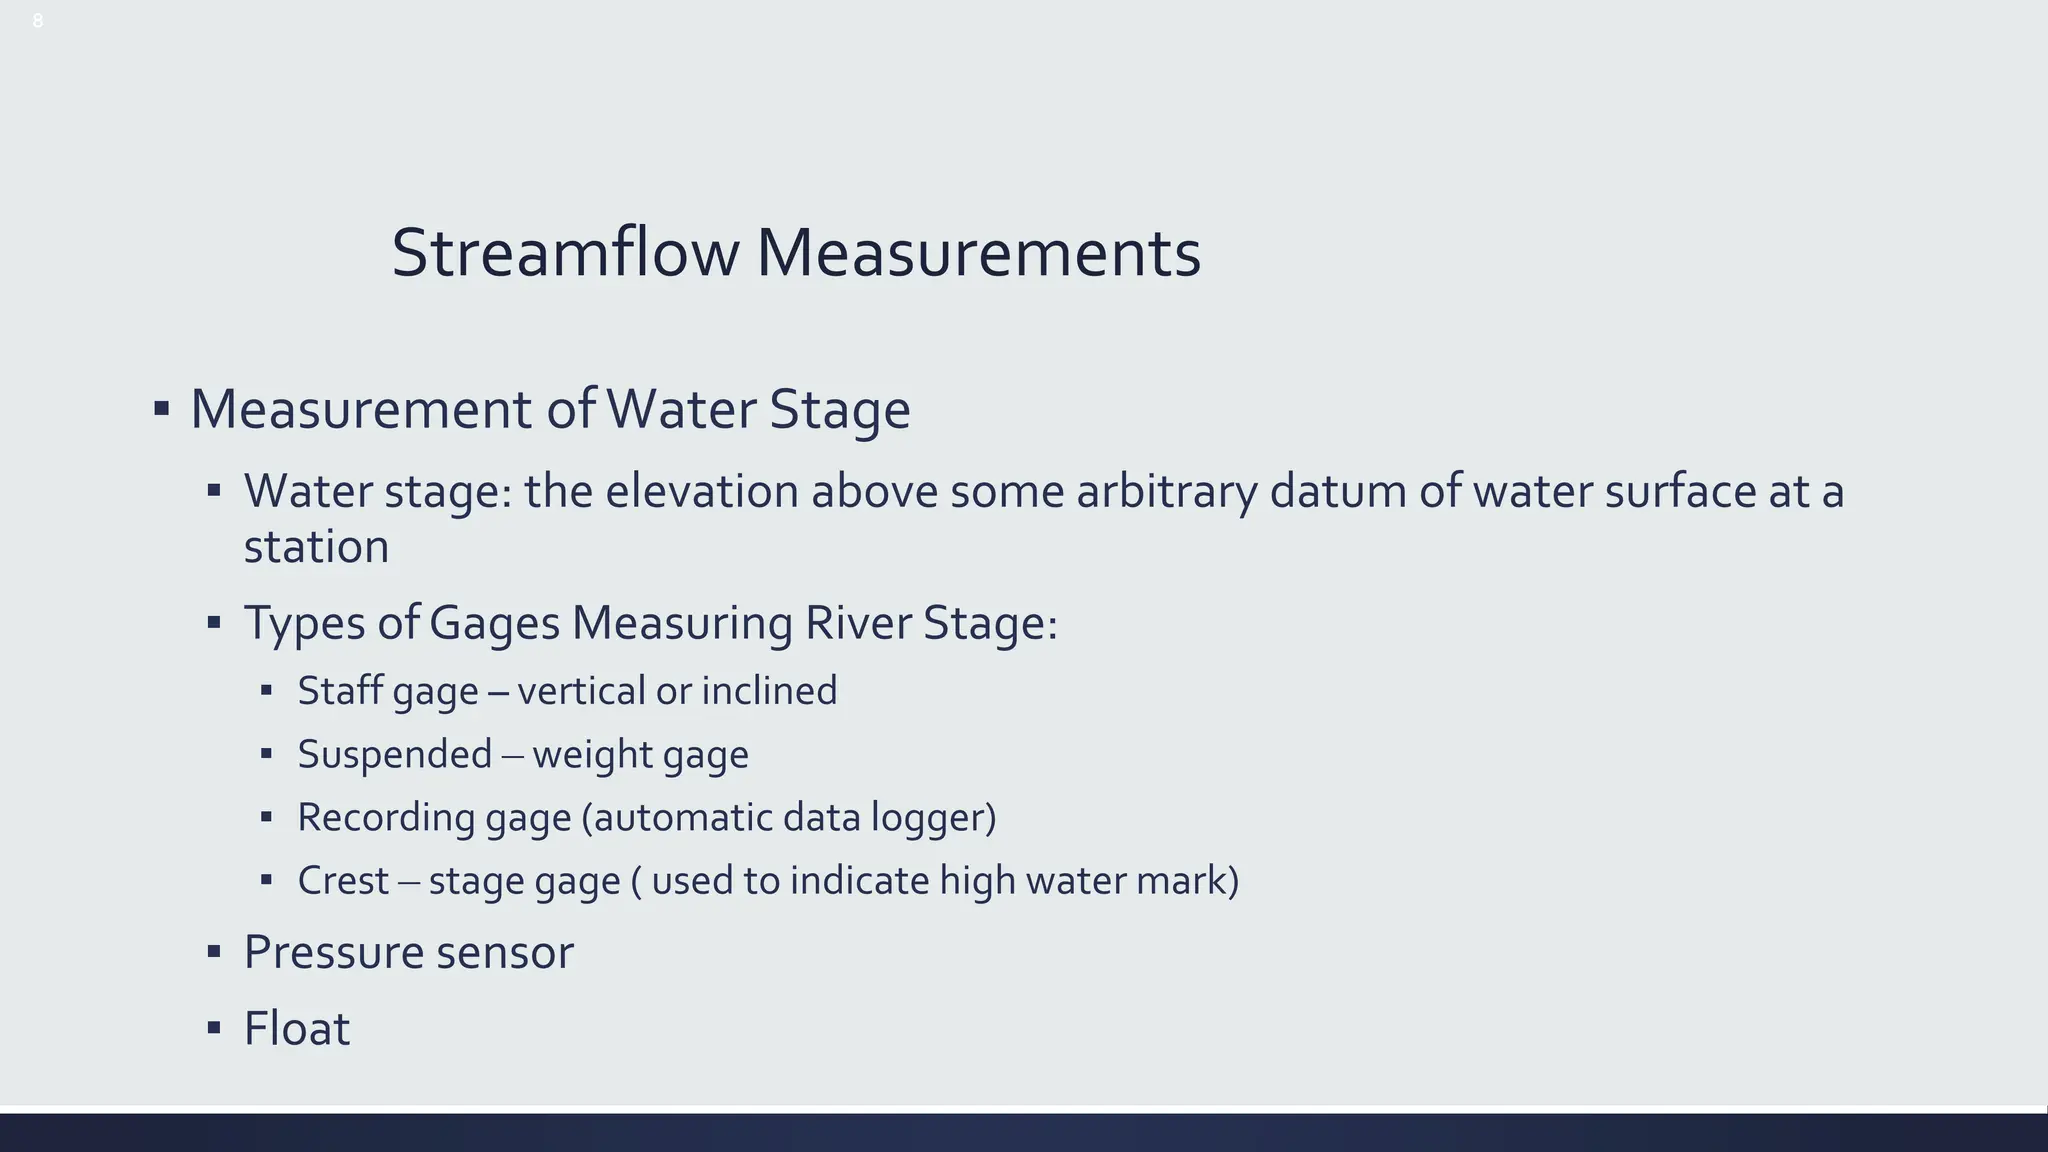
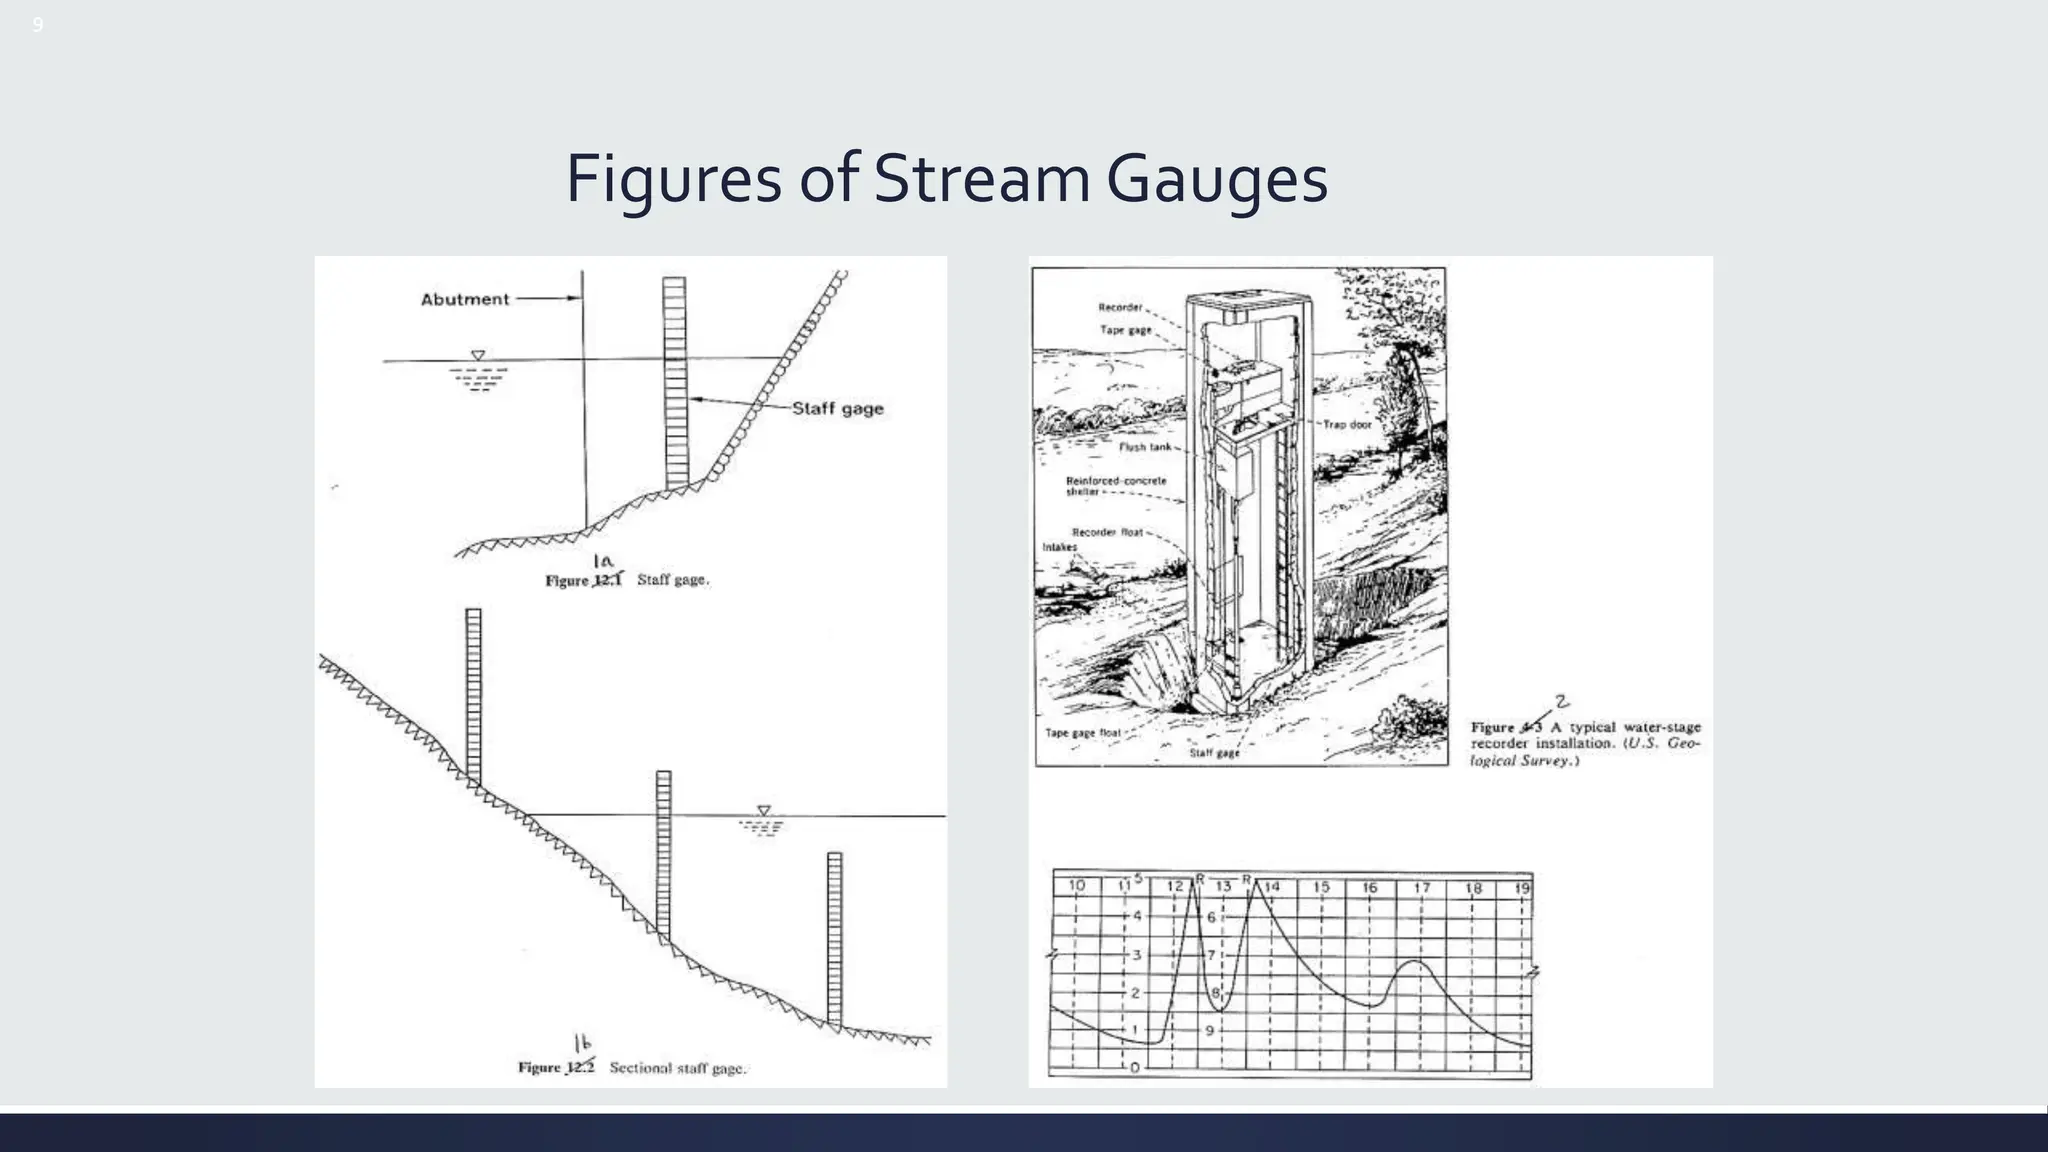
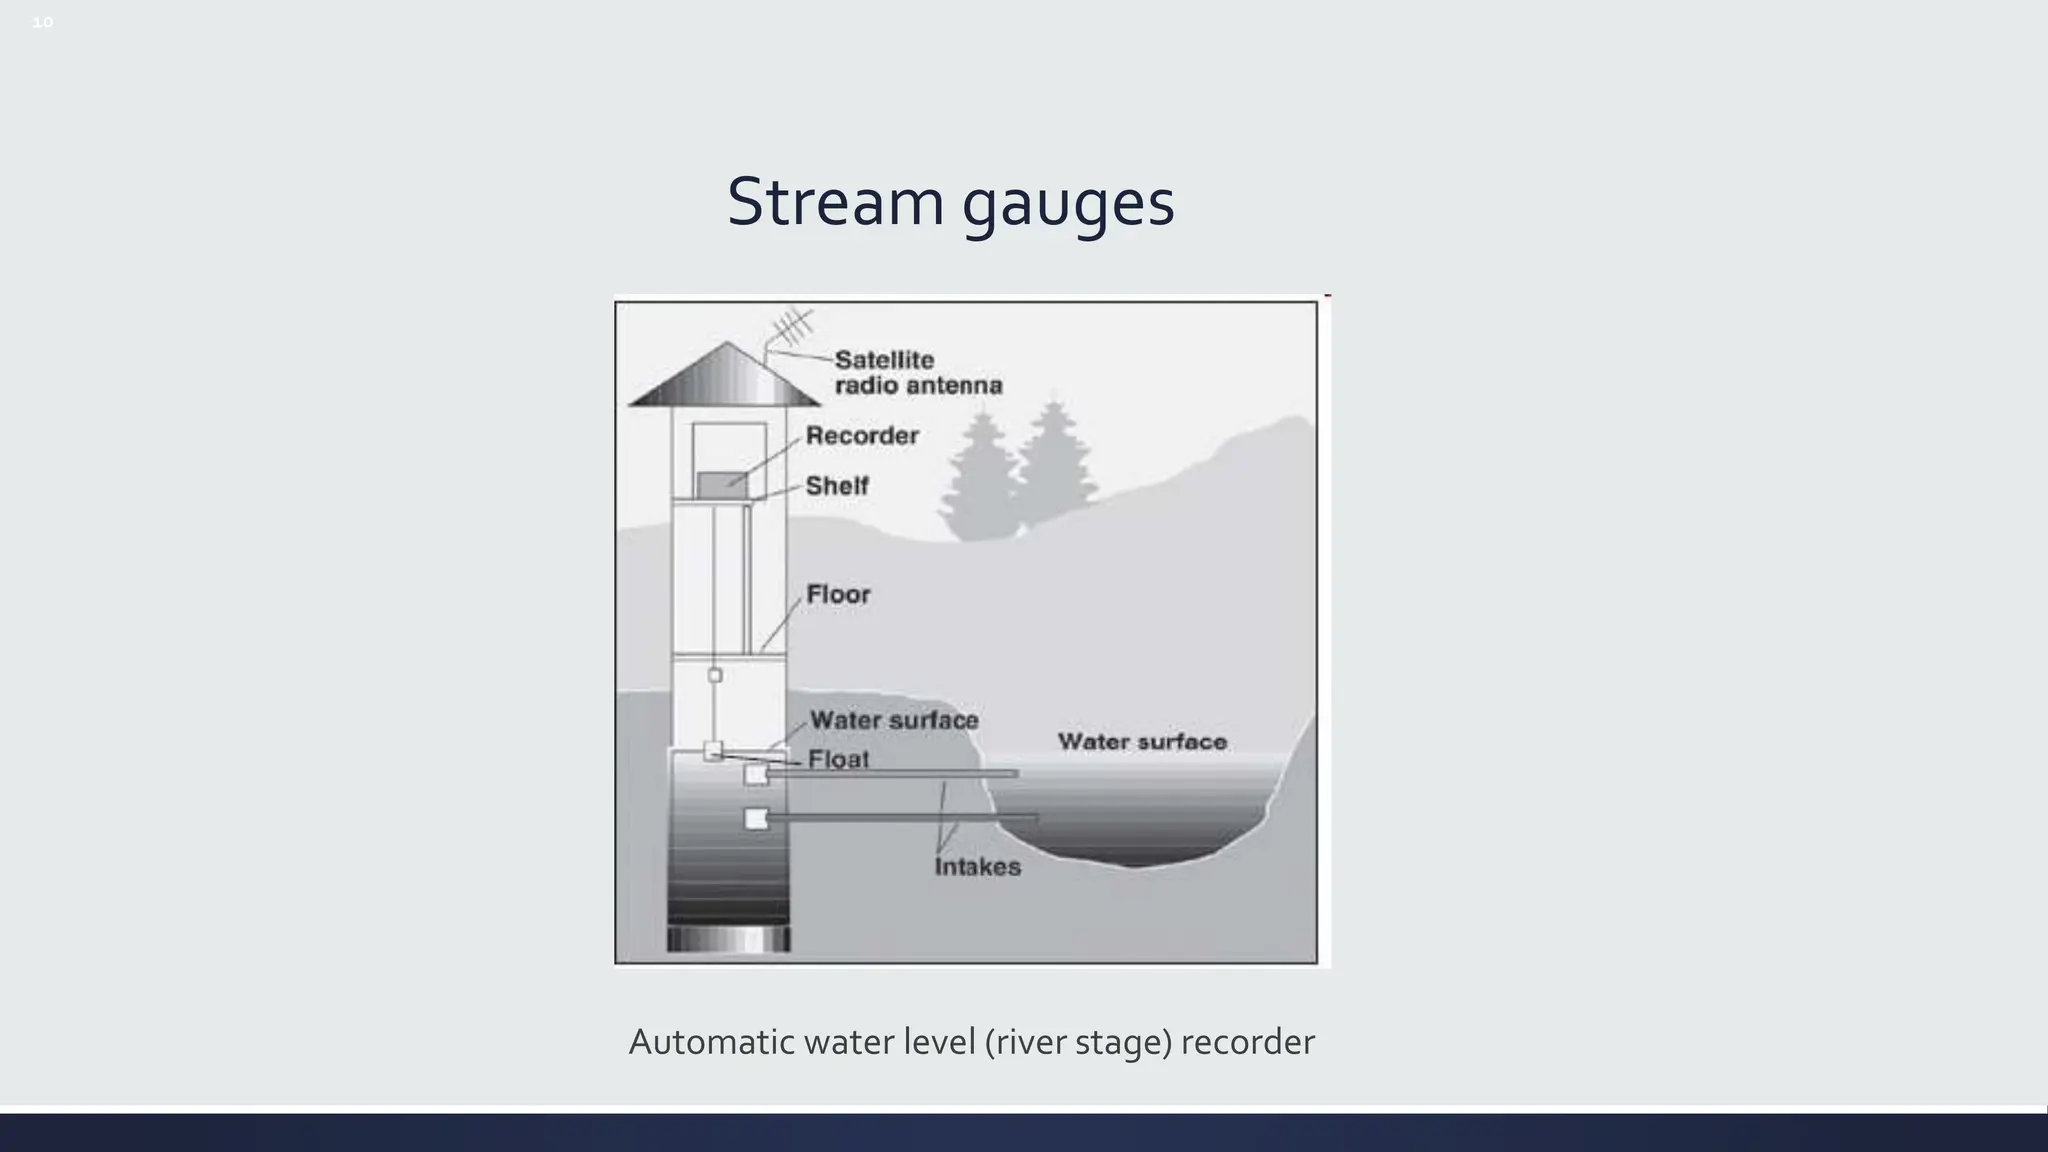
The document discusses streamflow measurement techniques essential for engineering hydrology, emphasizing their significance in water supply, flood control, and reservoir design. It covers methods of discharge measurement, including direct and indirect techniques, the use of gauges, and various equations for calculating flow velocity and discharge. Additionally, it highlights the importance of understanding channel features and the challenges associated with measuring in varying conditions.


![26
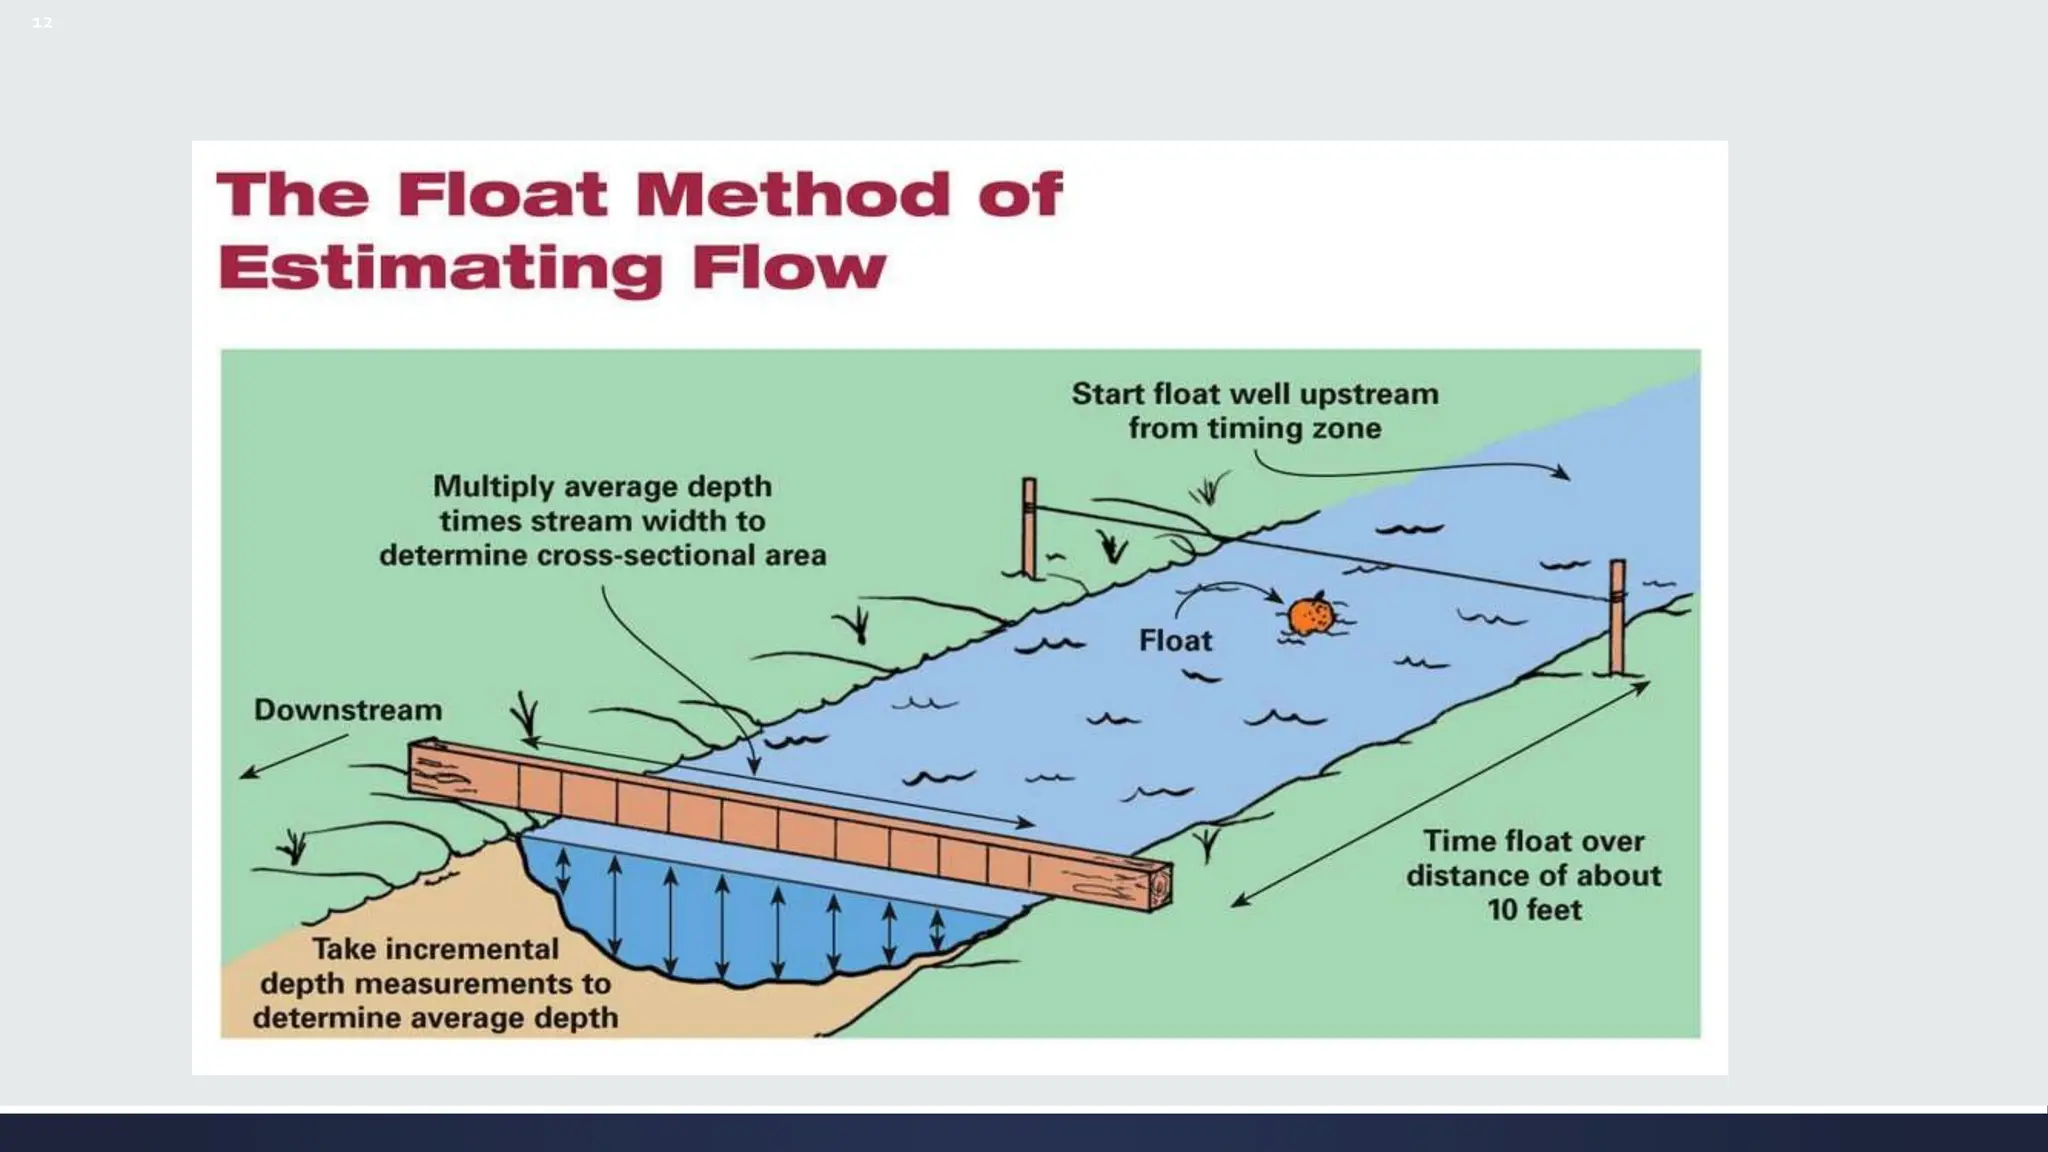
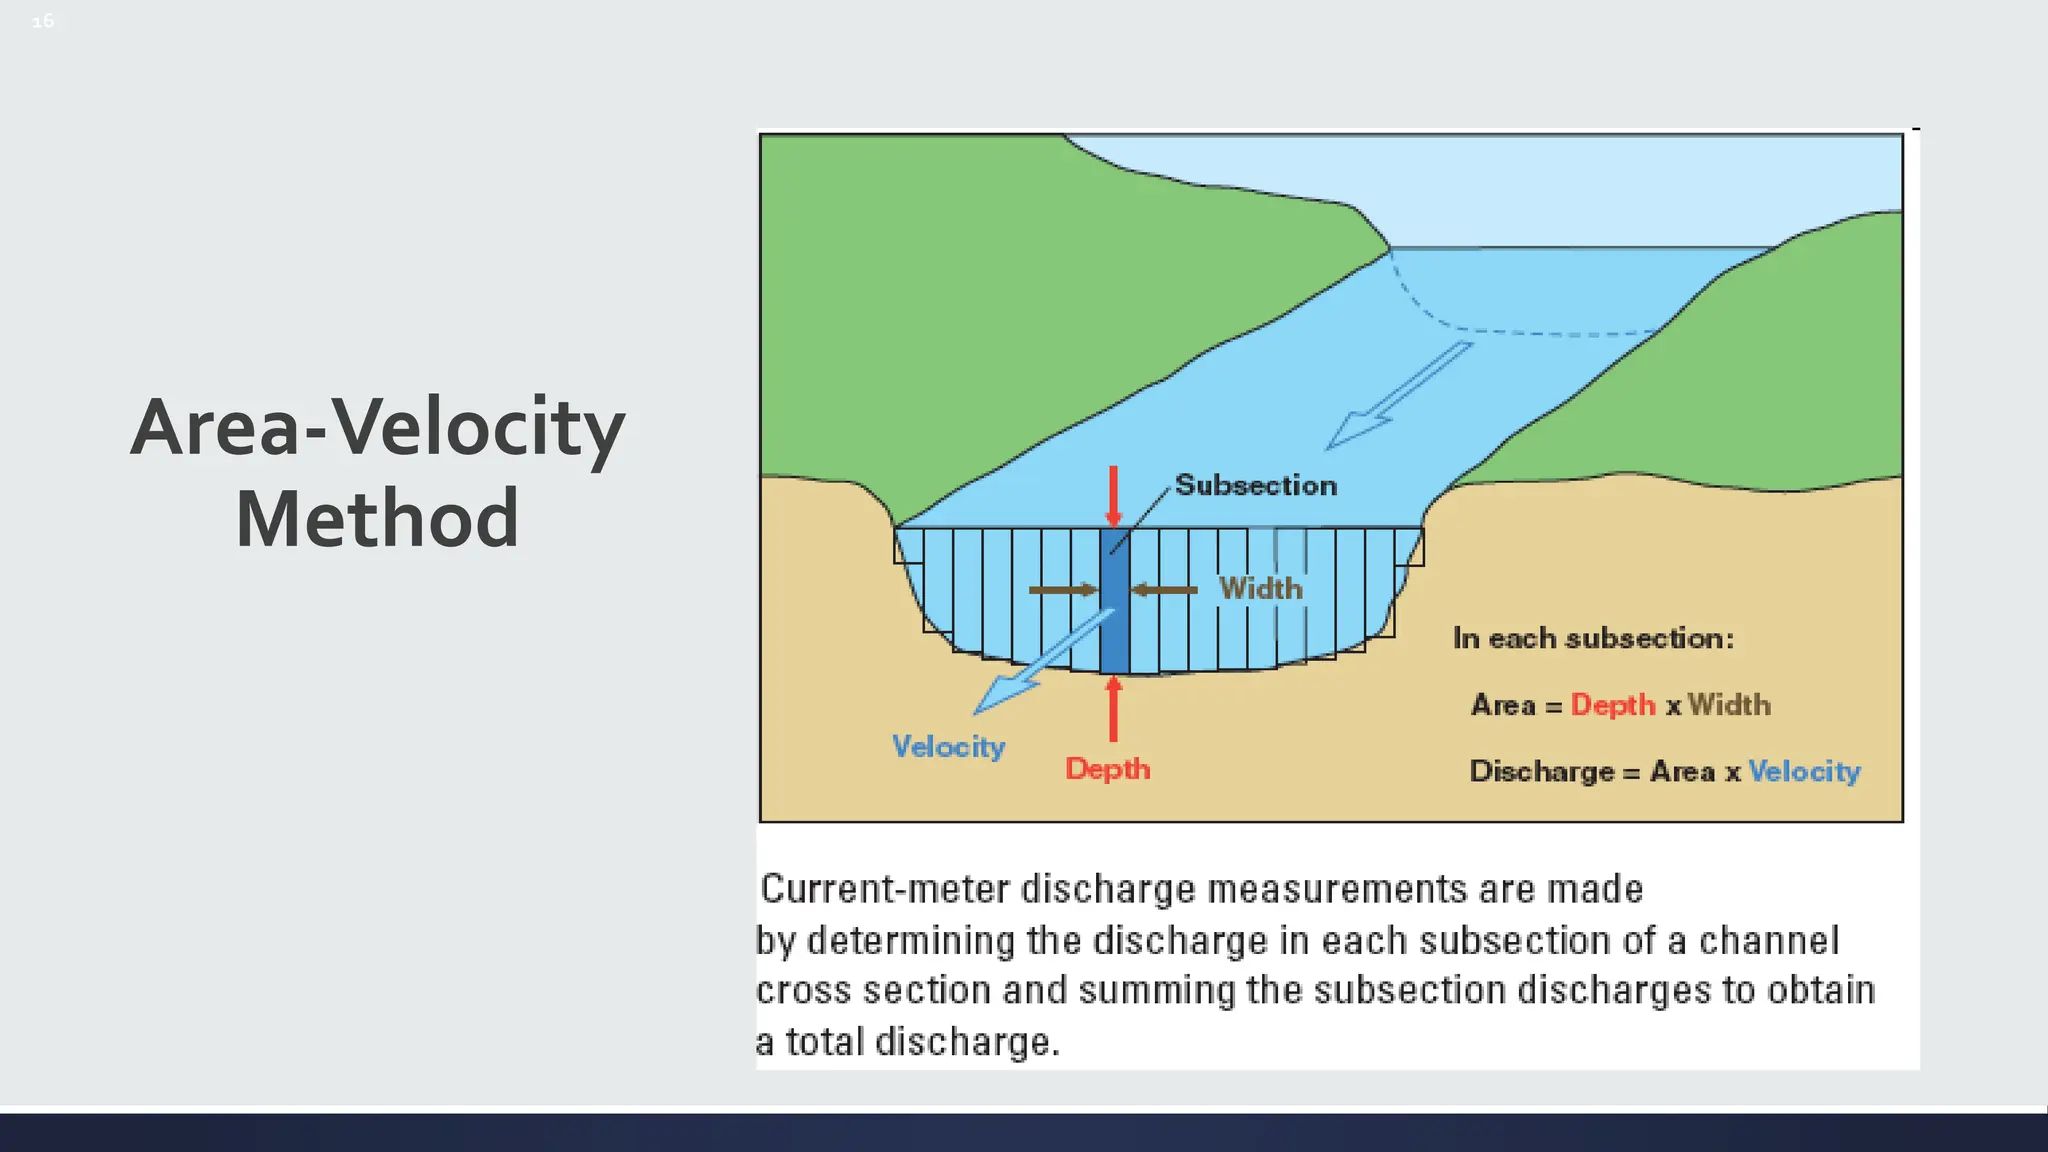
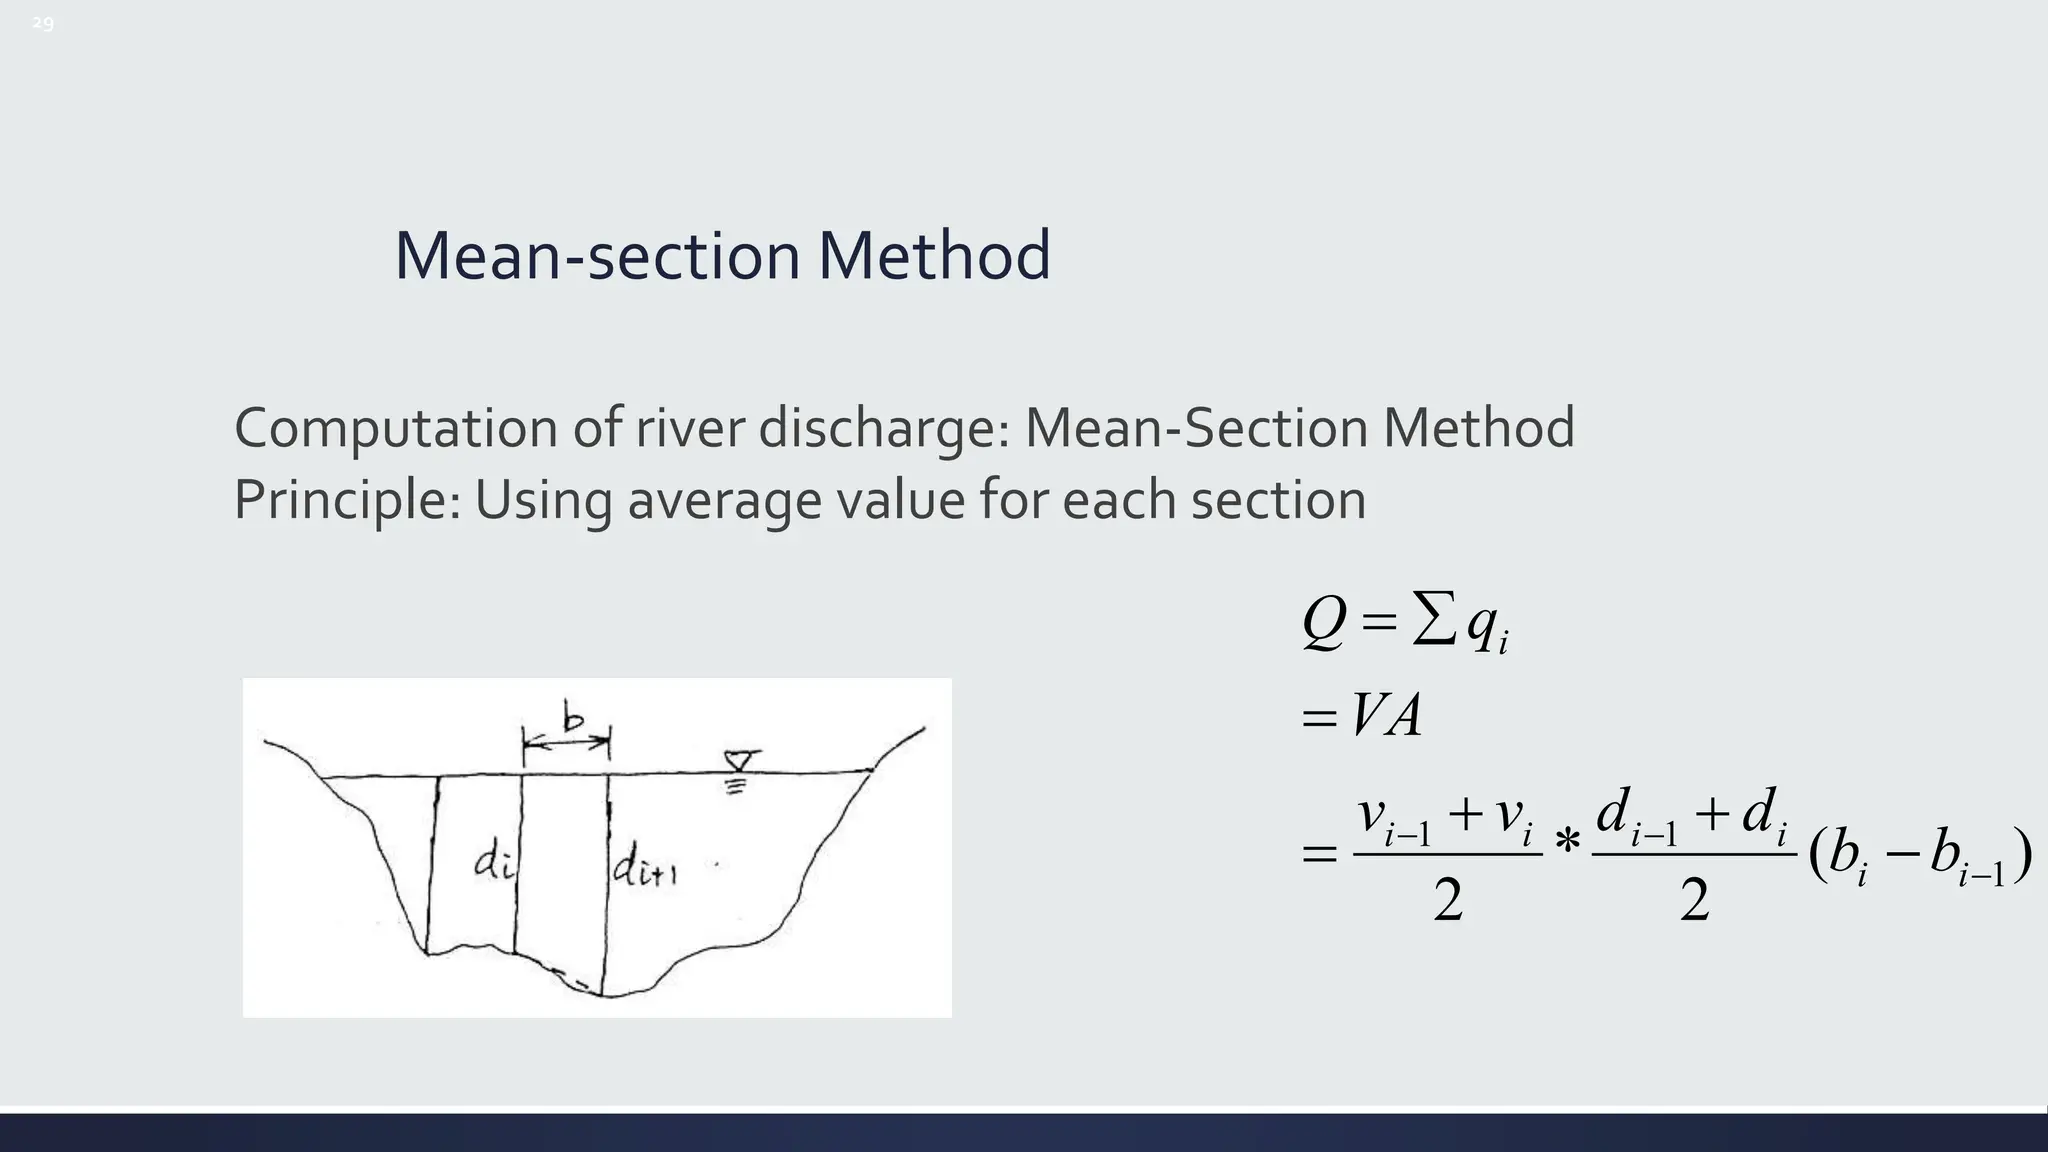
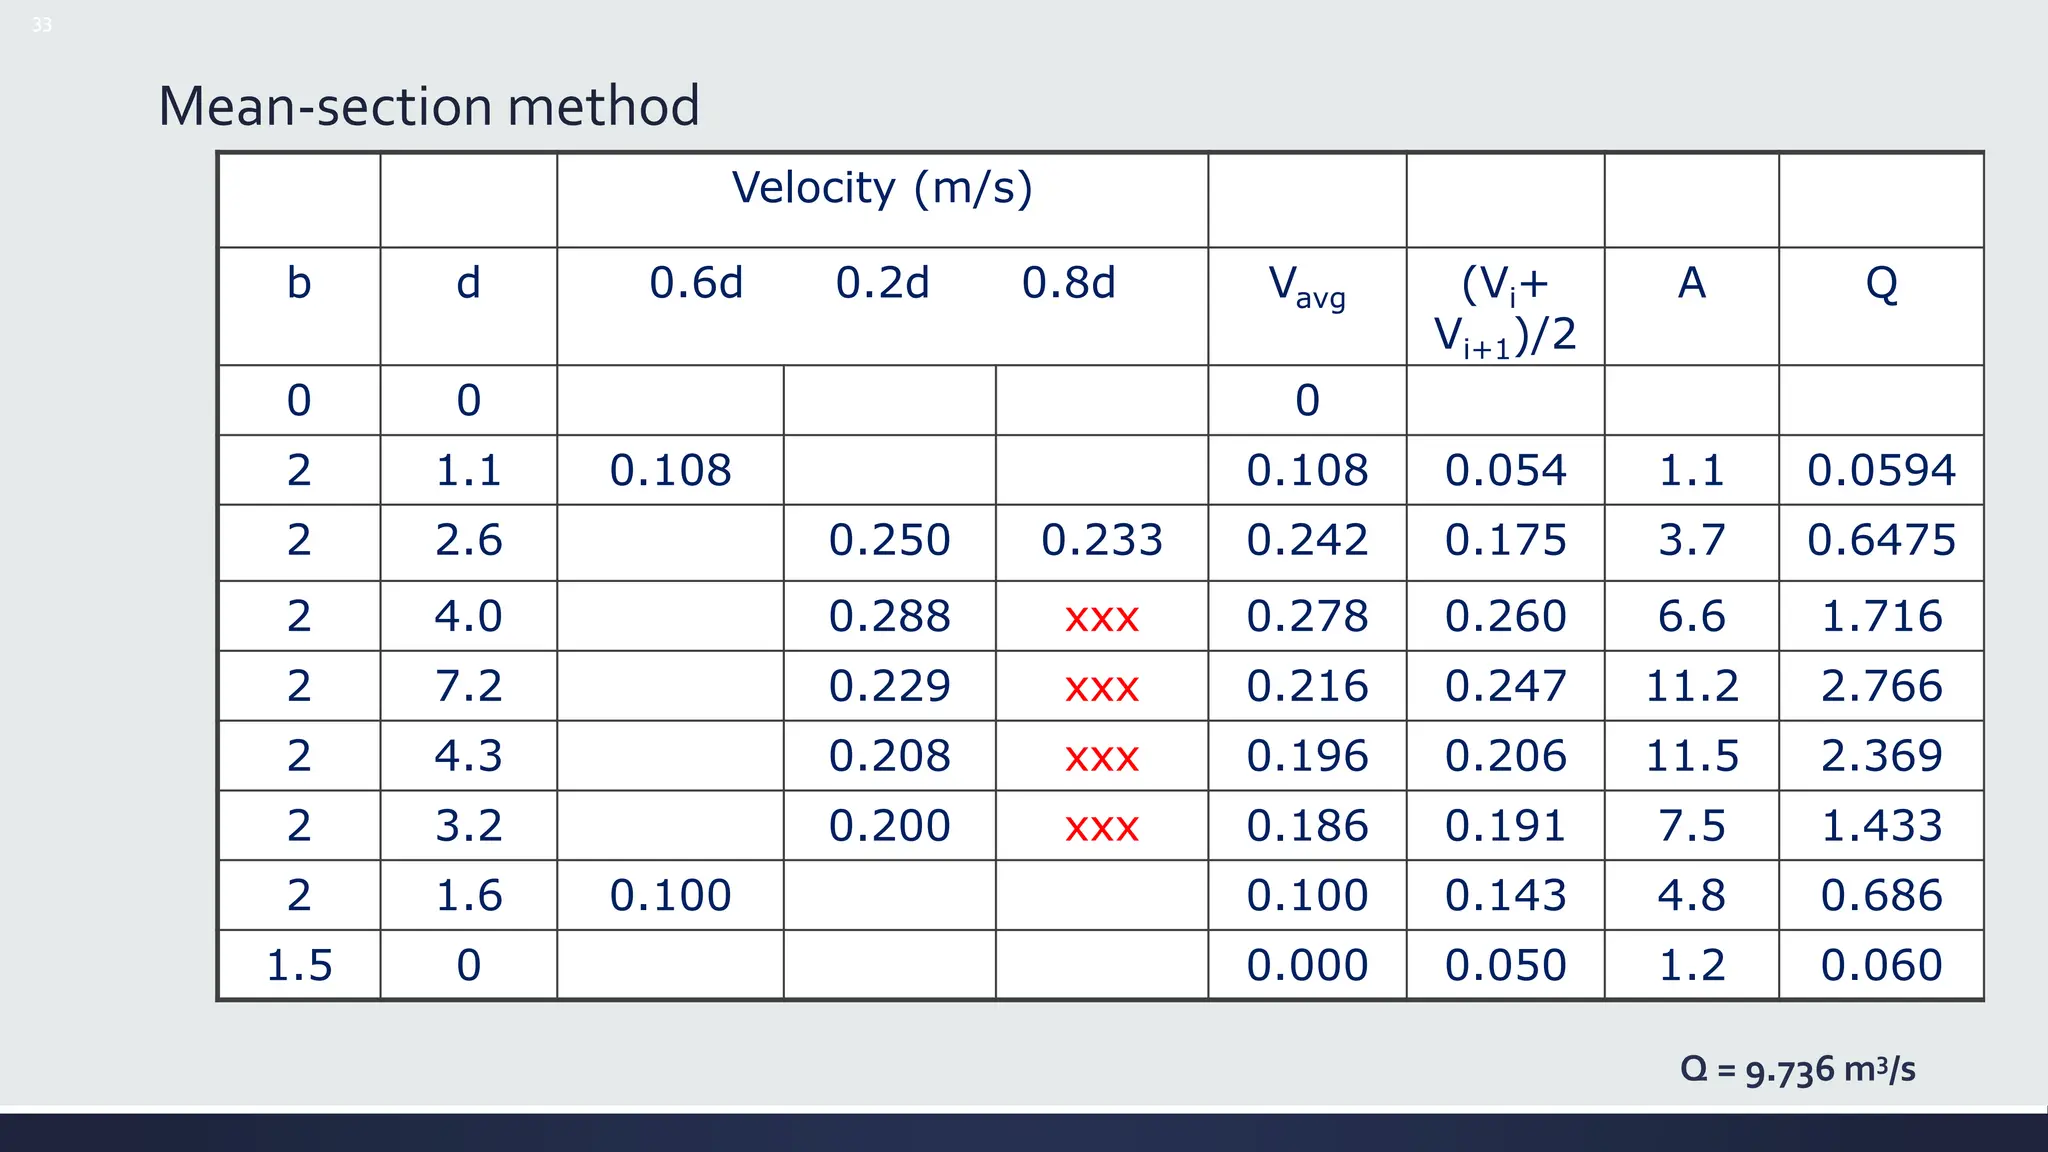
Velocity-Area Method
▪ Q = [Velocity x Area]
▪ Need to know width of channel (w), Depth of channel (d), andVelocity of flow (V) (ft/s or m/s)
▪ Area = w x d
▪ Because depth & velocity vary across a channel:
(1) Important to divide the channel into manageable segments (slices);Typically use 10-20
segments
(2) For each segment measure depth, width and velocity](https://image.slidesharecdn.com/streamflowmeasurement-240618125356-061abe9c/75/STREAMFLOW-MEASUREMENT-IN-HYDROLOGY-pptx-26-2048.jpg)


![64
Estimating Discharge (Q) from channel features:
Manning’s Equation
2
1
3
2
1
S
R
n
v
• v = average velocity (m/s)
• R = hydraulic radius
= [Area/wetted perimeter]
• S = Energy gradient, Approximated by water surface slope
• n = Manning’s roughness coefficient
Q = Av](https://image.slidesharecdn.com/streamflowmeasurement-240618125356-061abe9c/75/STREAMFLOW-MEASUREMENT-IN-HYDROLOGY-pptx-64-2048.jpg)