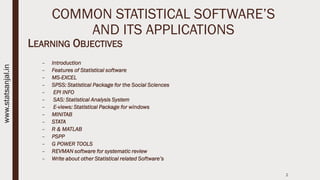
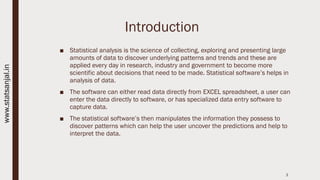
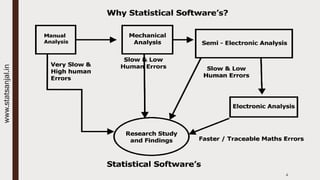
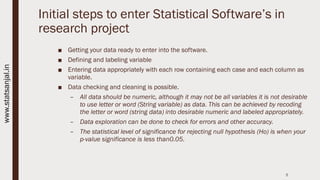
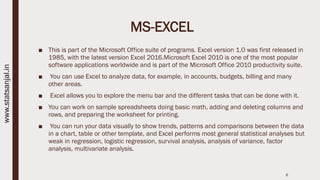
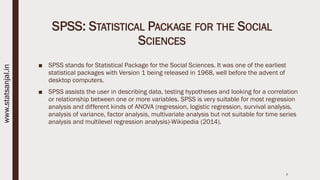
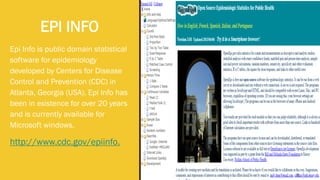
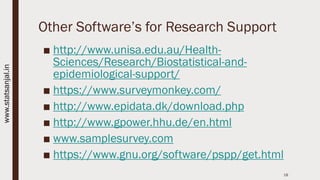
SlideShare a Scribd company logo
BASIC WORKSHOP OF RESEARCH METHODOLOGY
MUHS,NASHIK
COMMON STATISTICAL SOFTWARE’S AND ITS
APPLICATIONS
Dr. Anjali Upadhye
M.Sc.(Statistics),M.B.A.,PGDTQM,Ph.D.
Head of Department,Research ,ADAMC,Ashta
(Contact :+91 9922494537 , anjaliupadhye1511@gmail.com)
1
COMMON STATISTICAL SOFTWARE’S
AND ITS APPLICATIONS
LEARNING OBJECTIVES
– Introduction
– Features of Statistical software
– MS-EXCEL
– SPSS: Statistical Package for the Social Sciences
– EPI INFO
– SAS: Statistical Analysis System
– E-views: Statistical Package for windows
– MINITAB
– STATA
– R & MATLAB
– PSPP
– G POWER TOOLS
– REVMAN software for systematic review
– Write about other Statistical related Software’s
2
www.statsanjal.in
Introduction
■ Statistical analysis is the science of collecting, exploring and presenting large
amounts of data to discover underlying patterns and trends and these are
applied every day in research, industry and government to become more
scientific about decisions that need to be made. Statistical software’s helps in
analysis of data.
■ The software can either read data directly from EXCEL spreadsheet, a user can
enter the data directly to software, or has specialized data entry software to
capture data.
■ The statistical software’s then manipulates the information they possess to
discover patterns which can help the user uncover the predictions and help to
interpret the data.
3
www.statsanjal.in
4
www.statsanjal.in
Initial steps to enter Statistical Software’s in
research project
■ Getting your data ready to enter into the software.
■ Defining and labeling variable
■ Entering data appropriately with each row containing each case and each column as
variable.
■ Data checking and cleaning is possible.
– All data should be numeric, although it may not be all variables it is not desirable
to use letter or word (String variable) as data. This can be achieved by recoding
the letter or word (string data) into desirable numeric and labeled appropriately.
– Data exploration can be done to check for errors and other accuracy.
– The statistical level of significance for rejecting null hypothesis (Ho) is when your
p-value significance is less than0.05.
5
www.statsanjal.in
MS-EXCEL
■ This is part of the Microsoft Office suite of programs. Excel version 1.0 was first released in
1985, with the latest version Excel 2016.Microsoft Excel 2010 is one of the most popular
software applications worldwide and is part of the Microsoft Office 2010 productivity suite.
■ You can use Excel to analyze data, for example, in accounts, budgets, billing and many
other areas.
■ Excel allows you to explore the menu bar and the different tasks that can be done with it.
■ You can work on sample spreadsheets doing basic math, adding and deleting columns and
rows, and preparing the worksheet for printing.
■ You can run your data visually to show trends, patterns and comparisons between the data
in a chart, table or other template, and Excel performs most general statistical analyses but
weak in regression, logistic regression, survival analysis, analysis of variance, factor
analysis, multivariate analysis.
6
www.statsanjal.in
SPSS: STATISTICAL PACKAGE FOR THE SOCIAL
SCIENCES
■ SPSS stands for Statistical Package for the Social Sciences. It was one of the earliest
statistical packages with Version 1 being released in 1968, well before the advent of
desktop computers.
■ SPSS assists the user in describing data, testing hypotheses and looking for a correlation
or relationship between one or more variables. SPSS is very suitable for most regression
analysis and different kinds of ANOVA (regression, logistic regression, survival analysis,
analysis of variance, factor analysis, multivariate analysis but not suitable for time series
analysis and multilevel regression analysis)-Wikipedia (2014).
7
www.statsanjal.in
EPI INFO
Epi Info is public domain statistical
software for epidemiology
developed by Centers for Disease
Control and Prevention (CDC) in
Atlanta, Georgia (USA). Epi Info has
been in existence for over 20 years
and is currently available for
Microsoft windows.
http://www.cdc.gov/epiinfo.
8
SAS: STATISTICAL ANALYSIS SYSTEM
■ SAS - SAS stands for Statistical Analysis System.
■ It was developed at the North Carolina State University in 1966, so is contemporary with
SPSS &which has its latest version produced in December 2011 is a package that many
"power users" like because of its power and programmability.
■ SAS is one of the packages that are difficult to learn.
■ To use SAS, you must write SAS programs that manipulate your data and perform your
data analyses.
■ SAS performs most general statistical analyses (regression, logistic regression, survival
analysis, analysis of variance, factor analysis, multivariate analysis). The greatest
strengths of SAS are probably in its ANOVA, mixed model analysis and multivariate
analysis, while it is probably weakest in ordinal and multinomial logistic
■ Regression (because these commands are especially difficult), and robust methods (it is
difficult to perform robust regression, or other kinds of robust methods)
9
www.statsanjal.in
E-VIEWS:
STATISTICAL
PACKAGE FOR
WINDOWS
E-Views is a statistical package for window,
used mainly for time-series oriented
econometrics analysis.
EViews can be used for general statistical
analysis and econometric analyses, such as
cross-section and panel data analysis and time
series estimation and forecasting.
EViews relies heavily on a proprietary and
undocumented file format for data storage.
10
MINITAB & MATLAB
■ MINITAB is statistical software used by educators, students, scientists, business
associates and researchers to provide statistical software in a multitude of areas.
MINITAB, developed around 1990, and remains one of the oldest statistical software
programs available. MINITAB has compatibility with PC, Macintosh, Linux and all
other major platforms.
■ MINITAB performs most general statistical analyses (regression, logistic regression,
survival analysis, analysis of variance, factor analysis, but has its weaknesses in
general linear model (GLM) and Multilevel regression).
11
www.statsanjal.in
STATA
■ Stata is a more recent statistical package with Version 1 being released in 1985.
Since then, it has become increasingly popular in the areas of epidemiology and
economics, and probably now rivals SPSS and SAS in it user base.
■ STATA is a powerful statistical package with smart data-management facilities, a
wide array of up-to-date statistical techniques, and an excellent system for producing
publication-quality graphs
■ STATA performs most general statistical analyses (regression, logistic regression,
survival analysis, analysis of variance, factor analysis, multivariate analysis and time
series analysis).
12
www.statsanjal.in
R & MATLAB
R
■ S-plus is a statistical programming language
developed in Seattle in 1988. R is a free version of S-
plus developed in 1996. Since then, the original
team has expanded to include dozens of individuals
from all over the globe. Because it is a programming
language and environment, it is used by giving the
software a series of commands, often saved in text
documents called syntax files or scripts, rather than
having a menu-based system. Because of this, it is
probably best used by people already reasonably
expert at statistical analysis, or who have an affinity
for computers.
Good points
■ Very powerful – easily matches or even surpasses
many of the models found in SAS or Statas
■ Researchers around the world write their own
procedures in R, which are then available to all users
■ Free! At http://cran.csiro.au/
13
www.statsanjal.in
Effect Size Calculations: Example
14
www.statsanjal.in
Sample Size Calculation with G Power*
15
www.statsanjal.in
Reliability
Analysis
(Normality
Check)
Variables
Reliability Statistics
Normality
Cronbach's
Alphaa
Cronbach's
Alpha Based
on
Standardized
Items
N of Items
Demographic Characteristics
about Purchase of Green
Products
0.463 0.474 5 Deviated
Consumer's Awareness about
the green products
0.927 0.911 19 Normal
Green products purchased by
the Consumers
0.959 0.962 10 Normal
Reasons for purchase of green
products
0.875 0.804 7 Normal
Influencing key aspects of green
products
0.888 0.895 13 Normal
Influencing factors for purchase
decision of green products
0.483 0.165 7 Deviated
Consumer behavioral
perceptions regarding value of
being ecofriendly
0.977 0.977 13 Normal
Consumer Attitude regarding
Green Products
0.900 0.899 13 Normal
Opportunities available in future -0.082 0.068 5 Deviated
16
www.statsanjal.in
Paired t Test with SPSS
17
www.statsanjal.in
Other Software’s for Research Support
■ http://www.unisa.edu.au/Health-
Sciences/Research/Biostatistical-and-
epidemiological-support/
■ https://www.surveymonkey.com/
■ http://www.epidata.dk/download.php
■ http://www.gpower.hhu.de/en.html
■ www.samplesurvey.com
■ https://www.gnu.org/software/pspp/get.html
18
www.statsanjal.in
Meet me on : www.statsanjal.in
19
www.statsanjal.in
1. http://www.statsanjal.in
2. http://www.ijooar.com
Contact :9922494537
anjaliupadhye1511@gmail.com
20
www.statsanjal.in

More Related Content

What's hot

PSPP overview and Introduction to R & R Commander
PSPP overview and Introduction to R & R CommanderPSPP overview and Introduction to R & R Commander
PSPP overview and Introduction to R & R CommanderBernard Deepal W. Jayamanne
 
Systat 13 Training ppt
Systat 13 Training pptSystat 13 Training ppt
Systat 13 Training pptSiriyak Cr
 
Electronic spreadsheet software
Electronic spreadsheet softwareElectronic spreadsheet software
Electronic spreadsheet softwareMendozaEllaine
 
Top 10 statistics tools to get better data insights
Top 10 statistics tools to get better data insightsTop 10 statistics tools to get better data insights
Top 10 statistics tools to get better data insightsStat Analytica
 
SPSS and type of errors associated with hypothesis testing
SPSS and type of errors associated with hypothesis testingSPSS and type of errors associated with hypothesis testing
SPSS and type of errors associated with hypothesis testingShafeek S
 
Data is Not Neutral
Data is Not NeutralData is Not Neutral
Data is Not Neutralmisslake
 
Introduction of data science
Introduction of data scienceIntroduction of data science
Introduction of data scienceTanujaSomvanshi1
 
COM 578 Empirical Methods in Machine Learning and Data Mining
COM 578 Empirical Methods in Machine Learning and Data MiningCOM 578 Empirical Methods in Machine Learning and Data Mining
COM 578 Empirical Methods in Machine Learning and Data Miningbutest
 
XLSTAT - Statistical Analysis Software
XLSTAT - Statistical Analysis Software XLSTAT - Statistical Analysis Software
XLSTAT - Statistical Analysis Software xlstat
 
Big Data Visualization
Big Data VisualizationBig Data Visualization
Big Data VisualizationEdwin de Jonge
 

What's hot (14)

PSPP overview and Introduction to R & R Commander
PSPP overview and Introduction to R & R CommanderPSPP overview and Introduction to R & R Commander
PSPP overview and Introduction to R & R Commander
 
Systat 13 Training ppt
Systat 13 Training pptSystat 13 Training ppt
Systat 13 Training ppt
 
Electronic spreadsheet software
Electronic spreadsheet softwareElectronic spreadsheet software
Electronic spreadsheet software
 
Evolution of big data
Evolution of big dataEvolution of big data
Evolution of big data
 
Top 10 statistics tools to get better data insights
Top 10 statistics tools to get better data insightsTop 10 statistics tools to get better data insights
Top 10 statistics tools to get better data insights
 
SPSS and type of errors associated with hypothesis testing
SPSS and type of errors associated with hypothesis testingSPSS and type of errors associated with hypothesis testing
SPSS and type of errors associated with hypothesis testing
 
Data is Not Neutral
Data is Not NeutralData is Not Neutral
Data is Not Neutral
 
SPSS
SPSSSPSS
SPSS
 
1133629601 400440
1133629601 4004401133629601 400440
1133629601 400440
 
CVpro
CVproCVpro
CVpro
 
Introduction of data science
Introduction of data scienceIntroduction of data science
Introduction of data science
 
COM 578 Empirical Methods in Machine Learning and Data Mining
COM 578 Empirical Methods in Machine Learning and Data MiningCOM 578 Empirical Methods in Machine Learning and Data Mining
COM 578 Empirical Methods in Machine Learning and Data Mining
 
XLSTAT - Statistical Analysis Software
XLSTAT - Statistical Analysis Software XLSTAT - Statistical Analysis Software
XLSTAT - Statistical Analysis Software
 
Big Data Visualization
Big Data VisualizationBig Data Visualization
Big Data Visualization
 

Similar to Computer assistance in statistical methods.28.04.2021

SoftwareforDataAnalysisinSPSSOnoverview1.docx
SoftwareforDataAnalysisinSPSSOnoverview1.docxSoftwareforDataAnalysisinSPSSOnoverview1.docx
SoftwareforDataAnalysisinSPSSOnoverview1.docxAyyanar k
 
Various statistical software's in data analysis.
Various statistical software's in data analysis.Various statistical software's in data analysis.
Various statistical software's in data analysis.SelvaMani69
 
RES814 U1 Individual Project
RES814 U1 Individual ProjectRES814 U1 Individual Project
RES814 U1 Individual ProjectThienSi Le
 
SEM 8 BIOSTATISTICS graphs minitab excel etc
SEM 8 BIOSTATISTICS graphs minitab excel etcSEM 8 BIOSTATISTICS graphs minitab excel etc
SEM 8 BIOSTATISTICS graphs minitab excel etcKaishAamirPathan
 
Ibm spss statistics 19 brief guide
Ibm spss statistics 19 brief guideIbm spss statistics 19 brief guide
Ibm spss statistics 19 brief guideMarketing Utopia
 
Application of Excel and SPSS software for statistical analysis- Biostatistic...
Application of Excel and SPSS software for statistical analysis- Biostatistic...Application of Excel and SPSS software for statistical analysis- Biostatistic...
Application of Excel and SPSS software for statistical analysis- Biostatistic...Himanshu Sharma
 
Spss statistics brief guide 17.0
 Spss statistics brief guide 17.0 Spss statistics brief guide 17.0
Spss statistics brief guide 17.0DIANTO IRAWAN
 
Pasw statistics 18 brief guide
Pasw statistics 18 brief guidePasw statistics 18 brief guide
Pasw statistics 18 brief guideTRPC
 
Statistical software packages ,their layout & applications
Statistical software packages ,their layout & applicationsStatistical software packages ,their layout & applications
Statistical software packages ,their layout & applicationsNeurosurgeon Mumtaz Ali Narejo
 
SOFTWARE USED IN P'epidemiology.pdf
SOFTWARE USED IN P'epidemiology.pdfSOFTWARE USED IN P'epidemiology.pdf
SOFTWARE USED IN P'epidemiology.pdfvarshawadnere
 
Spssbriefguide160
Spssbriefguide160Spssbriefguide160
Spssbriefguide160vishalks
 
Topic 4 intro spss_stata
Topic 4 intro spss_stataTopic 4 intro spss_stata
Topic 4 intro spss_stataSM Lalon
 
Presentation on spss
Presentation on spssPresentation on spss
Presentation on spssalfiyajamalcj
 
Statistical softwares
Statistical softwaresStatistical softwares
Statistical softwaresAfra Fathima
 
Educ 190_Data Analysis and Collection Tools
Educ 190_Data Analysis and Collection ToolsEduc 190_Data Analysis and Collection Tools
Educ 190_Data Analysis and Collection ToolsTeacher Pauline
 
Data Processing DOH Workshop.pptx
Data Processing DOH Workshop.pptxData Processing DOH Workshop.pptx
Data Processing DOH Workshop.pptxcharlslabarda
 

Similar to Computer assistance in statistical methods.28.04.2021 (20)

SoftwareforDataAnalysisinSPSSOnoverview1.docx
SoftwareforDataAnalysisinSPSSOnoverview1.docxSoftwareforDataAnalysisinSPSSOnoverview1.docx
SoftwareforDataAnalysisinSPSSOnoverview1.docx
 
Various statistical software's in data analysis.
Various statistical software's in data analysis.Various statistical software's in data analysis.
Various statistical software's in data analysis.
 
Tools used by ba
Tools used by baTools used by ba
Tools used by ba
 
RES814 U1 Individual Project
RES814 U1 Individual ProjectRES814 U1 Individual Project
RES814 U1 Individual Project
 
SEM 8 BIOSTATISTICS graphs minitab excel etc
SEM 8 BIOSTATISTICS graphs minitab excel etcSEM 8 BIOSTATISTICS graphs minitab excel etc
SEM 8 BIOSTATISTICS graphs minitab excel etc
 
Ibm spss statistics 19 brief guide
Ibm spss statistics 19 brief guideIbm spss statistics 19 brief guide
Ibm spss statistics 19 brief guide
 
Application of Excel and SPSS software for statistical analysis- Biostatistic...
Application of Excel and SPSS software for statistical analysis- Biostatistic...Application of Excel and SPSS software for statistical analysis- Biostatistic...
Application of Excel and SPSS software for statistical analysis- Biostatistic...
 
Spss statistics brief guide 17.0
 Spss statistics brief guide 17.0 Spss statistics brief guide 17.0
Spss statistics brief guide 17.0
 
Pasw statistics 18 brief guide
Pasw statistics 18 brief guidePasw statistics 18 brief guide
Pasw statistics 18 brief guide
 
Statistical software packages ,their layout & applications
Statistical software packages ,their layout & applicationsStatistical software packages ,their layout & applications
Statistical software packages ,their layout & applications
 
SOFTWARE USED IN P'epidemiology.pdf
SOFTWARE USED IN P'epidemiology.pdfSOFTWARE USED IN P'epidemiology.pdf
SOFTWARE USED IN P'epidemiology.pdf
 
SPSS.pptx
SPSS.pptxSPSS.pptx
SPSS.pptx
 
Spssbriefguide160
Spssbriefguide160Spssbriefguide160
Spssbriefguide160
 
Topic 4 intro spss_stata
Topic 4 intro spss_stataTopic 4 intro spss_stata
Topic 4 intro spss_stata
 
Presentation on spss
Presentation on spssPresentation on spss
Presentation on spss
 
Statistical softwares
Statistical softwaresStatistical softwares
Statistical softwares
 
Educ 190_Data Analysis and Collection Tools
Educ 190_Data Analysis and Collection ToolsEduc 190_Data Analysis and Collection Tools
Educ 190_Data Analysis and Collection Tools
 
Data Processing DOH Workshop.pptx
Data Processing DOH Workshop.pptxData Processing DOH Workshop.pptx
Data Processing DOH Workshop.pptx
 
Spss
SpssSpss
Spss
 
Uses of SPSS and Excel to analyze data
Uses of SPSS and Excel   to analyze dataUses of SPSS and Excel   to analyze data
Uses of SPSS and Excel to analyze data
 

Recently uploaded

The Art Pastor's Guide to Sabbath | Steve Thomason
The Art Pastor's Guide to Sabbath | Steve ThomasonThe Art Pastor's Guide to Sabbath | Steve Thomason
The Art Pastor's Guide to Sabbath | Steve ThomasonSteve Thomason
 
1.4 modern child centered education - mahatma gandhi-2.pptx
1.4 modern child centered education - mahatma gandhi-2.pptx1.4 modern child centered education - mahatma gandhi-2.pptx
1.4 modern child centered education - mahatma gandhi-2.pptxJosvitaDsouza2
 
Fish and Chips - have they had their chips
Fish and Chips - have they had their chipsFish and Chips - have they had their chips
Fish and Chips - have they had their chipsGeoBlogs
 
Synthetic Fiber Construction in lab .pptx
Synthetic Fiber Construction in lab .pptxSynthetic Fiber Construction in lab .pptx
Synthetic Fiber Construction in lab .pptxPavel ( NSTU)
 
special B.ed 2nd year old paper_20240531.pdf
special B.ed 2nd year old paper_20240531.pdfspecial B.ed 2nd year old paper_20240531.pdf
special B.ed 2nd year old paper_20240531.pdfSpecial education needs
 
GIÁO ÁN DẠY THÊM (KẾ HOẠCH BÀI BUỔI 2) - TIẾNG ANH 8 GLOBAL SUCCESS (2 CỘT) N...
GIÁO ÁN DẠY THÊM (KẾ HOẠCH BÀI BUỔI 2) - TIẾNG ANH 8 GLOBAL SUCCESS (2 CỘT) N...GIÁO ÁN DẠY THÊM (KẾ HOẠCH BÀI BUỔI 2) - TIẾNG ANH 8 GLOBAL SUCCESS (2 CỘT) N...
GIÁO ÁN DẠY THÊM (KẾ HOẠCH BÀI BUỔI 2) - TIẾNG ANH 8 GLOBAL SUCCESS (2 CỘT) N...Nguyen Thanh Tu Collection
 
Extraction Of Natural Dye From Beetroot (Beta Vulgaris) And Preparation Of He...
Extraction Of Natural Dye From Beetroot (Beta Vulgaris) And Preparation Of He...Extraction Of Natural Dye From Beetroot (Beta Vulgaris) And Preparation Of He...
Extraction Of Natural Dye From Beetroot (Beta Vulgaris) And Preparation Of He...SachinKumar945617
 
2024.06.01 Introducing a competency framework for languag learning materials ...
2024.06.01 Introducing a competency framework for languag learning materials ...2024.06.01 Introducing a competency framework for languag learning materials ...
2024.06.01 Introducing a competency framework for languag learning materials ...Sandy Millin
 
Sha'Carri Richardson Presentation 202345
Sha'Carri Richardson Presentation 202345Sha'Carri Richardson Presentation 202345
Sha'Carri Richardson Presentation 202345beazzy04
 
NLC-2024-Orientation-for-RO-SDO (1).pptx
NLC-2024-Orientation-for-RO-SDO (1).pptxNLC-2024-Orientation-for-RO-SDO (1).pptx
NLC-2024-Orientation-for-RO-SDO (1).pptxssuserbdd3e8
 
The geography of Taylor Swift - some ideas
The geography of Taylor Swift - some ideasThe geography of Taylor Swift - some ideas
The geography of Taylor Swift - some ideasGeoBlogs
 
The approach at University of Liverpool.pptx
The approach at University of Liverpool.pptxThe approach at University of Liverpool.pptx
The approach at University of Liverpool.pptxJisc
 
aaaaaaaaaaaaaaaaaaaaaaaaaaaaaaaaaaaaaaaaaaaaaaaaaaaaaaa
aaaaaaaaaaaaaaaaaaaaaaaaaaaaaaaaaaaaaaaaaaaaaaaaaaaaaaaaaaaaaaaaaaaaaaaaaaaaaaaaaaaaaaaaaaaaaaaaaaaaaaaaaaaaaa
aaaaaaaaaaaaaaaaaaaaaaaaaaaaaaaaaaaaaaaaaaaaaaaaaaaaaaasiemaillard
 
Home assignment II on Spectroscopy 2024 Answers.pdf
Home assignment II on Spectroscopy 2024 Answers.pdfHome assignment II on Spectroscopy 2024 Answers.pdf
Home assignment II on Spectroscopy 2024 Answers.pdfTamralipta Mahavidyalaya
 
Basic Civil Engineering Notes of Chapter-6, Topic- Ecosystem, Biodiversity G...
Basic Civil Engineering Notes of Chapter-6,  Topic- Ecosystem, Biodiversity G...Basic Civil Engineering Notes of Chapter-6,  Topic- Ecosystem, Biodiversity G...
Basic Civil Engineering Notes of Chapter-6, Topic- Ecosystem, Biodiversity G...Denish Jangid
 
Digital Tools and AI for Teaching Learning and Research
Digital Tools and AI for Teaching Learning and ResearchDigital Tools and AI for Teaching Learning and Research
Digital Tools and AI for Teaching Learning and ResearchVikramjit Singh
 
Unit 8 - Information and Communication Technology (Paper I).pdf
Unit 8 - Information and Communication Technology (Paper I).pdfUnit 8 - Information and Communication Technology (Paper I).pdf
Unit 8 - Information and Communication Technology (Paper I).pdfThiyagu K
 
Template Jadual Bertugas Kelas (Boleh Edit)
Template Jadual Bertugas Kelas (Boleh Edit)Template Jadual Bertugas Kelas (Boleh Edit)
Template Jadual Bertugas Kelas (Boleh Edit)rosedainty
 

Recently uploaded (20)

The Art Pastor's Guide to Sabbath | Steve Thomason
The Art Pastor's Guide to Sabbath | Steve ThomasonThe Art Pastor's Guide to Sabbath | Steve Thomason
The Art Pastor's Guide to Sabbath | Steve Thomason
 
1.4 modern child centered education - mahatma gandhi-2.pptx
1.4 modern child centered education - mahatma gandhi-2.pptx1.4 modern child centered education - mahatma gandhi-2.pptx
1.4 modern child centered education - mahatma gandhi-2.pptx
 
Fish and Chips - have they had their chips
Fish and Chips - have they had their chipsFish and Chips - have they had their chips
Fish and Chips - have they had their chips
 
Synthetic Fiber Construction in lab .pptx
Synthetic Fiber Construction in lab .pptxSynthetic Fiber Construction in lab .pptx
Synthetic Fiber Construction in lab .pptx
 
special B.ed 2nd year old paper_20240531.pdf
special B.ed 2nd year old paper_20240531.pdfspecial B.ed 2nd year old paper_20240531.pdf
special B.ed 2nd year old paper_20240531.pdf
 
GIÁO ÁN DẠY THÊM (KẾ HOẠCH BÀI BUỔI 2) - TIẾNG ANH 8 GLOBAL SUCCESS (2 CỘT) N...
GIÁO ÁN DẠY THÊM (KẾ HOẠCH BÀI BUỔI 2) - TIẾNG ANH 8 GLOBAL SUCCESS (2 CỘT) N...GIÁO ÁN DẠY THÊM (KẾ HOẠCH BÀI BUỔI 2) - TIẾNG ANH 8 GLOBAL SUCCESS (2 CỘT) N...
GIÁO ÁN DẠY THÊM (KẾ HOẠCH BÀI BUỔI 2) - TIẾNG ANH 8 GLOBAL SUCCESS (2 CỘT) N...
 
Extraction Of Natural Dye From Beetroot (Beta Vulgaris) And Preparation Of He...
Extraction Of Natural Dye From Beetroot (Beta Vulgaris) And Preparation Of He...Extraction Of Natural Dye From Beetroot (Beta Vulgaris) And Preparation Of He...
Extraction Of Natural Dye From Beetroot (Beta Vulgaris) And Preparation Of He...
 
2024.06.01 Introducing a competency framework for languag learning materials ...
2024.06.01 Introducing a competency framework for languag learning materials ...2024.06.01 Introducing a competency framework for languag learning materials ...
2024.06.01 Introducing a competency framework for languag learning materials ...
 
Sha'Carri Richardson Presentation 202345
Sha'Carri Richardson Presentation 202345Sha'Carri Richardson Presentation 202345
Sha'Carri Richardson Presentation 202345
 
B.ed spl. HI pdusu exam paper-2023-24.pdf
B.ed spl. HI pdusu exam paper-2023-24.pdfB.ed spl. HI pdusu exam paper-2023-24.pdf
B.ed spl. HI pdusu exam paper-2023-24.pdf
 
NLC-2024-Orientation-for-RO-SDO (1).pptx
NLC-2024-Orientation-for-RO-SDO (1).pptxNLC-2024-Orientation-for-RO-SDO (1).pptx
NLC-2024-Orientation-for-RO-SDO (1).pptx
 
The geography of Taylor Swift - some ideas
The geography of Taylor Swift - some ideasThe geography of Taylor Swift - some ideas
The geography of Taylor Swift - some ideas
 
The approach at University of Liverpool.pptx
The approach at University of Liverpool.pptxThe approach at University of Liverpool.pptx
The approach at University of Liverpool.pptx
 
aaaaaaaaaaaaaaaaaaaaaaaaaaaaaaaaaaaaaaaaaaaaaaaaaaaaaaa
aaaaaaaaaaaaaaaaaaaaaaaaaaaaaaaaaaaaaaaaaaaaaaaaaaaaaaaaaaaaaaaaaaaaaaaaaaaaaaaaaaaaaaaaaaaaaaaaaaaaaaaaaaaaaa
aaaaaaaaaaaaaaaaaaaaaaaaaaaaaaaaaaaaaaaaaaaaaaaaaaaaaaa
 
NCERT Solutions Power Sharing Class 10 Notes pdf
NCERT Solutions Power Sharing Class 10 Notes pdfNCERT Solutions Power Sharing Class 10 Notes pdf
NCERT Solutions Power Sharing Class 10 Notes pdf
 
Home assignment II on Spectroscopy 2024 Answers.pdf
Home assignment II on Spectroscopy 2024 Answers.pdfHome assignment II on Spectroscopy 2024 Answers.pdf
Home assignment II on Spectroscopy 2024 Answers.pdf
 
Basic Civil Engineering Notes of Chapter-6, Topic- Ecosystem, Biodiversity G...
Basic Civil Engineering Notes of Chapter-6,  Topic- Ecosystem, Biodiversity G...Basic Civil Engineering Notes of Chapter-6,  Topic- Ecosystem, Biodiversity G...
Basic Civil Engineering Notes of Chapter-6, Topic- Ecosystem, Biodiversity G...
 
Digital Tools and AI for Teaching Learning and Research
Digital Tools and AI for Teaching Learning and ResearchDigital Tools and AI for Teaching Learning and Research
Digital Tools and AI for Teaching Learning and Research
 
Unit 8 - Information and Communication Technology (Paper I).pdf
Unit 8 - Information and Communication Technology (Paper I).pdfUnit 8 - Information and Communication Technology (Paper I).pdf
Unit 8 - Information and Communication Technology (Paper I).pdf
 
Template Jadual Bertugas Kelas (Boleh Edit)
Template Jadual Bertugas Kelas (Boleh Edit)Template Jadual Bertugas Kelas (Boleh Edit)
Template Jadual Bertugas Kelas (Boleh Edit)
 

Computer assistance in statistical methods.28.04.2021

  • 1. BASIC WORKSHOP OF RESEARCH METHODOLOGY MUHS,NASHIK COMMON STATISTICAL SOFTWARE’S AND ITS APPLICATIONS Dr. Anjali Upadhye M.Sc.(Statistics),M.B.A.,PGDTQM,Ph.D. Head of Department,Research ,ADAMC,Ashta (Contact :+91 9922494537 , anjaliupadhye1511@gmail.com) 1
  • 2. COMMON STATISTICAL SOFTWARE’S AND ITS APPLICATIONS LEARNING OBJECTIVES – Introduction – Features of Statistical software – MS-EXCEL – SPSS: Statistical Package for the Social Sciences – EPI INFO – SAS: Statistical Analysis System – E-views: Statistical Package for windows – MINITAB – STATA – R & MATLAB – PSPP – G POWER TOOLS – REVMAN software for systematic review – Write about other Statistical related Software’s 2 www.statsanjal.in
  • 3. Introduction ■ Statistical analysis is the science of collecting, exploring and presenting large amounts of data to discover underlying patterns and trends and these are applied every day in research, industry and government to become more scientific about decisions that need to be made. Statistical software’s helps in analysis of data. ■ The software can either read data directly from EXCEL spreadsheet, a user can enter the data directly to software, or has specialized data entry software to capture data. ■ The statistical software’s then manipulates the information they possess to discover patterns which can help the user uncover the predictions and help to interpret the data. 3 www.statsanjal.in
  • 5. Initial steps to enter Statistical Software’s in research project ■ Getting your data ready to enter into the software. ■ Defining and labeling variable ■ Entering data appropriately with each row containing each case and each column as variable. ■ Data checking and cleaning is possible. – All data should be numeric, although it may not be all variables it is not desirable to use letter or word (String variable) as data. This can be achieved by recoding the letter or word (string data) into desirable numeric and labeled appropriately. – Data exploration can be done to check for errors and other accuracy. – The statistical level of significance for rejecting null hypothesis (Ho) is when your p-value significance is less than0.05. 5 www.statsanjal.in
  • 6. MS-EXCEL ■ This is part of the Microsoft Office suite of programs. Excel version 1.0 was first released in 1985, with the latest version Excel 2016.Microsoft Excel 2010 is one of the most popular software applications worldwide and is part of the Microsoft Office 2010 productivity suite. ■ You can use Excel to analyze data, for example, in accounts, budgets, billing and many other areas. ■ Excel allows you to explore the menu bar and the different tasks that can be done with it. ■ You can work on sample spreadsheets doing basic math, adding and deleting columns and rows, and preparing the worksheet for printing. ■ You can run your data visually to show trends, patterns and comparisons between the data in a chart, table or other template, and Excel performs most general statistical analyses but weak in regression, logistic regression, survival analysis, analysis of variance, factor analysis, multivariate analysis. 6 www.statsanjal.in
  • 7. SPSS: STATISTICAL PACKAGE FOR THE SOCIAL SCIENCES ■ SPSS stands for Statistical Package for the Social Sciences. It was one of the earliest statistical packages with Version 1 being released in 1968, well before the advent of desktop computers. ■ SPSS assists the user in describing data, testing hypotheses and looking for a correlation or relationship between one or more variables. SPSS is very suitable for most regression analysis and different kinds of ANOVA (regression, logistic regression, survival analysis, analysis of variance, factor analysis, multivariate analysis but not suitable for time series analysis and multilevel regression analysis)-Wikipedia (2014). 7 www.statsanjal.in
  • 8. EPI INFO Epi Info is public domain statistical software for epidemiology developed by Centers for Disease Control and Prevention (CDC) in Atlanta, Georgia (USA). Epi Info has been in existence for over 20 years and is currently available for Microsoft windows. http://www.cdc.gov/epiinfo. 8
  • 9. SAS: STATISTICAL ANALYSIS SYSTEM ■ SAS - SAS stands for Statistical Analysis System. ■ It was developed at the North Carolina State University in 1966, so is contemporary with SPSS &which has its latest version produced in December 2011 is a package that many "power users" like because of its power and programmability. ■ SAS is one of the packages that are difficult to learn. ■ To use SAS, you must write SAS programs that manipulate your data and perform your data analyses. ■ SAS performs most general statistical analyses (regression, logistic regression, survival analysis, analysis of variance, factor analysis, multivariate analysis). The greatest strengths of SAS are probably in its ANOVA, mixed model analysis and multivariate analysis, while it is probably weakest in ordinal and multinomial logistic ■ Regression (because these commands are especially difficult), and robust methods (it is difficult to perform robust regression, or other kinds of robust methods) 9 www.statsanjal.in
  • 10. E-VIEWS: STATISTICAL PACKAGE FOR WINDOWS E-Views is a statistical package for window, used mainly for time-series oriented econometrics analysis. EViews can be used for general statistical analysis and econometric analyses, such as cross-section and panel data analysis and time series estimation and forecasting. EViews relies heavily on a proprietary and undocumented file format for data storage. 10
  • 11. MINITAB & MATLAB ■ MINITAB is statistical software used by educators, students, scientists, business associates and researchers to provide statistical software in a multitude of areas. MINITAB, developed around 1990, and remains one of the oldest statistical software programs available. MINITAB has compatibility with PC, Macintosh, Linux and all other major platforms. ■ MINITAB performs most general statistical analyses (regression, logistic regression, survival analysis, analysis of variance, factor analysis, but has its weaknesses in general linear model (GLM) and Multilevel regression). 11 www.statsanjal.in
  • 12. STATA ■ Stata is a more recent statistical package with Version 1 being released in 1985. Since then, it has become increasingly popular in the areas of epidemiology and economics, and probably now rivals SPSS and SAS in it user base. ■ STATA is a powerful statistical package with smart data-management facilities, a wide array of up-to-date statistical techniques, and an excellent system for producing publication-quality graphs ■ STATA performs most general statistical analyses (regression, logistic regression, survival analysis, analysis of variance, factor analysis, multivariate analysis and time series analysis). 12 www.statsanjal.in
  • 13. R & MATLAB R ■ S-plus is a statistical programming language developed in Seattle in 1988. R is a free version of S- plus developed in 1996. Since then, the original team has expanded to include dozens of individuals from all over the globe. Because it is a programming language and environment, it is used by giving the software a series of commands, often saved in text documents called syntax files or scripts, rather than having a menu-based system. Because of this, it is probably best used by people already reasonably expert at statistical analysis, or who have an affinity for computers. Good points ■ Very powerful – easily matches or even surpasses many of the models found in SAS or Statas ■ Researchers around the world write their own procedures in R, which are then available to all users ■ Free! At http://cran.csiro.au/ 13 www.statsanjal.in
  • 14. Effect Size Calculations: Example 14 www.statsanjal.in
  • 15. Sample Size Calculation with G Power* 15 www.statsanjal.in
  • 16. Reliability Analysis (Normality Check) Variables Reliability Statistics Normality Cronbach's Alphaa Cronbach's Alpha Based on Standardized Items N of Items Demographic Characteristics about Purchase of Green Products 0.463 0.474 5 Deviated Consumer's Awareness about the green products 0.927 0.911 19 Normal Green products purchased by the Consumers 0.959 0.962 10 Normal Reasons for purchase of green products 0.875 0.804 7 Normal Influencing key aspects of green products 0.888 0.895 13 Normal Influencing factors for purchase decision of green products 0.483 0.165 7 Deviated Consumer behavioral perceptions regarding value of being ecofriendly 0.977 0.977 13 Normal Consumer Attitude regarding Green Products 0.900 0.899 13 Normal Opportunities available in future -0.082 0.068 5 Deviated 16 www.statsanjal.in
  • 17. Paired t Test with SPSS 17 www.statsanjal.in
  • 18. Other Software’s for Research Support ■ http://www.unisa.edu.au/Health- Sciences/Research/Biostatistical-and- epidemiological-support/ ■ https://www.surveymonkey.com/ ■ http://www.epidata.dk/download.php ■ http://www.gpower.hhu.de/en.html ■ www.samplesurvey.com ■ https://www.gnu.org/software/pspp/get.html 18 www.statsanjal.in
  • 19. Meet me on : www.statsanjal.in 19 www.statsanjal.in
  • 20. 1. http://www.statsanjal.in 2. http://www.ijooar.com Contact :9922494537 anjaliupadhye1511@gmail.com 20 www.statsanjal.in