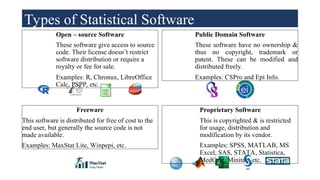
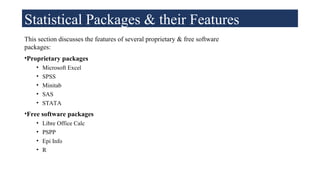
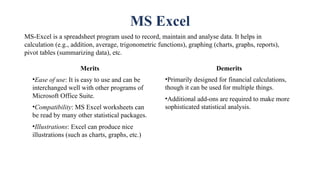
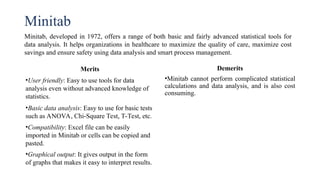
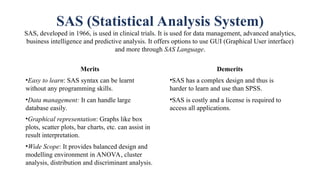
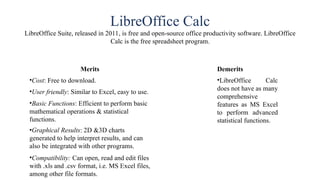
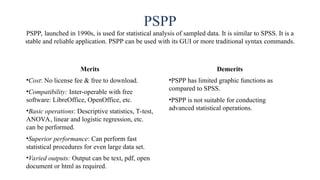
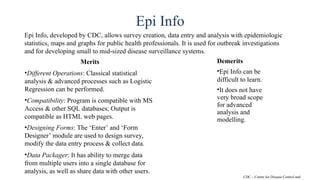
Chapter – 9
Statistical
Packages
Simranjeet
Kaur
Learning Objectives
• To understand a statistical package
• To understand basic features of a statistical
package
• To describe and use statistical package
Chapter Outline
• Importance of Statistics for Nurses
• Introduction to Statistical
packages
• Types of Software
• Features of Statistical Packages
Importance of Statistics for Nurses
• Statistical analysis: Science of collecting, exploring and presenting large amounts of data to discover trends
and underlying patterns.
• Statistical software: Specialized computer program for statistical analysis to help the user make more
observed decisions, uncover opportunities, increase revenue and eventually profits.
• Nurses need to understand the basic statistical terminology (mean, mode, median, etc.) & concepts
(reliability, statistical significance, etc.) while reviewing a research article in a medical journal.
• Importance of Statistics for nurses:
• Advanced career positions, such as nursing professor/ manager require knowledge of statistics.
• Important to design studies to measure specific variables for nursing and healthcare research.
• Used to interpret medical research findings, report the findings and understand their statistical significance.
• Helps nurses recognize and understand trends in healthcare data, resulting in cost savings and improvement in
healthcare.
• Used to identify specific patterns in signs & symptoms to help nurses respond better to any medical change in the
patient.
Open – source Software
These software give access to source
code. Their license doesn’t restrict
software distribution or require a
royalty or fee for sale.
Examples: R, Chronux, LibreOffice
Calc, PSPP, etc.
Public Domain Software
These software have no ownership &
thus no copyright, trademark or
patent. These can be modified and
distributed freely.
Examples: CSPro and Epi Info.
Freeware
This software is distributed for free of cost to the
end user, but generally the source code is not
made available.
Examples: MaxStat Lite, Winpepi, etc.
Proprietary Software
This is copyrighted & is restricted
for usage, distribution and
modification by its vendor.
Examples: SPSS, MATLAB, MS
Excel, SAS, STATA, Statistica,
MedCalc, Minitab, etc.
Types of Statistical Software
Statistical Packages & their Features
This section discusses the features of several proprietary & free software
packages:
•Proprietary packages
• Microsoft Excel
• SPSS
• Minitab
• SAS
• STATA
•Free software packages
• Libre Office Calc
• PSPP
• Epi Info
• R
MS Excel
MS-Excel is a spreadsheet program used to record, maintain and analyse data. It helps in
calculation (e.g., addition, average, trigonometric functions), graphing (charts, graphs, reports),
pivot tables (summarizing data), etc.
Merits
•Ease of use: It is easy to use and can be
interchanged well with other programs of
Microsoft Office Suite.
•Compatibility: MS Excel worksheets can
be read by many other statistical packages.
•Illustrations: Excel can produce nice
illustrations (such as charts, graphs, etc.)
Demerits
•Primarily designed for financial calculations,
though it can be used for multiple things.
•Additional add-ons are required to make more
sophisticated statistical analysis.
SPSS (Statistical Package for the Social Sciences)
SPSS is a powerful tool for data analysis and helps creating reports of data in form of
graphical presentations that can be used for publishing and reporting. It is commonly used in
healthcare industry to support medical research, improve disease management, and monitor
patient care.
Merits
•User friendly: SPSS is easy to learn and use.
•Good Data management: Easier and quicker as
it knows location of the cases & variables.
•Suitable for Report Generation: Rich graphics
that helps to easily interpret results.
•Compatibility: It can be used either with menu
or syntax files.
•Comprehensive Statistics: ANOVA, Frequency
– distribution, correlation, etc. can be performed
easily.
•Wide Scope: Functionality such as predictive
modelling, trend analysis, ML algorithms, etc.
Demerits
•Focuses mainly on statistical methods used
in social sciences and market research.
•Expensive to purchase for students.
•Usually additional training is required to
understand all the available features.
Minitab
Minitab, developed in 1972, offers a range of both basic and fairly advanced statistical tools for
data analysis. It helps organizations in healthcare to maximize the quality of care, maximize cost
savings and ensure safety using data analysis and smart process management.
Merits
•User friendly: Easy to use tools for data
analysis even without advanced knowledge of
statistics.
•Basic data analysis: Easy to use for basic tests
such as ANOVA, Chi-Square Test, T-Test, etc.
•Compatibility: Excel file can be easily
imported in Minitab or cells can be copied and
pasted.
•Graphical output: It gives output in the form
of graphs that makes it easy to interpret results.
Demerits
•Minitab cannot perform complicated statistical
calculations and data analysis, and is also cost
consuming.
SAS (Statistical Analysis System)
SAS, developed in 1966, is used in clinical trials. It is used for data management, advanced analytics,
business intelligence and predictive analysis. It offers options to use GUI (Graphical User interface)
and more through SAS Language.
Merits
•Easy to learn: SAS syntax can be learnt
without any programming skills.
•Data management: It can handle large
database easily.
•Graphical representation: Graphs like box
plots, scatter plots, bar charts, etc. can assist in
result interpretation.
•Wide Scope: It provides balanced design and
modelling environment in ANOVA, cluster
analysis, distribution and discriminant analysis.
Demerits
•SAS has a complex design and thus is
harder to learn and use than SPSS.
•SAS is costly and a license is required to
access all applications.
STATA
STATA, released in 1985, is popular in the field of economics and political science. It also has GUI
and command line function.
Merits
•User friendly: Command line functions
have easy-to-learn syntax.
•Compatibility: It can import data in a
variety of formats, such as .csv and .xls
format.
•Powerful: More powerful than SPSS, and is
useful for advanced regression modelling.
•Customized Graphics: Custom graphs can
be created and exported to different formats
for the purpose of publication.
Demerits
•STATA is limited to certain types of data
only.
•It is harder to learn as compared to SPSS.
•New functions cannot be programmed into
STATA.
LibreOffice Calc
LibreOffice Suite, released in 2011, is free and open-source office productivity software. LibreOffice
Calc is the free spreadsheet program.
Merits
•Cost: Free to download.
•User friendly: Similar to Excel, easy to use.
•Basic Functions: Efficient to perform basic
mathematical operations & statistical
functions.
•Graphical Results: 2D &3D charts
generated to help interpret results, and can
also be integrated with other programs.
•Compatibility: Can open, read and edit files
with .xls and .csv format, i.e. MS Excel files,
among other file formats.
Demerits
•LibreOffice Calc
does not have as many
comprehensive
features as MS Excel
to perform advanced
statistical functions.
PSPP
PSPP, launched in 1990s, is used for statistical analysis of sampled data. It is similar to SPSS. It is a
stable and reliable application. PSPP can be used with its GUI or more traditional syntax commands.
Merits
•Cost: No license fee & free to download.
•Compatibility: Inter-operable with free
software: LibreOffice, OpenOffice, etc.
•Basic operations: Descriptive statistics, T-test,
ANOVA, linear and logistic regression, etc.
can be performed.
•Superior performance: Can perform fast
statistical procedures for even large data set.
•Varied outputs: Output can be text, pdf, open
document or html as required.
Demerits
•PSPP has limited graphic functions as
compared to SPSS.
•PSPP is not suitable for conducting
advanced statistical operations.
Epi Info
Epi Info, developed by CDC, allows survey creation, data entry and analysis with epidemiologic
statistics, maps and graphs for public health professionals. It is used for outbreak investigations
and for developing small to mid-sized disease surveillance systems.
Merits
•Different Operations: Classical statistical
analysis & advanced processes such as Logistic
Regression can be performed.
•Compatibility: Program is compatible with MS
Access & other SQL databases; Output is
compatible as HTML web pages.
•Designing Forms: The ‘Enter’ and ‘Form
Designer’ module are used to design survey,
modify the data entry process & collect data.
•Data Packager: It has ability to merge data
from multiple users into a single database for
analysis, as well as share data with other users.
Demerits
•Epi Info can be
difficult to learn.
•It does not have
very broad scope
for advanced
analysis and
modelling.
CDC – Centre for Disease Control and
R (R Foundation for Statistical Computing)
R, released in 1993, is a popular programming language and a widely used free statistical software
package for statistical modelling and analysis. It requires a certain degree of coding.
Merits
•Cost: License is not required to work on R.
•Compatibility: Platform-independent language
and is compatible with Windows & Mac OS.
•Comprehensive: Most comprehensive
statistical analysis package & incorporates
statistical tests, models and analysis.
•Advanced Statistics: It has advanced statistical
functions.
•Superior Graphical capabilities: Provides
fully programmable graphics that are better
than other available packages.
Demerits
•R is difficult to learn for people who have
had no prior coding experience.
Features of Statistical Packages
• Wide Scope: Statistical packages are used in healthcare industry, finance, engineering, and other
fields that require statistical analysis for making informed decisions.
• Efficient: Statistical packages are highly efficient and accurate. They calculate results far more
efficiently than manual calculation.
• High Performance: Statistical packages work on advanced statistical techniques for data
analysis and hence deliver high performance.
• Data based Results: Advanced statistical techniques are used to process and analyse the
collected data to make decisions. This helps in practical situations, to face challenges or make
informed decisions based on concrete parameters.
• Graphic Visualization: Graphical results are presented to help user visualize and interpret the
results. This also helps in better report writing or publishing the study.
• Storage: Statistical packages have enough storage to save and analyse multiple variables, which
may go up to more than thousands for advanced studies.
Summary
• Statistical analysis is the science of collecting, exploring and presenting large amounts of data
to discover trends and underlying patterns.
• Computational statistics grew and became widely accepted due to inaccuracies when manual
process of sampling and interpreting results was done.
• Statistical packages are either free to download and use (i.e. Open-source, Public domain or
freeware), or required to be purchased (e.g. Proprietary).
• The statistical packages are efficient, high performing, help visualizing results and making
informed decisions.

NURSING-INFORMATICS-Chapter-8-Statistical-Packages.ppt

  • 1.
  • 2.
    Learning Objectives • Tounderstand a statistical package • To understand basic features of a statistical package • To describe and use statistical package
  • 3.
    Chapter Outline • Importanceof Statistics for Nurses • Introduction to Statistical packages • Types of Software • Features of Statistical Packages
  • 4.
    Importance of Statisticsfor Nurses • Statistical analysis: Science of collecting, exploring and presenting large amounts of data to discover trends and underlying patterns. • Statistical software: Specialized computer program for statistical analysis to help the user make more observed decisions, uncover opportunities, increase revenue and eventually profits. • Nurses need to understand the basic statistical terminology (mean, mode, median, etc.) & concepts (reliability, statistical significance, etc.) while reviewing a research article in a medical journal. • Importance of Statistics for nurses: • Advanced career positions, such as nursing professor/ manager require knowledge of statistics. • Important to design studies to measure specific variables for nursing and healthcare research. • Used to interpret medical research findings, report the findings and understand their statistical significance. • Helps nurses recognize and understand trends in healthcare data, resulting in cost savings and improvement in healthcare. • Used to identify specific patterns in signs & symptoms to help nurses respond better to any medical change in the patient.
  • 5.
    Open – sourceSoftware These software give access to source code. Their license doesn’t restrict software distribution or require a royalty or fee for sale. Examples: R, Chronux, LibreOffice Calc, PSPP, etc. Public Domain Software These software have no ownership & thus no copyright, trademark or patent. These can be modified and distributed freely. Examples: CSPro and Epi Info. Freeware This software is distributed for free of cost to the end user, but generally the source code is not made available. Examples: MaxStat Lite, Winpepi, etc. Proprietary Software This is copyrighted & is restricted for usage, distribution and modification by its vendor. Examples: SPSS, MATLAB, MS Excel, SAS, STATA, Statistica, MedCalc, Minitab, etc. Types of Statistical Software
  • 6.
    Statistical Packages &their Features This section discusses the features of several proprietary & free software packages: •Proprietary packages • Microsoft Excel • SPSS • Minitab • SAS • STATA •Free software packages • Libre Office Calc • PSPP • Epi Info • R
  • 7.
    MS Excel MS-Excel isa spreadsheet program used to record, maintain and analyse data. It helps in calculation (e.g., addition, average, trigonometric functions), graphing (charts, graphs, reports), pivot tables (summarizing data), etc. Merits •Ease of use: It is easy to use and can be interchanged well with other programs of Microsoft Office Suite. •Compatibility: MS Excel worksheets can be read by many other statistical packages. •Illustrations: Excel can produce nice illustrations (such as charts, graphs, etc.) Demerits •Primarily designed for financial calculations, though it can be used for multiple things. •Additional add-ons are required to make more sophisticated statistical analysis.
  • 8.
    SPSS (Statistical Packagefor the Social Sciences) SPSS is a powerful tool for data analysis and helps creating reports of data in form of graphical presentations that can be used for publishing and reporting. It is commonly used in healthcare industry to support medical research, improve disease management, and monitor patient care. Merits •User friendly: SPSS is easy to learn and use. •Good Data management: Easier and quicker as it knows location of the cases & variables. •Suitable for Report Generation: Rich graphics that helps to easily interpret results. •Compatibility: It can be used either with menu or syntax files. •Comprehensive Statistics: ANOVA, Frequency – distribution, correlation, etc. can be performed easily. •Wide Scope: Functionality such as predictive modelling, trend analysis, ML algorithms, etc. Demerits •Focuses mainly on statistical methods used in social sciences and market research. •Expensive to purchase for students. •Usually additional training is required to understand all the available features.
  • 9.
    Minitab Minitab, developed in1972, offers a range of both basic and fairly advanced statistical tools for data analysis. It helps organizations in healthcare to maximize the quality of care, maximize cost savings and ensure safety using data analysis and smart process management. Merits •User friendly: Easy to use tools for data analysis even without advanced knowledge of statistics. •Basic data analysis: Easy to use for basic tests such as ANOVA, Chi-Square Test, T-Test, etc. •Compatibility: Excel file can be easily imported in Minitab or cells can be copied and pasted. •Graphical output: It gives output in the form of graphs that makes it easy to interpret results. Demerits •Minitab cannot perform complicated statistical calculations and data analysis, and is also cost consuming.
  • 10.
    SAS (Statistical AnalysisSystem) SAS, developed in 1966, is used in clinical trials. It is used for data management, advanced analytics, business intelligence and predictive analysis. It offers options to use GUI (Graphical User interface) and more through SAS Language. Merits •Easy to learn: SAS syntax can be learnt without any programming skills. •Data management: It can handle large database easily. •Graphical representation: Graphs like box plots, scatter plots, bar charts, etc. can assist in result interpretation. •Wide Scope: It provides balanced design and modelling environment in ANOVA, cluster analysis, distribution and discriminant analysis. Demerits •SAS has a complex design and thus is harder to learn and use than SPSS. •SAS is costly and a license is required to access all applications.
  • 11.
    STATA STATA, released in1985, is popular in the field of economics and political science. It also has GUI and command line function. Merits •User friendly: Command line functions have easy-to-learn syntax. •Compatibility: It can import data in a variety of formats, such as .csv and .xls format. •Powerful: More powerful than SPSS, and is useful for advanced regression modelling. •Customized Graphics: Custom graphs can be created and exported to different formats for the purpose of publication. Demerits •STATA is limited to certain types of data only. •It is harder to learn as compared to SPSS. •New functions cannot be programmed into STATA.
  • 12.
    LibreOffice Calc LibreOffice Suite,released in 2011, is free and open-source office productivity software. LibreOffice Calc is the free spreadsheet program. Merits •Cost: Free to download. •User friendly: Similar to Excel, easy to use. •Basic Functions: Efficient to perform basic mathematical operations & statistical functions. •Graphical Results: 2D &3D charts generated to help interpret results, and can also be integrated with other programs. •Compatibility: Can open, read and edit files with .xls and .csv format, i.e. MS Excel files, among other file formats. Demerits •LibreOffice Calc does not have as many comprehensive features as MS Excel to perform advanced statistical functions.
  • 13.
    PSPP PSPP, launched in1990s, is used for statistical analysis of sampled data. It is similar to SPSS. It is a stable and reliable application. PSPP can be used with its GUI or more traditional syntax commands. Merits •Cost: No license fee & free to download. •Compatibility: Inter-operable with free software: LibreOffice, OpenOffice, etc. •Basic operations: Descriptive statistics, T-test, ANOVA, linear and logistic regression, etc. can be performed. •Superior performance: Can perform fast statistical procedures for even large data set. •Varied outputs: Output can be text, pdf, open document or html as required. Demerits •PSPP has limited graphic functions as compared to SPSS. •PSPP is not suitable for conducting advanced statistical operations.
  • 14.
    Epi Info Epi Info,developed by CDC, allows survey creation, data entry and analysis with epidemiologic statistics, maps and graphs for public health professionals. It is used for outbreak investigations and for developing small to mid-sized disease surveillance systems. Merits •Different Operations: Classical statistical analysis & advanced processes such as Logistic Regression can be performed. •Compatibility: Program is compatible with MS Access & other SQL databases; Output is compatible as HTML web pages. •Designing Forms: The ‘Enter’ and ‘Form Designer’ module are used to design survey, modify the data entry process & collect data. •Data Packager: It has ability to merge data from multiple users into a single database for analysis, as well as share data with other users. Demerits •Epi Info can be difficult to learn. •It does not have very broad scope for advanced analysis and modelling. CDC – Centre for Disease Control and
  • 15.
    R (R Foundationfor Statistical Computing) R, released in 1993, is a popular programming language and a widely used free statistical software package for statistical modelling and analysis. It requires a certain degree of coding. Merits •Cost: License is not required to work on R. •Compatibility: Platform-independent language and is compatible with Windows & Mac OS. •Comprehensive: Most comprehensive statistical analysis package & incorporates statistical tests, models and analysis. •Advanced Statistics: It has advanced statistical functions. •Superior Graphical capabilities: Provides fully programmable graphics that are better than other available packages. Demerits •R is difficult to learn for people who have had no prior coding experience.
  • 16.
    Features of StatisticalPackages • Wide Scope: Statistical packages are used in healthcare industry, finance, engineering, and other fields that require statistical analysis for making informed decisions. • Efficient: Statistical packages are highly efficient and accurate. They calculate results far more efficiently than manual calculation. • High Performance: Statistical packages work on advanced statistical techniques for data analysis and hence deliver high performance. • Data based Results: Advanced statistical techniques are used to process and analyse the collected data to make decisions. This helps in practical situations, to face challenges or make informed decisions based on concrete parameters. • Graphic Visualization: Graphical results are presented to help user visualize and interpret the results. This also helps in better report writing or publishing the study. • Storage: Statistical packages have enough storage to save and analyse multiple variables, which may go up to more than thousands for advanced studies.
  • 17.
    Summary • Statistical analysisis the science of collecting, exploring and presenting large amounts of data to discover trends and underlying patterns. • Computational statistics grew and became widely accepted due to inaccuracies when manual process of sampling and interpreting results was done. • Statistical packages are either free to download and use (i.e. Open-source, Public domain or freeware), or required to be purchased (e.g. Proprietary). • The statistical packages are efficient, high performing, help visualizing results and making informed decisions.