Download to read offline
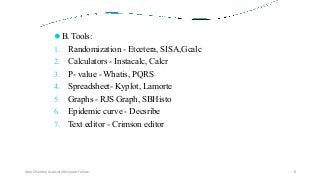
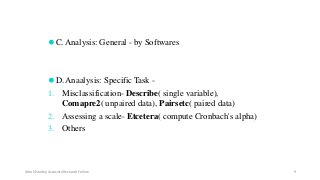
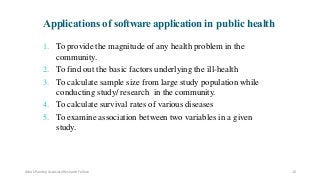
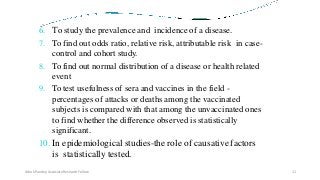
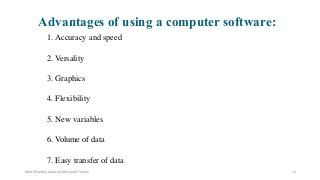
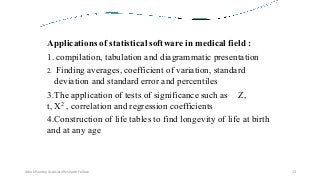
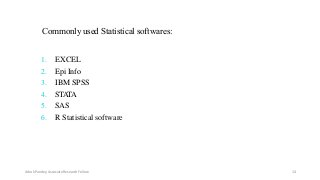
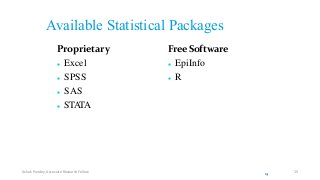
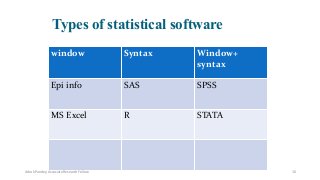
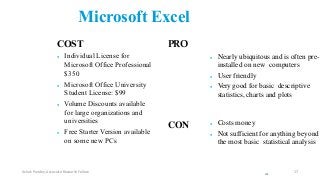
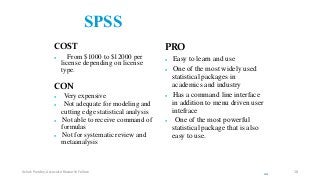
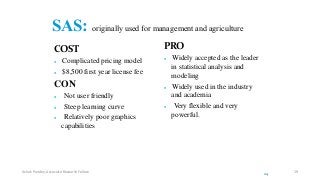
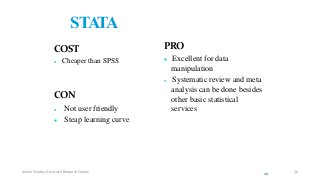
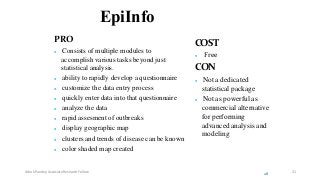
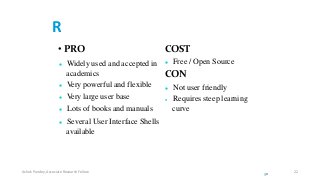
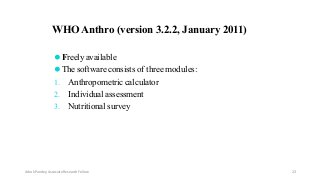
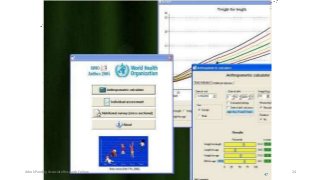
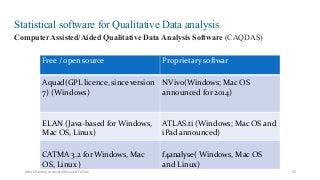
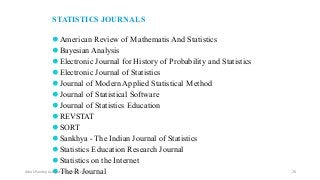


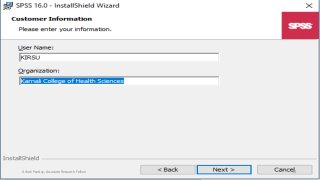
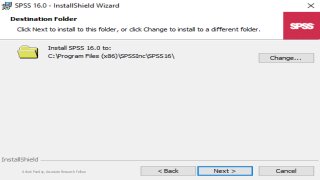
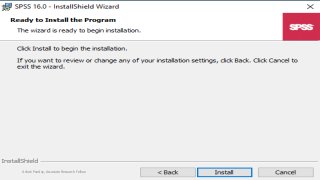
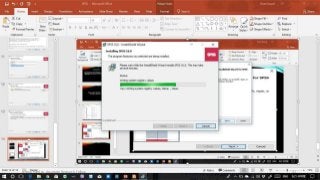


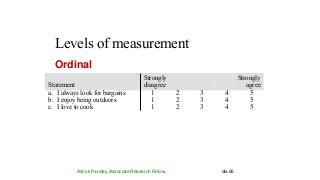
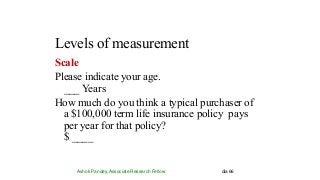
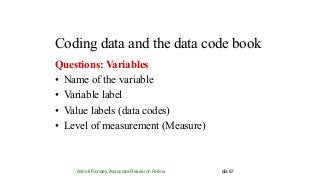
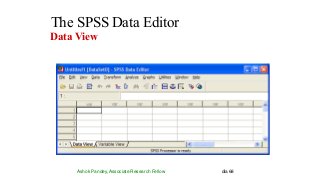


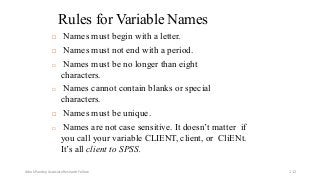
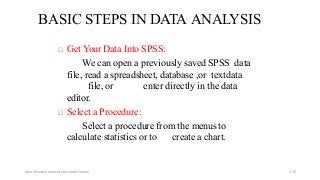
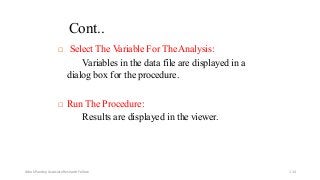
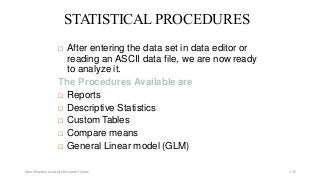
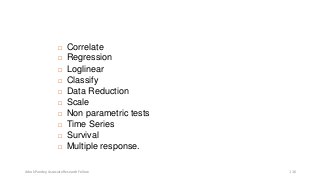


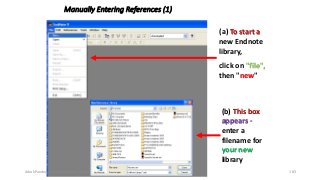
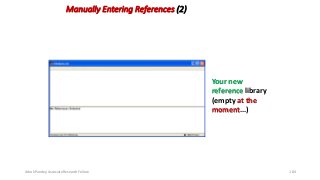
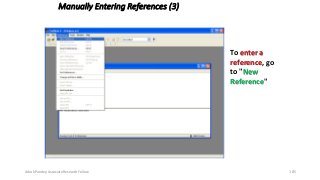
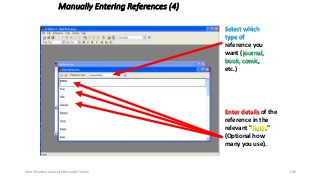
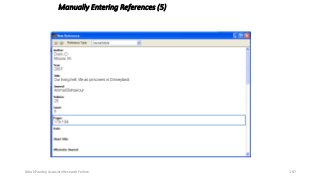
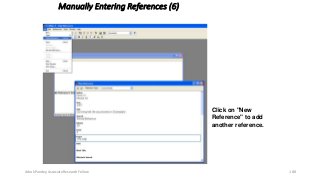
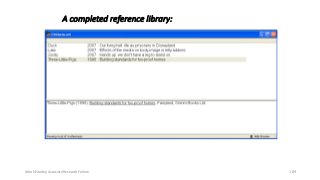
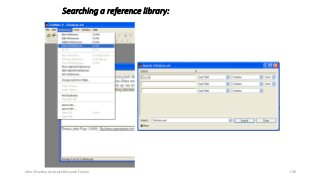
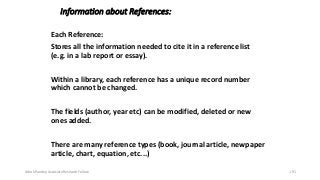
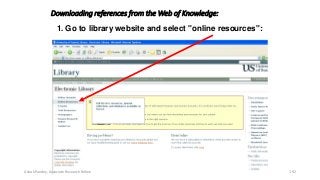
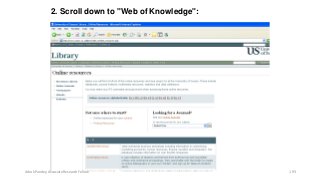
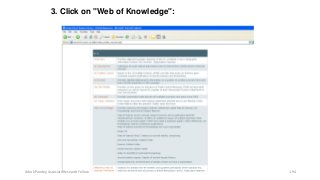


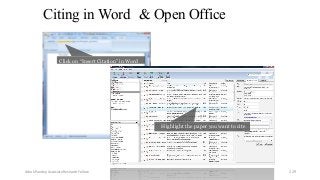
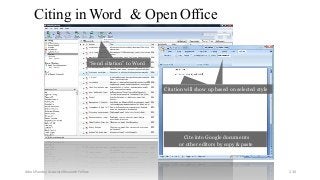
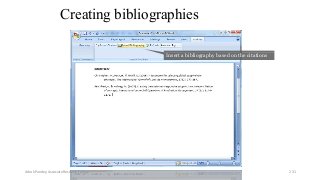
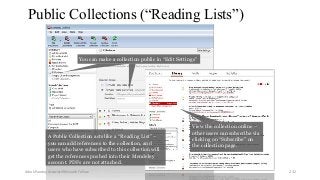

The document provides an overview of statistical methods and software applications in health sciences and research. It discusses tools for reference management, sample size calculation, and planning clinical trials, as well as specific statistical software like SPSS, R, and others. Additionally, it highlights the advantages of using statistical software, types of statistical analyses, and practical applications in public health.