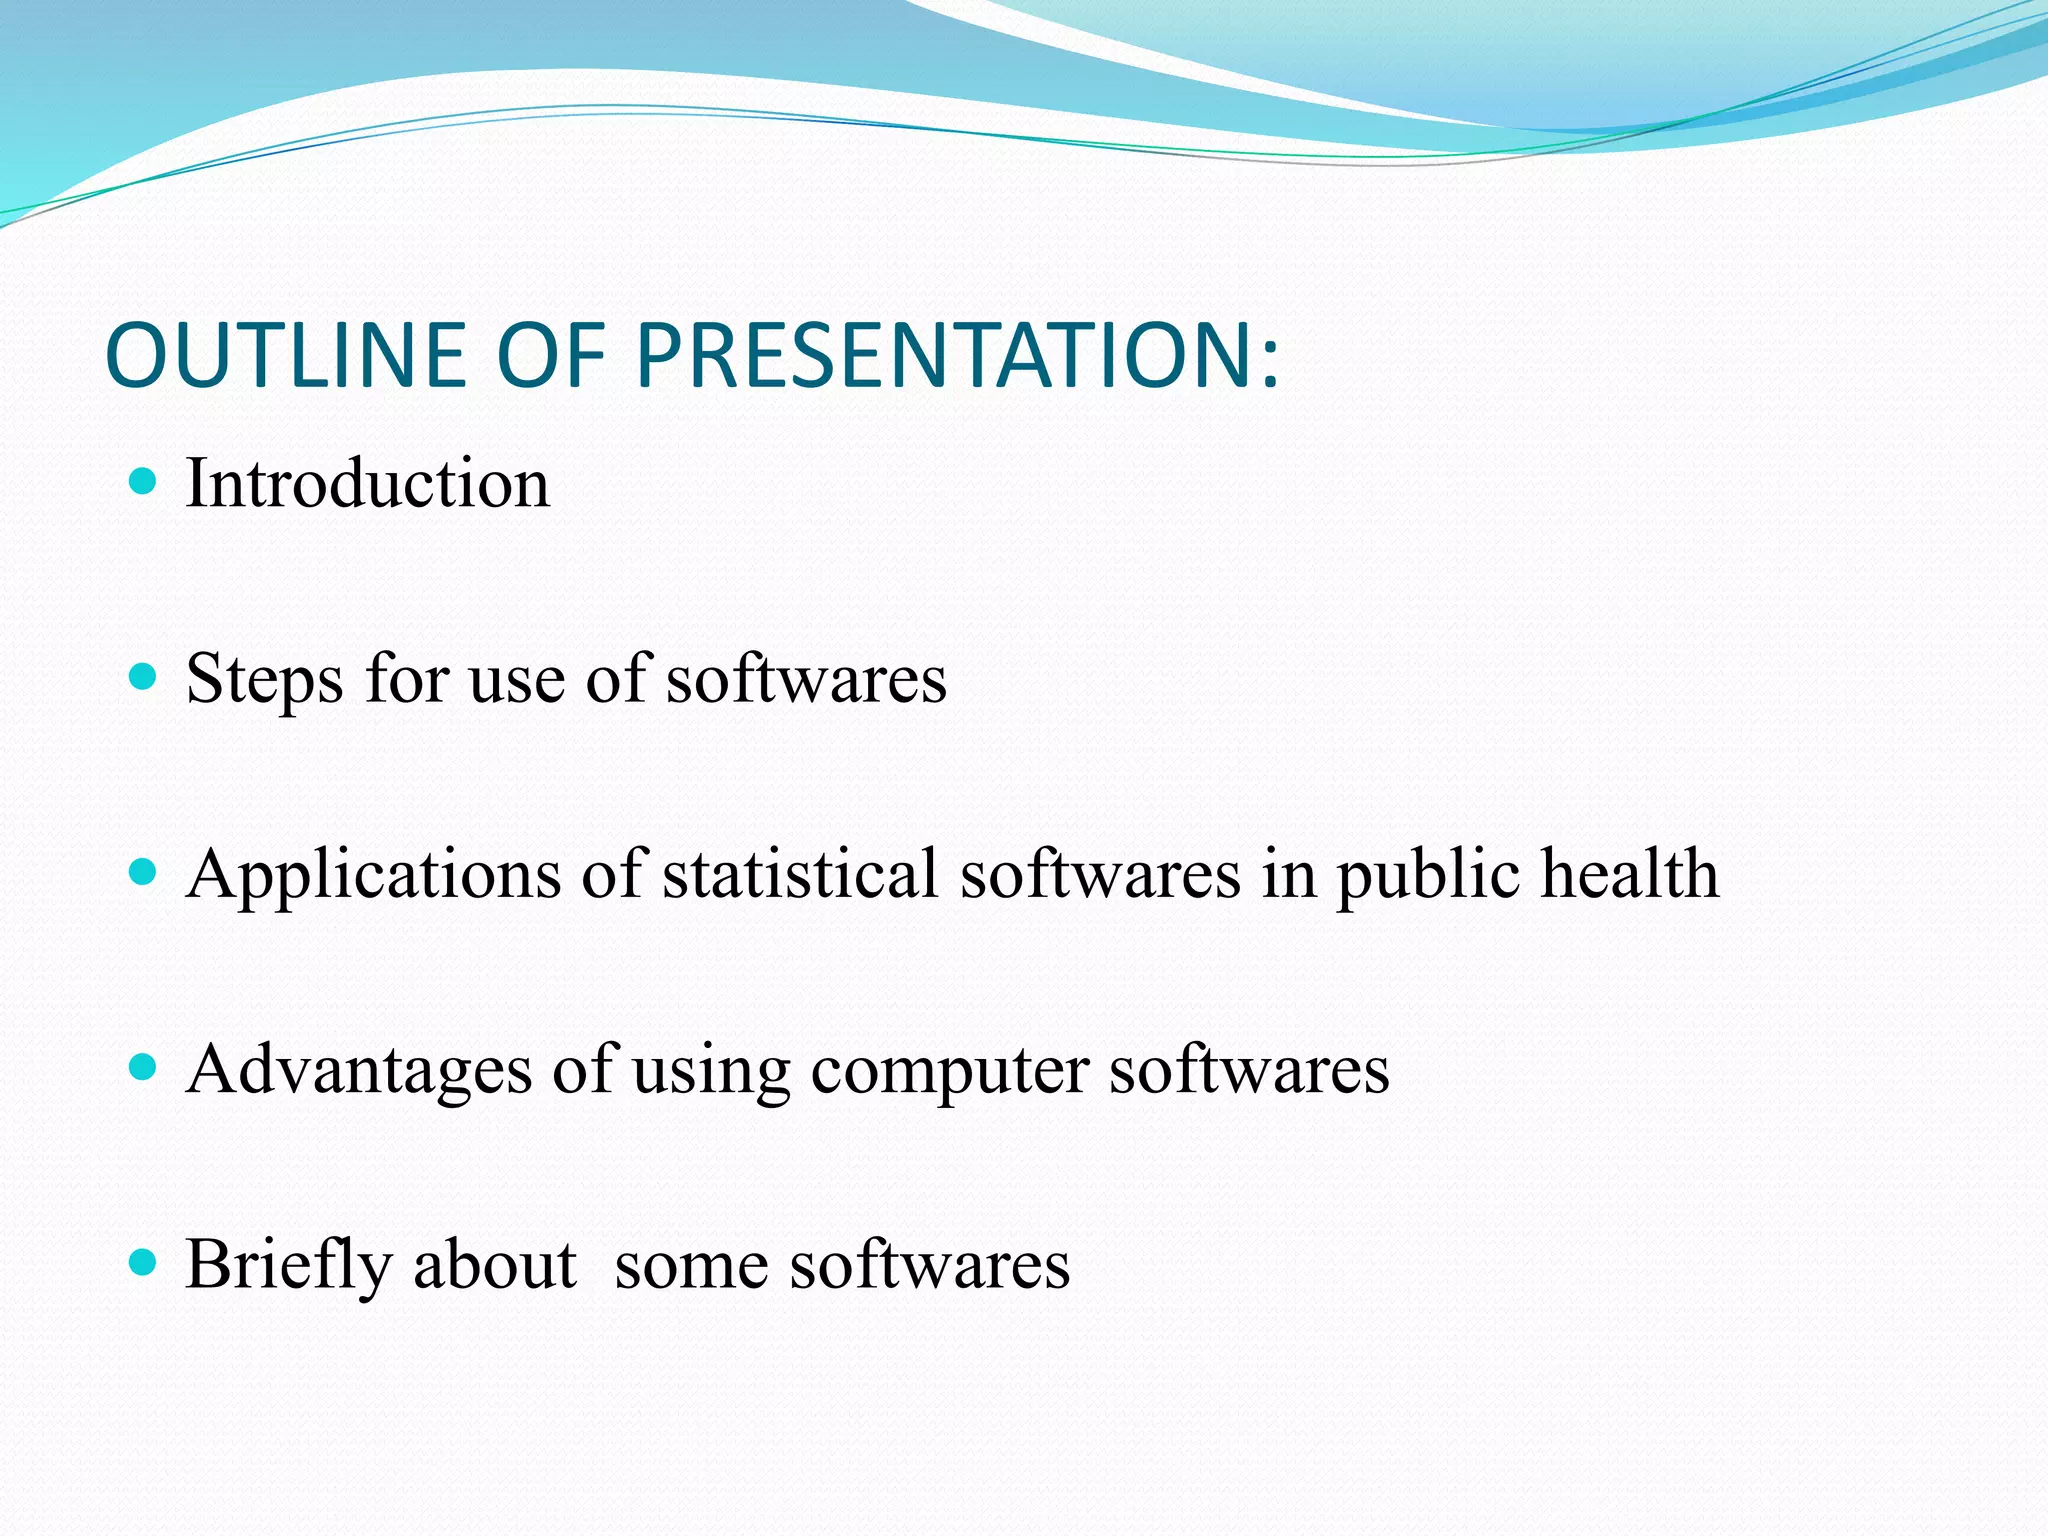
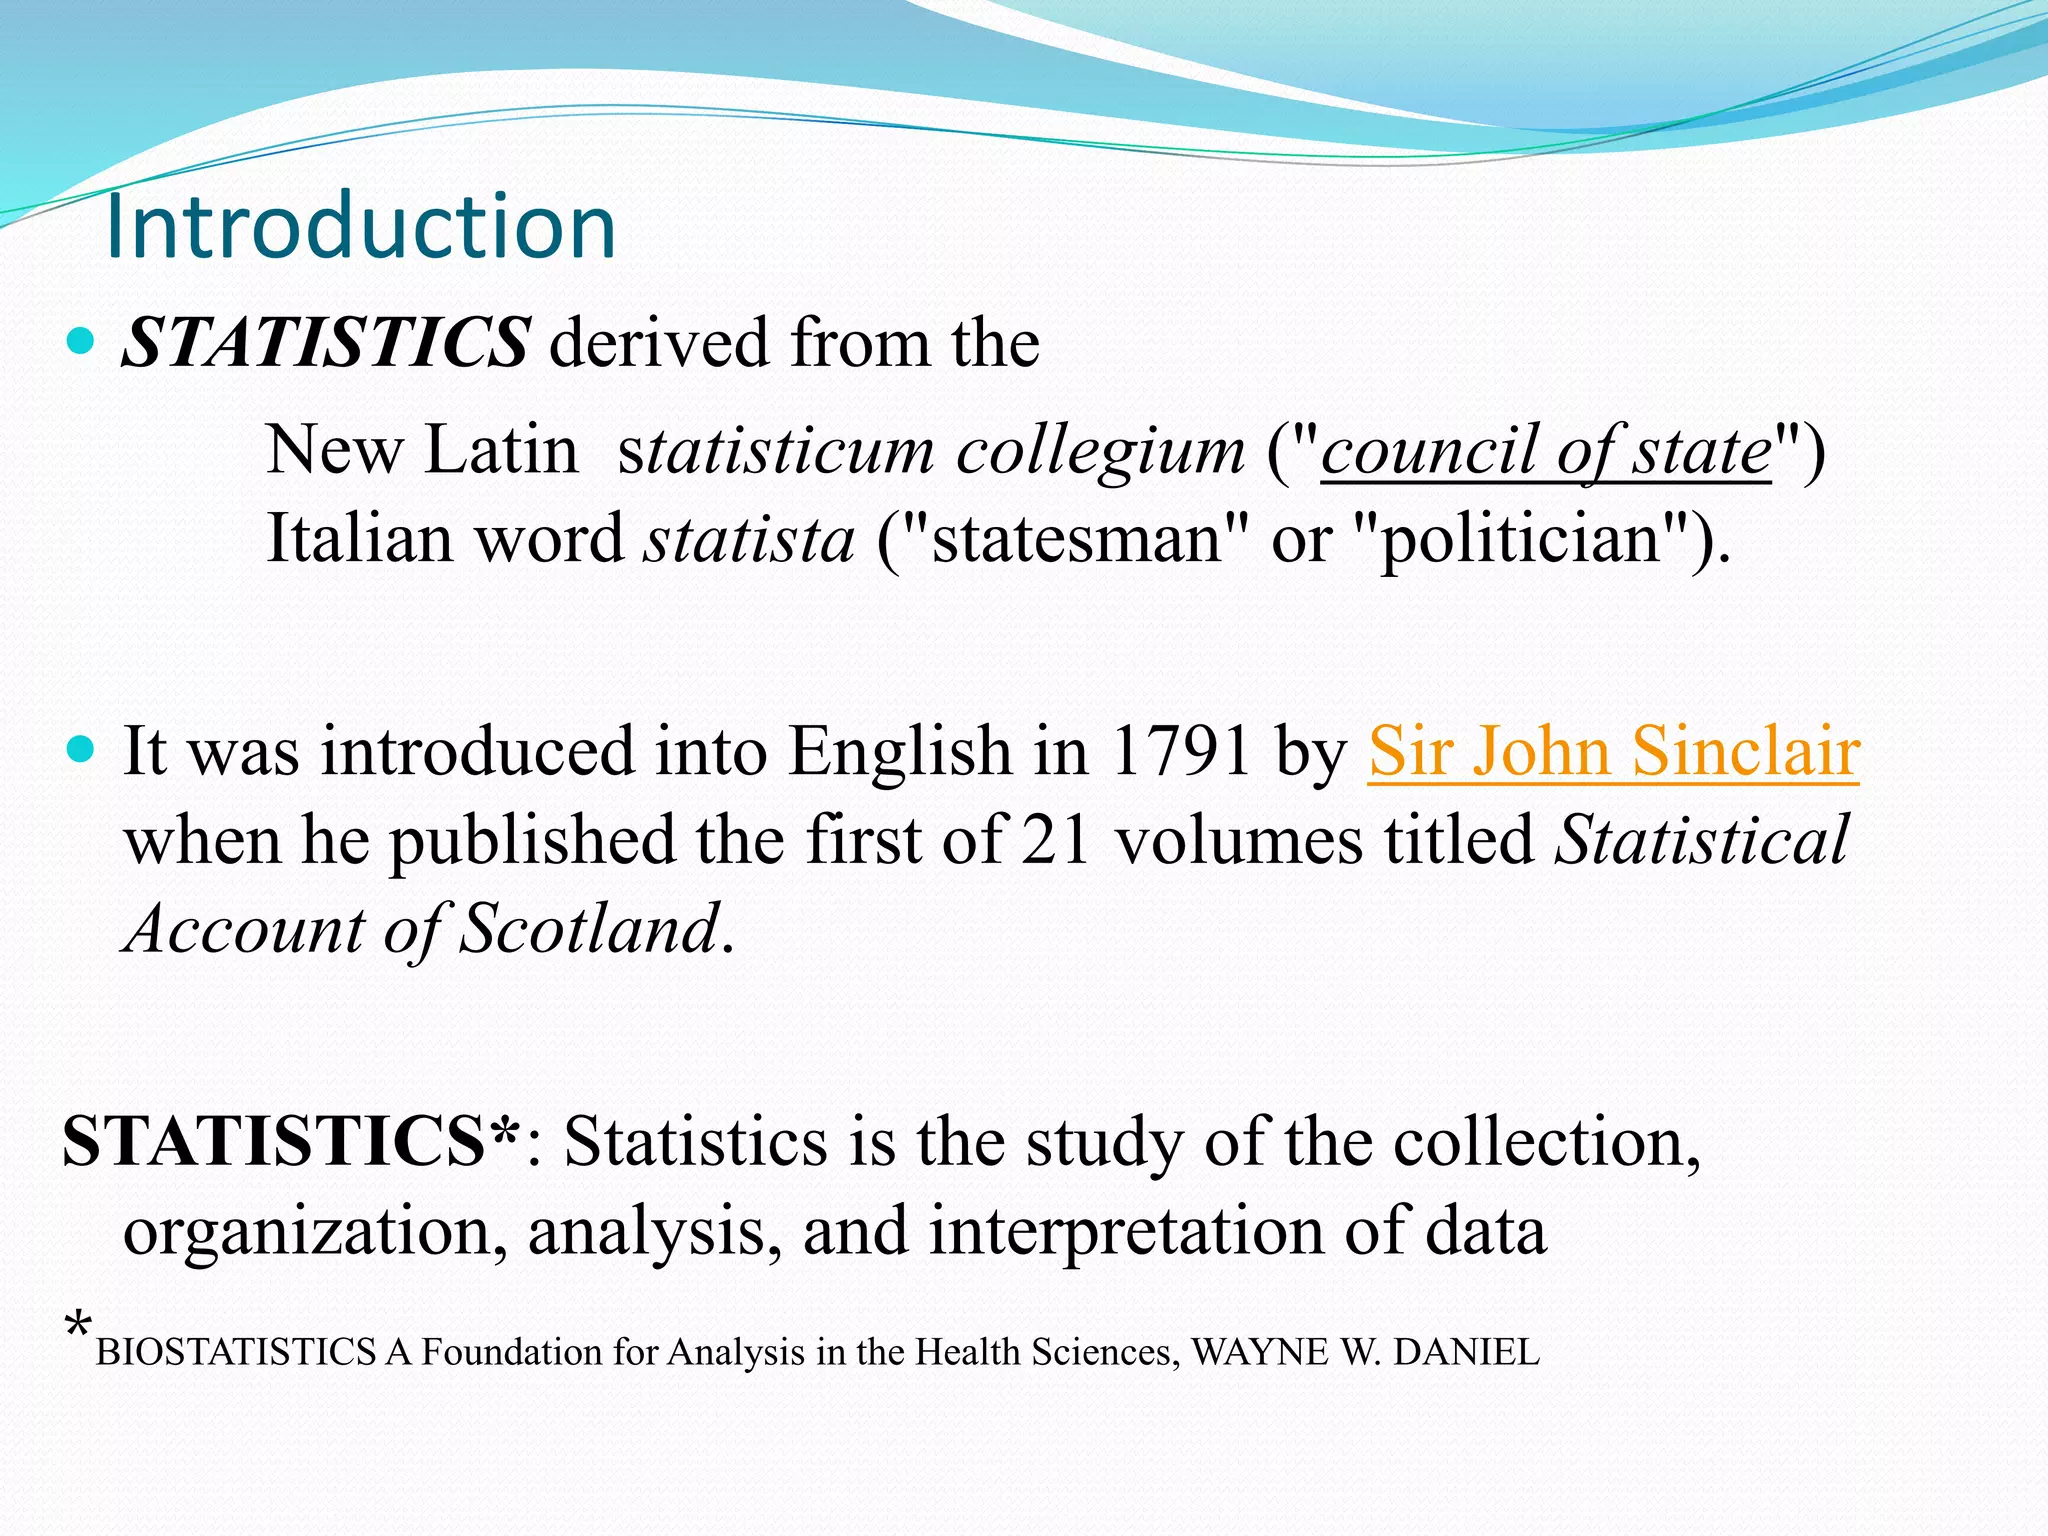
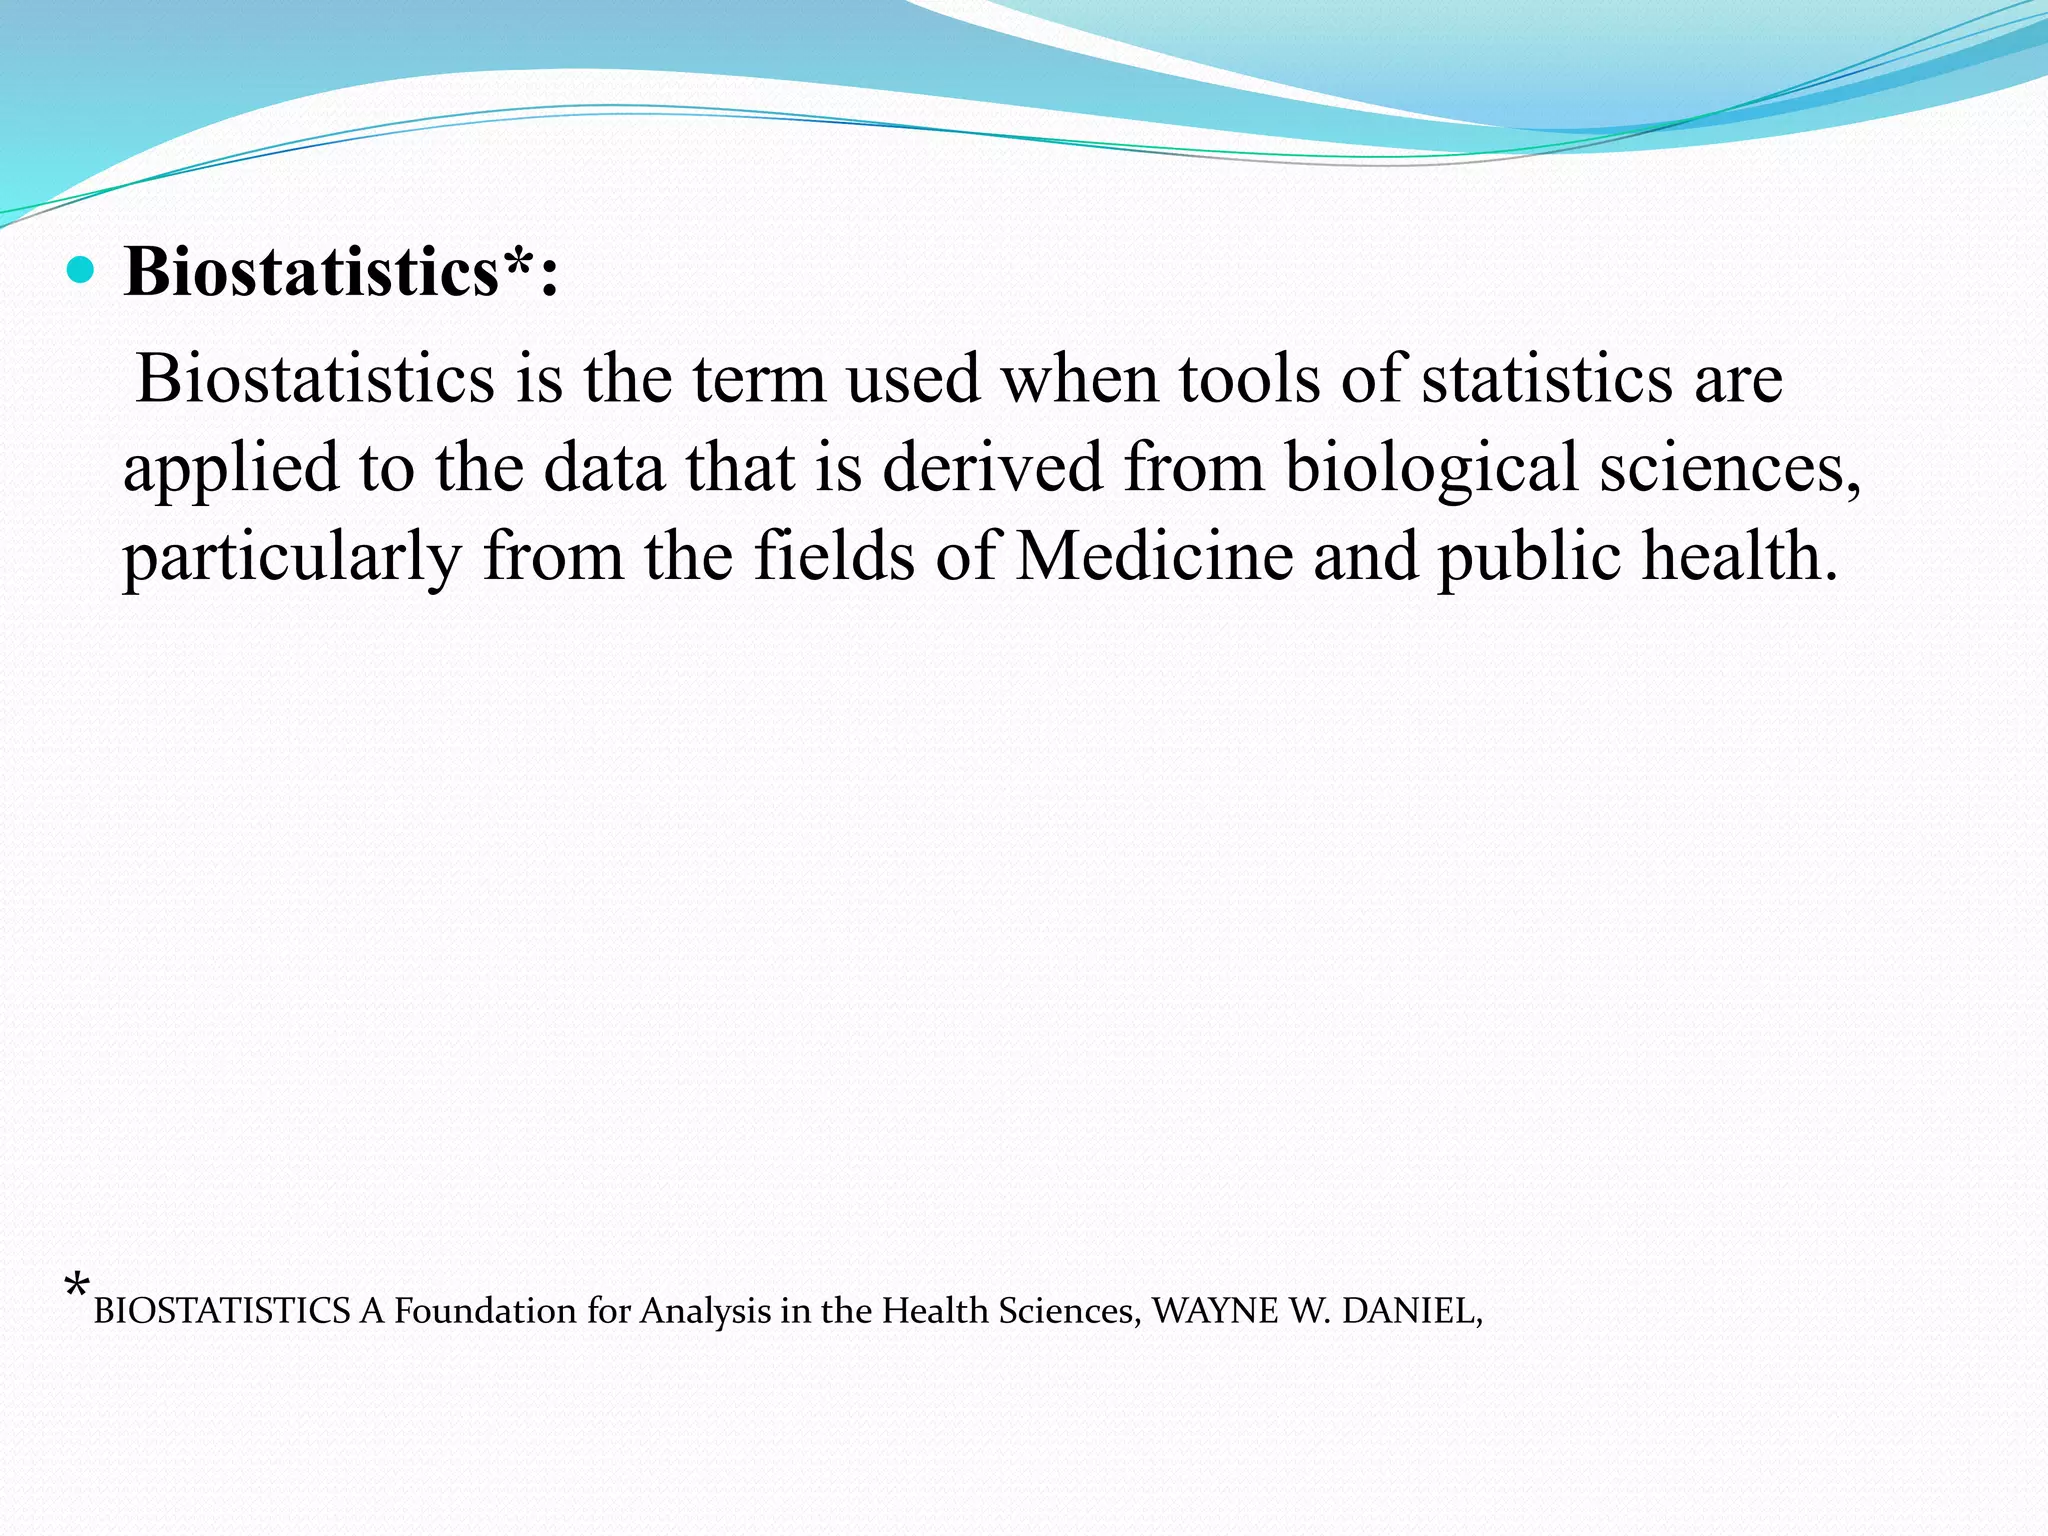
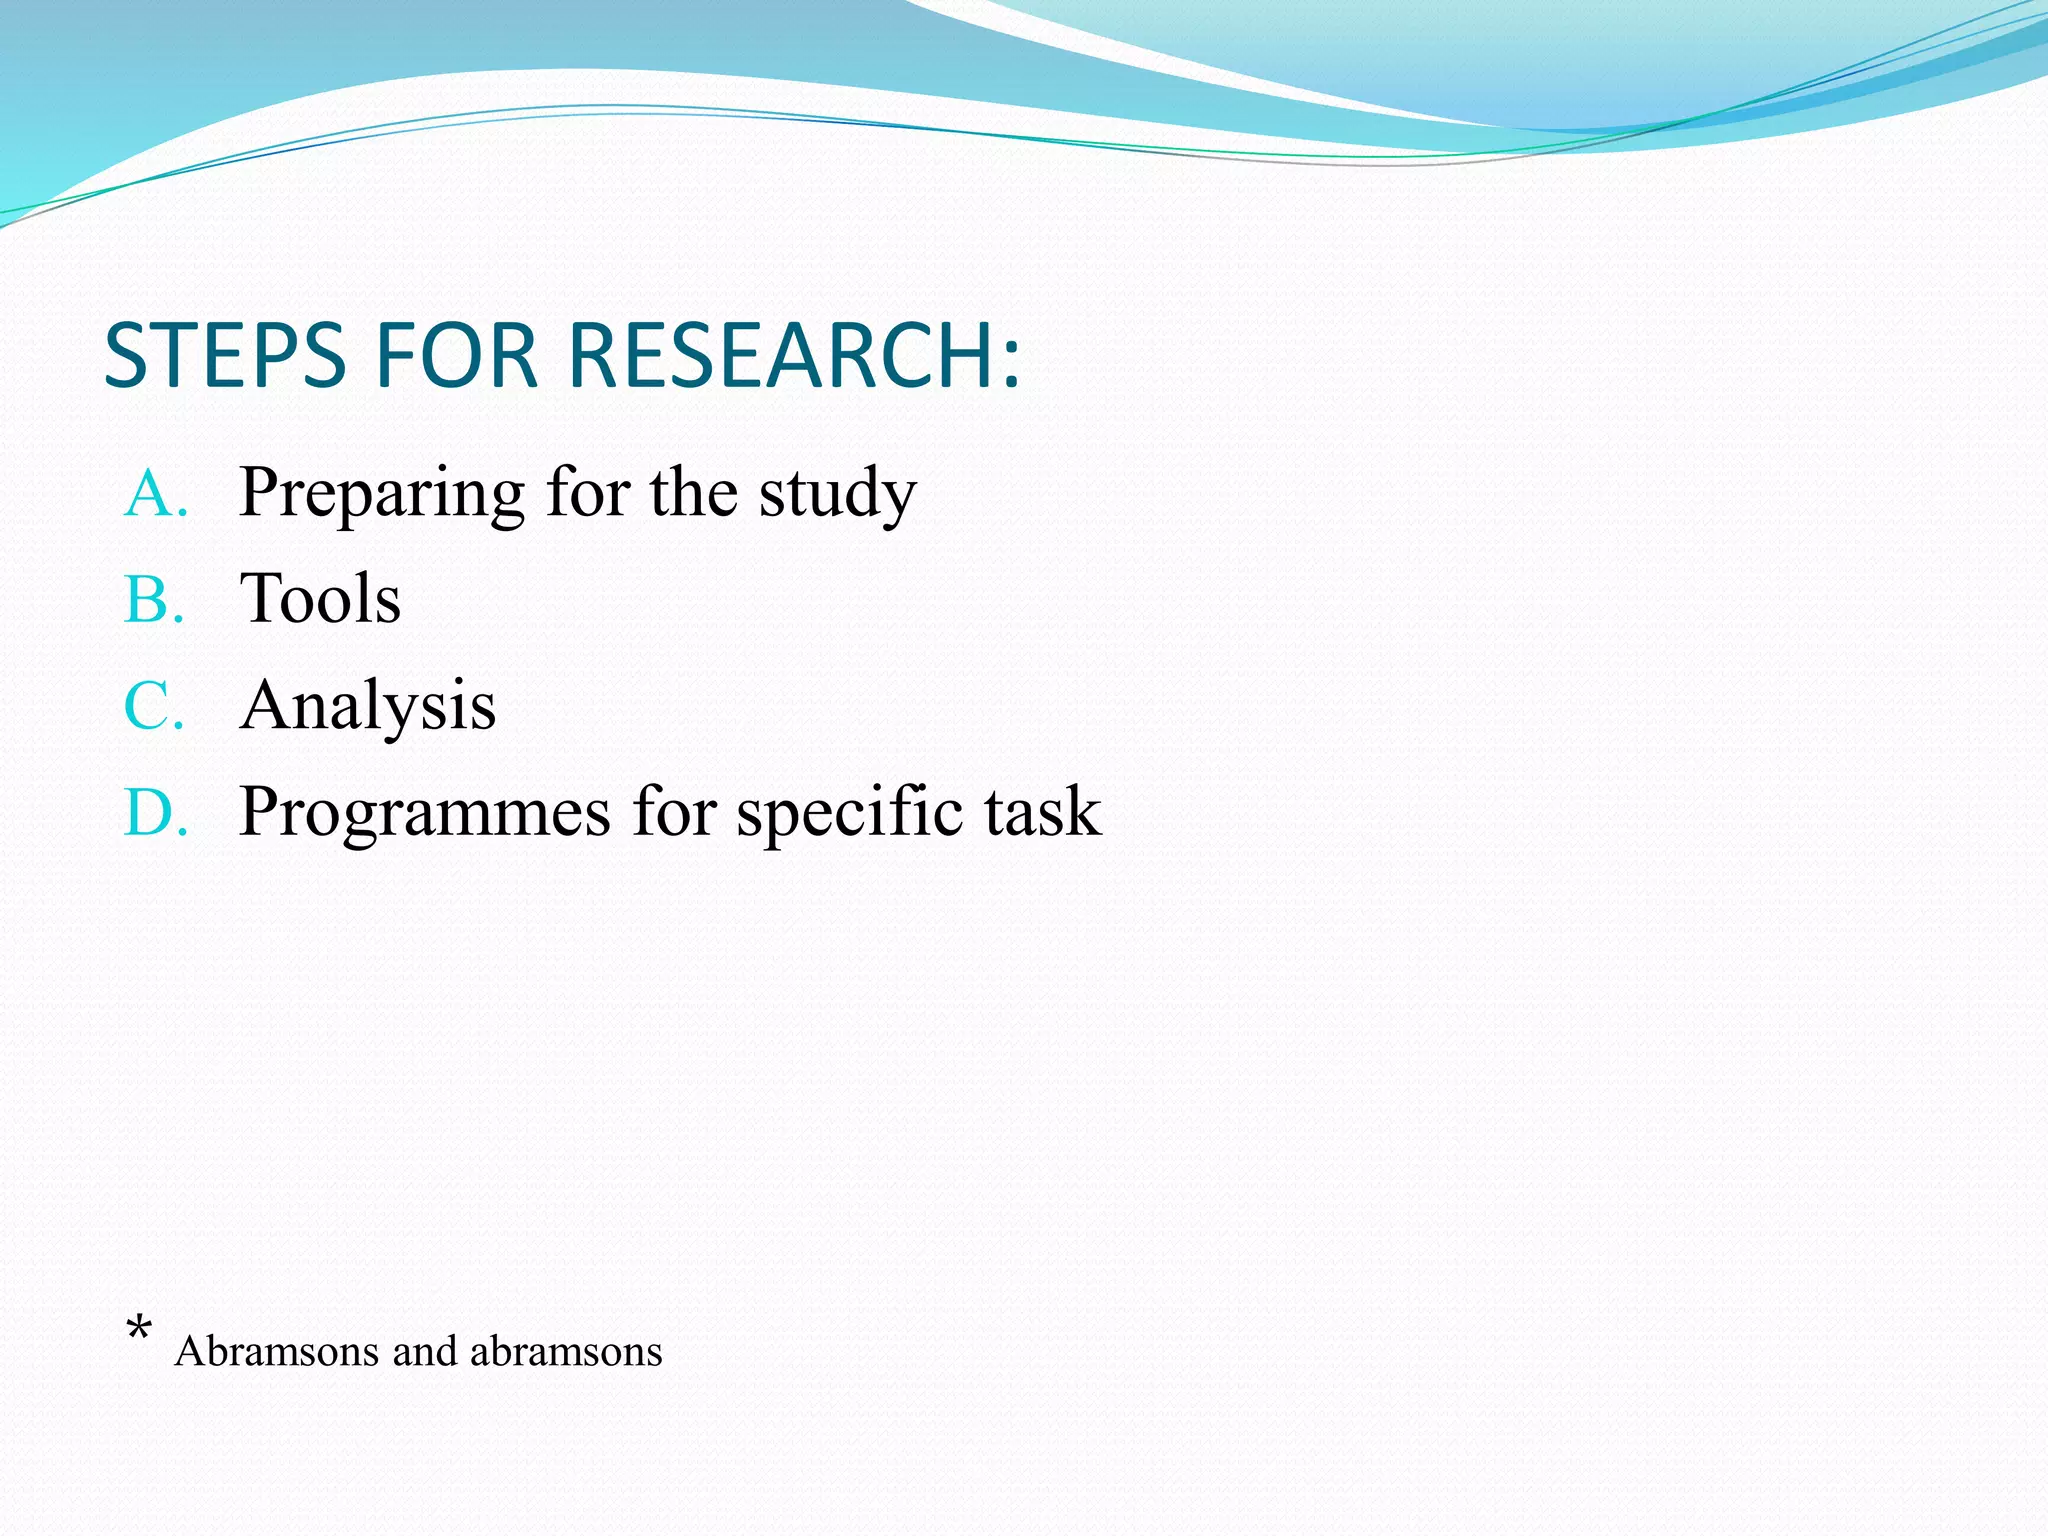
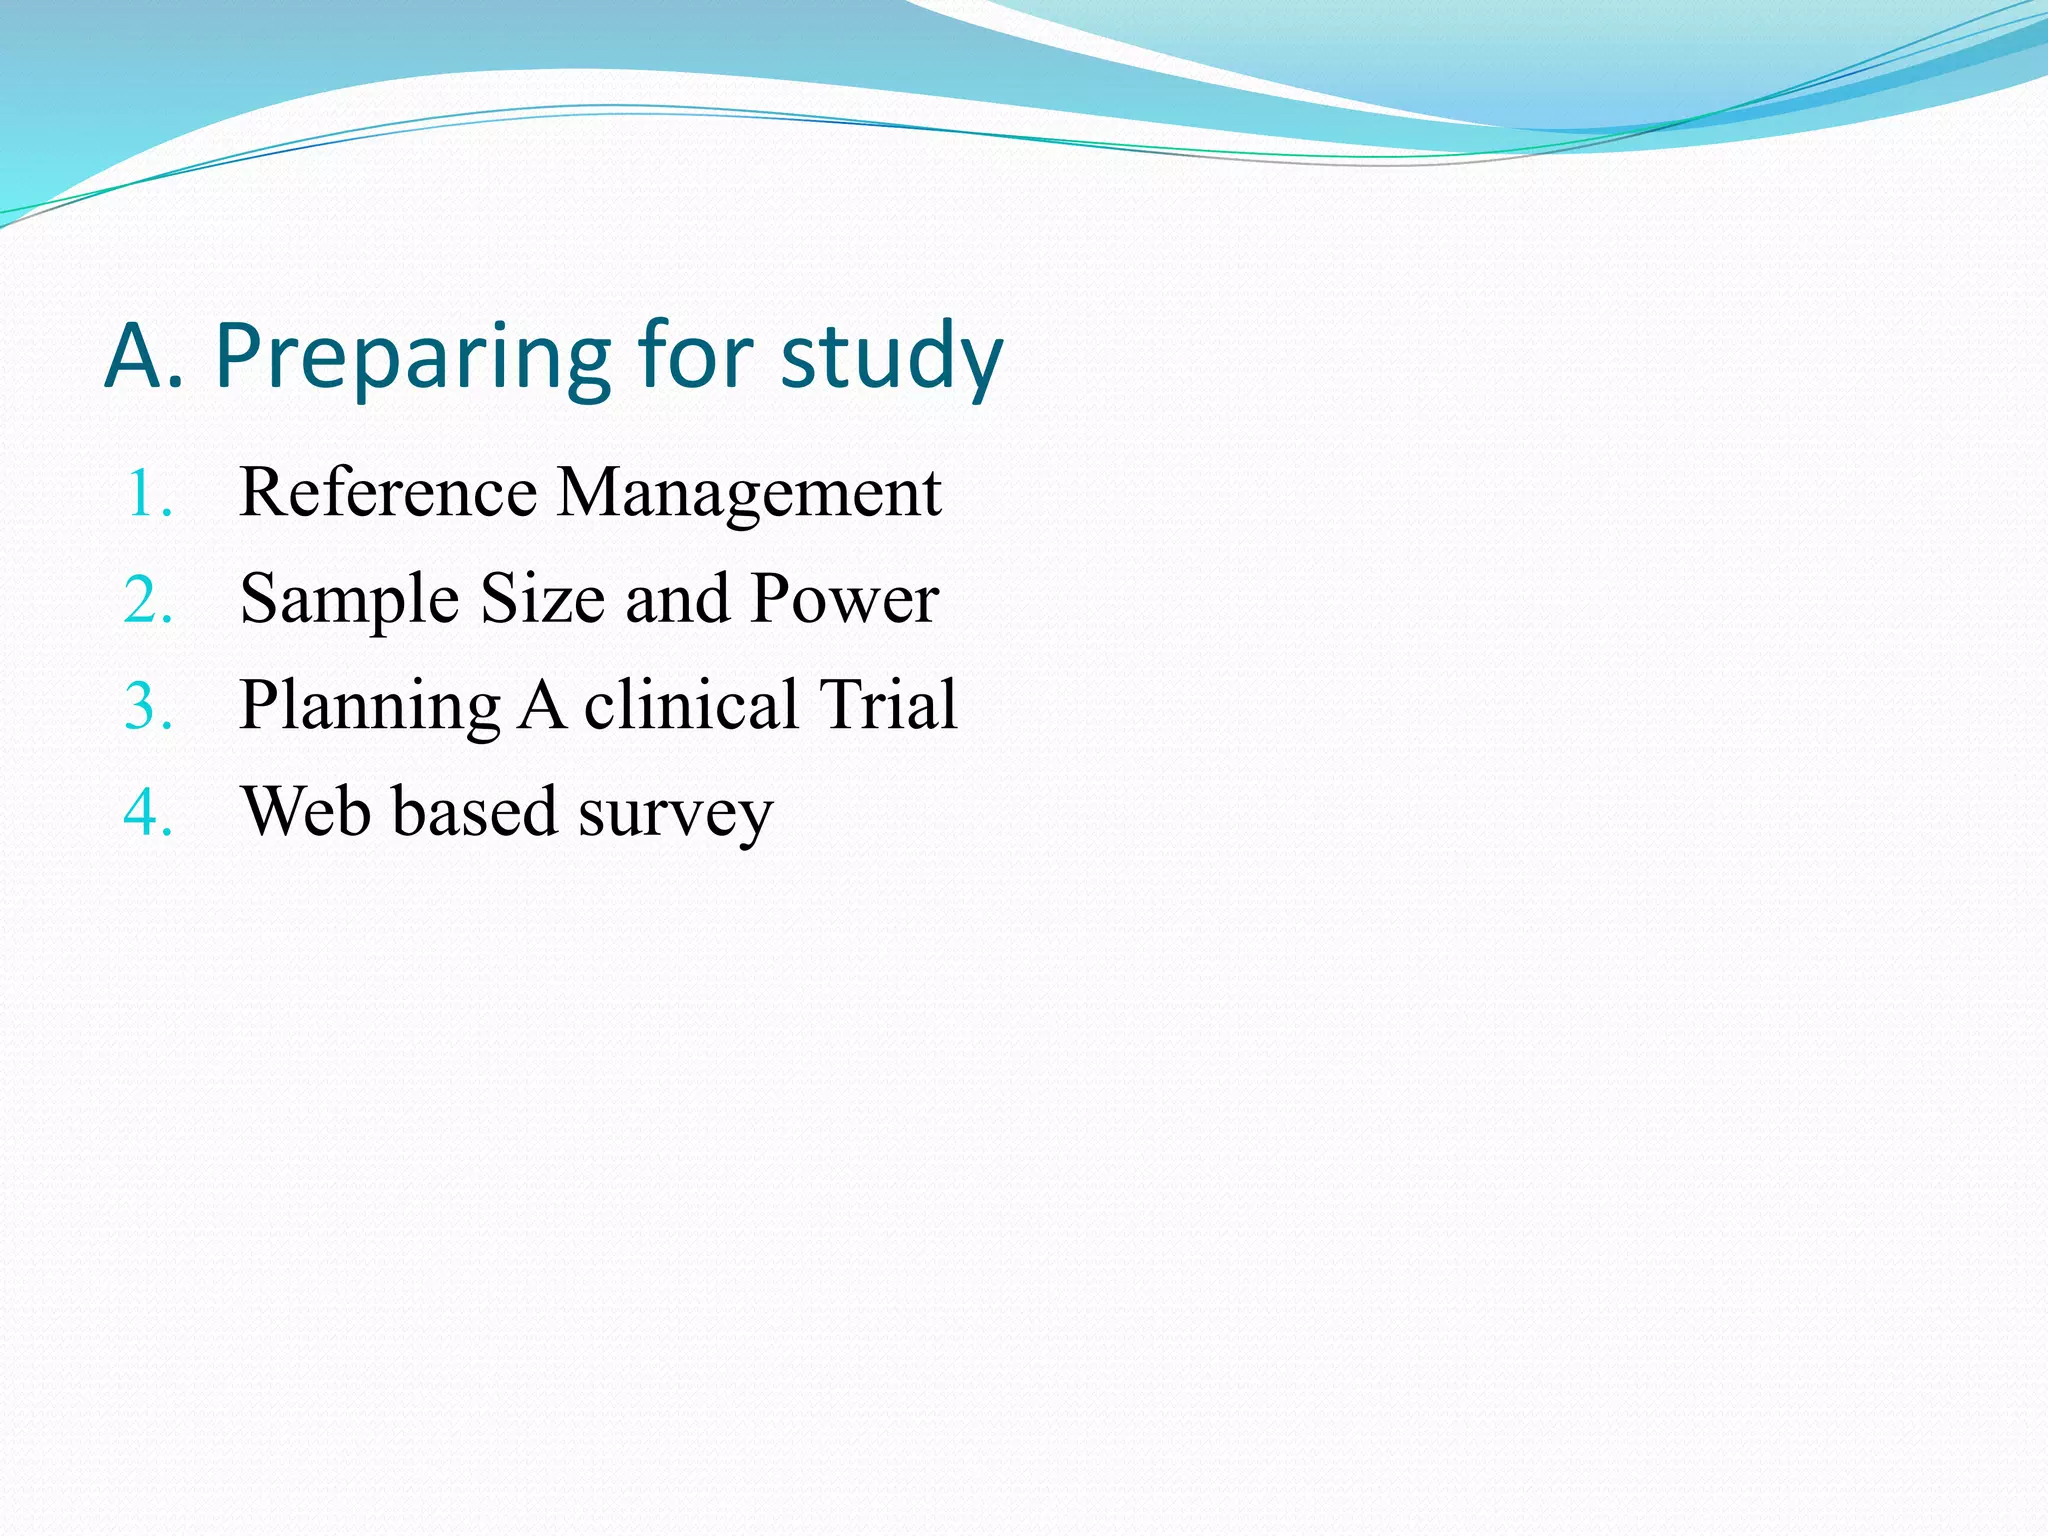
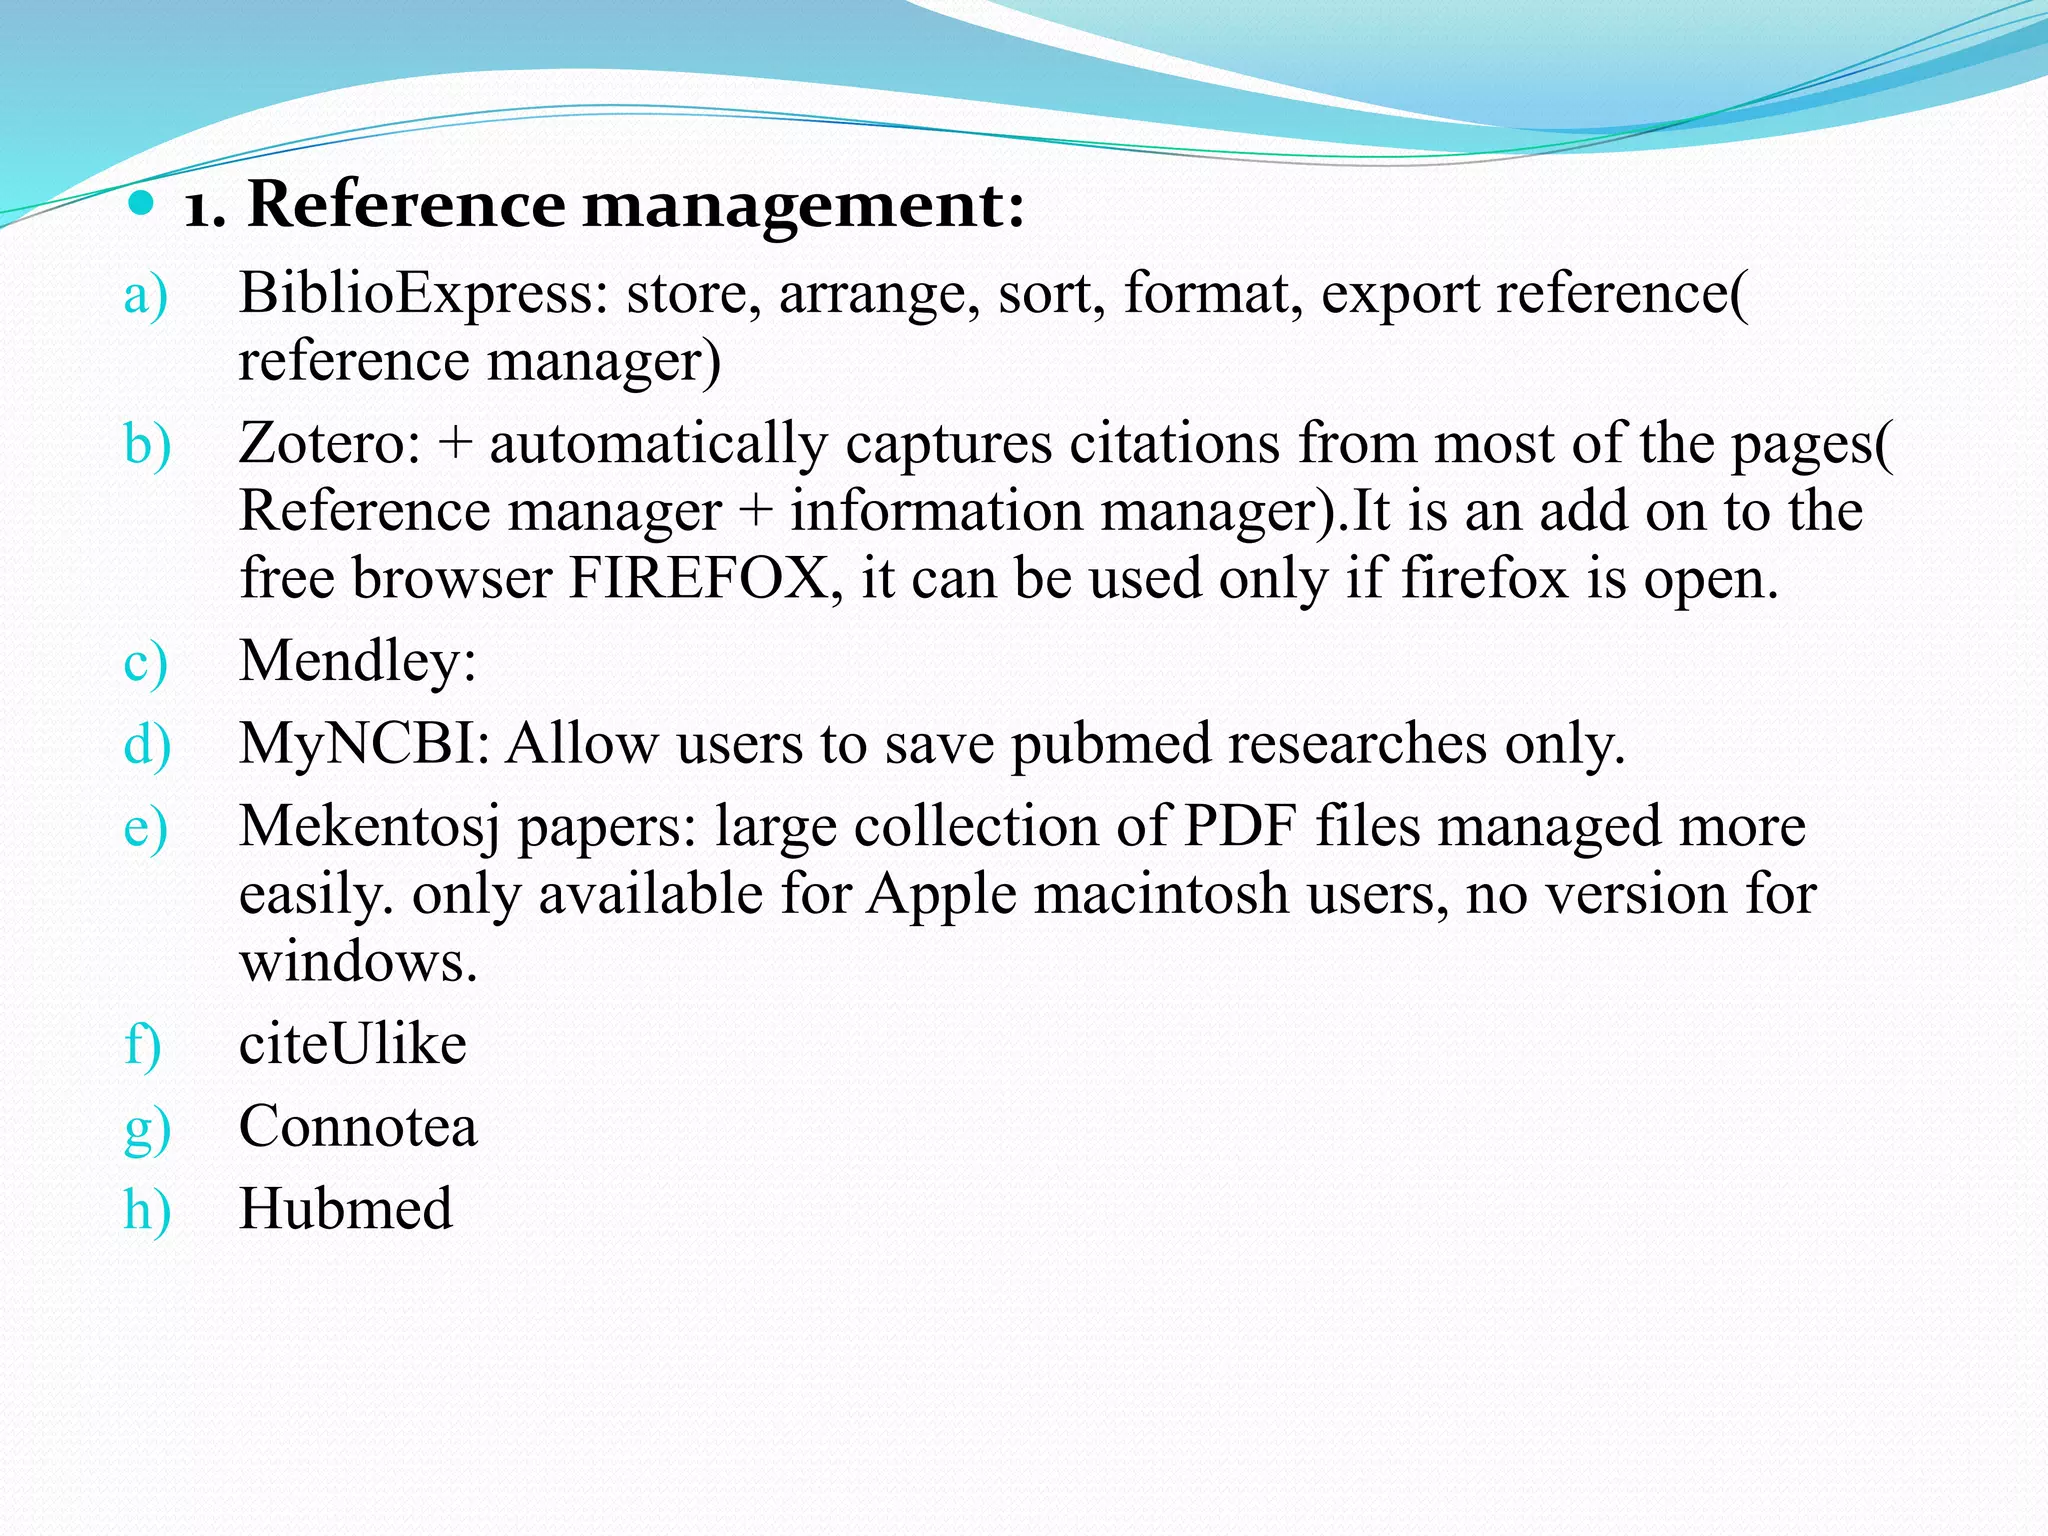
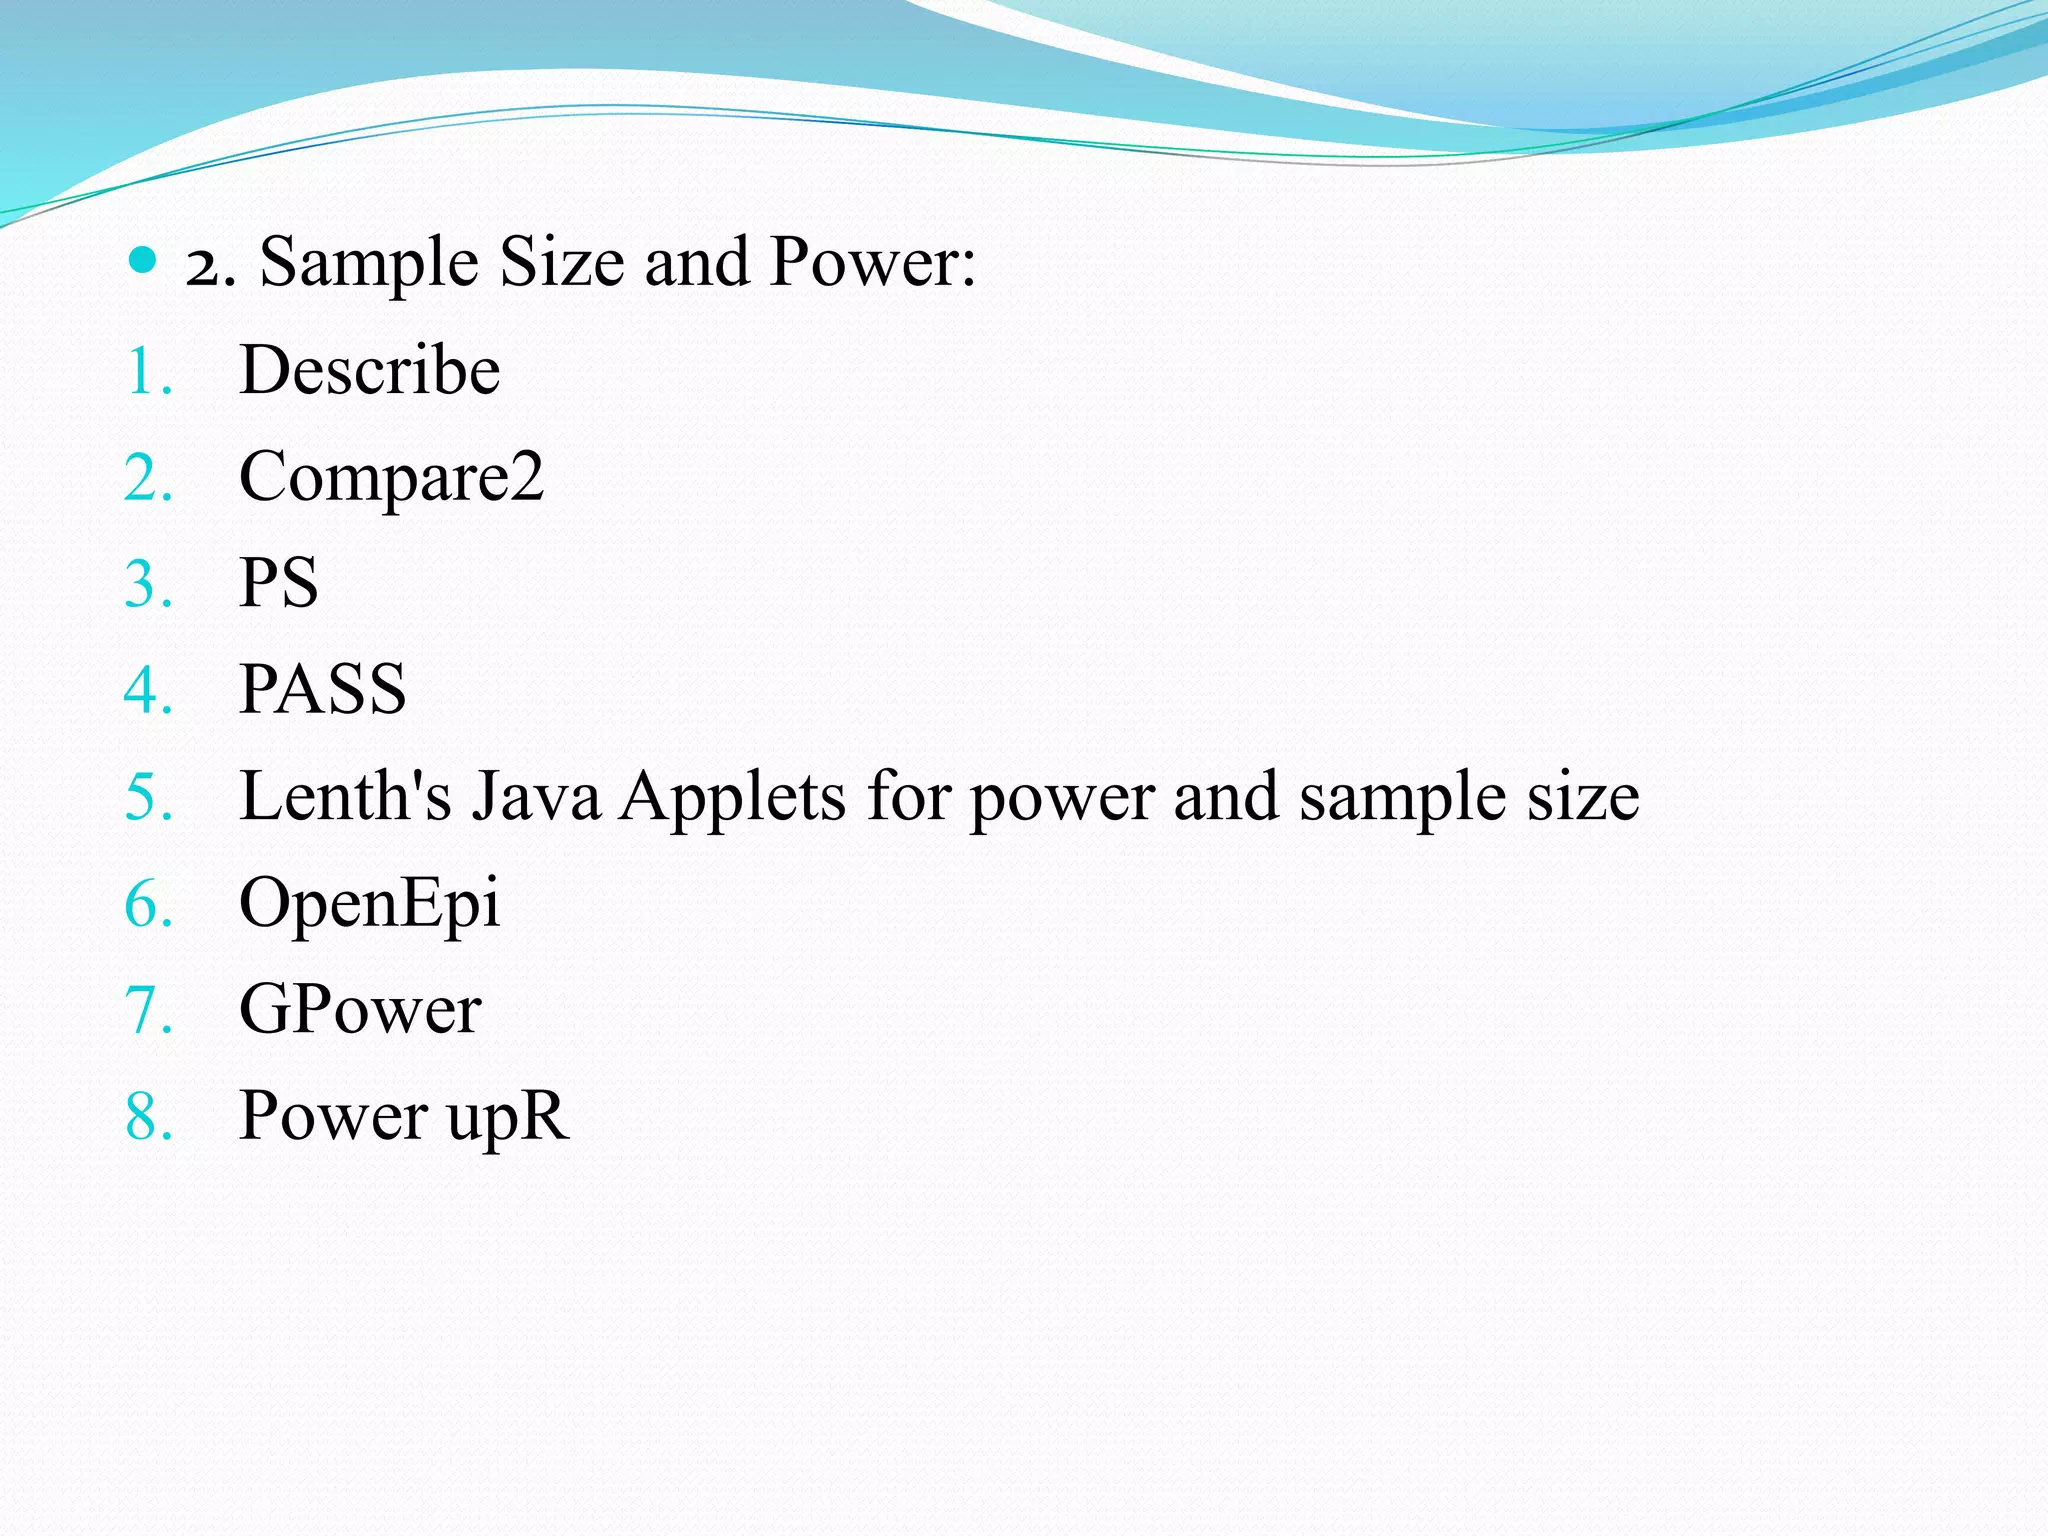
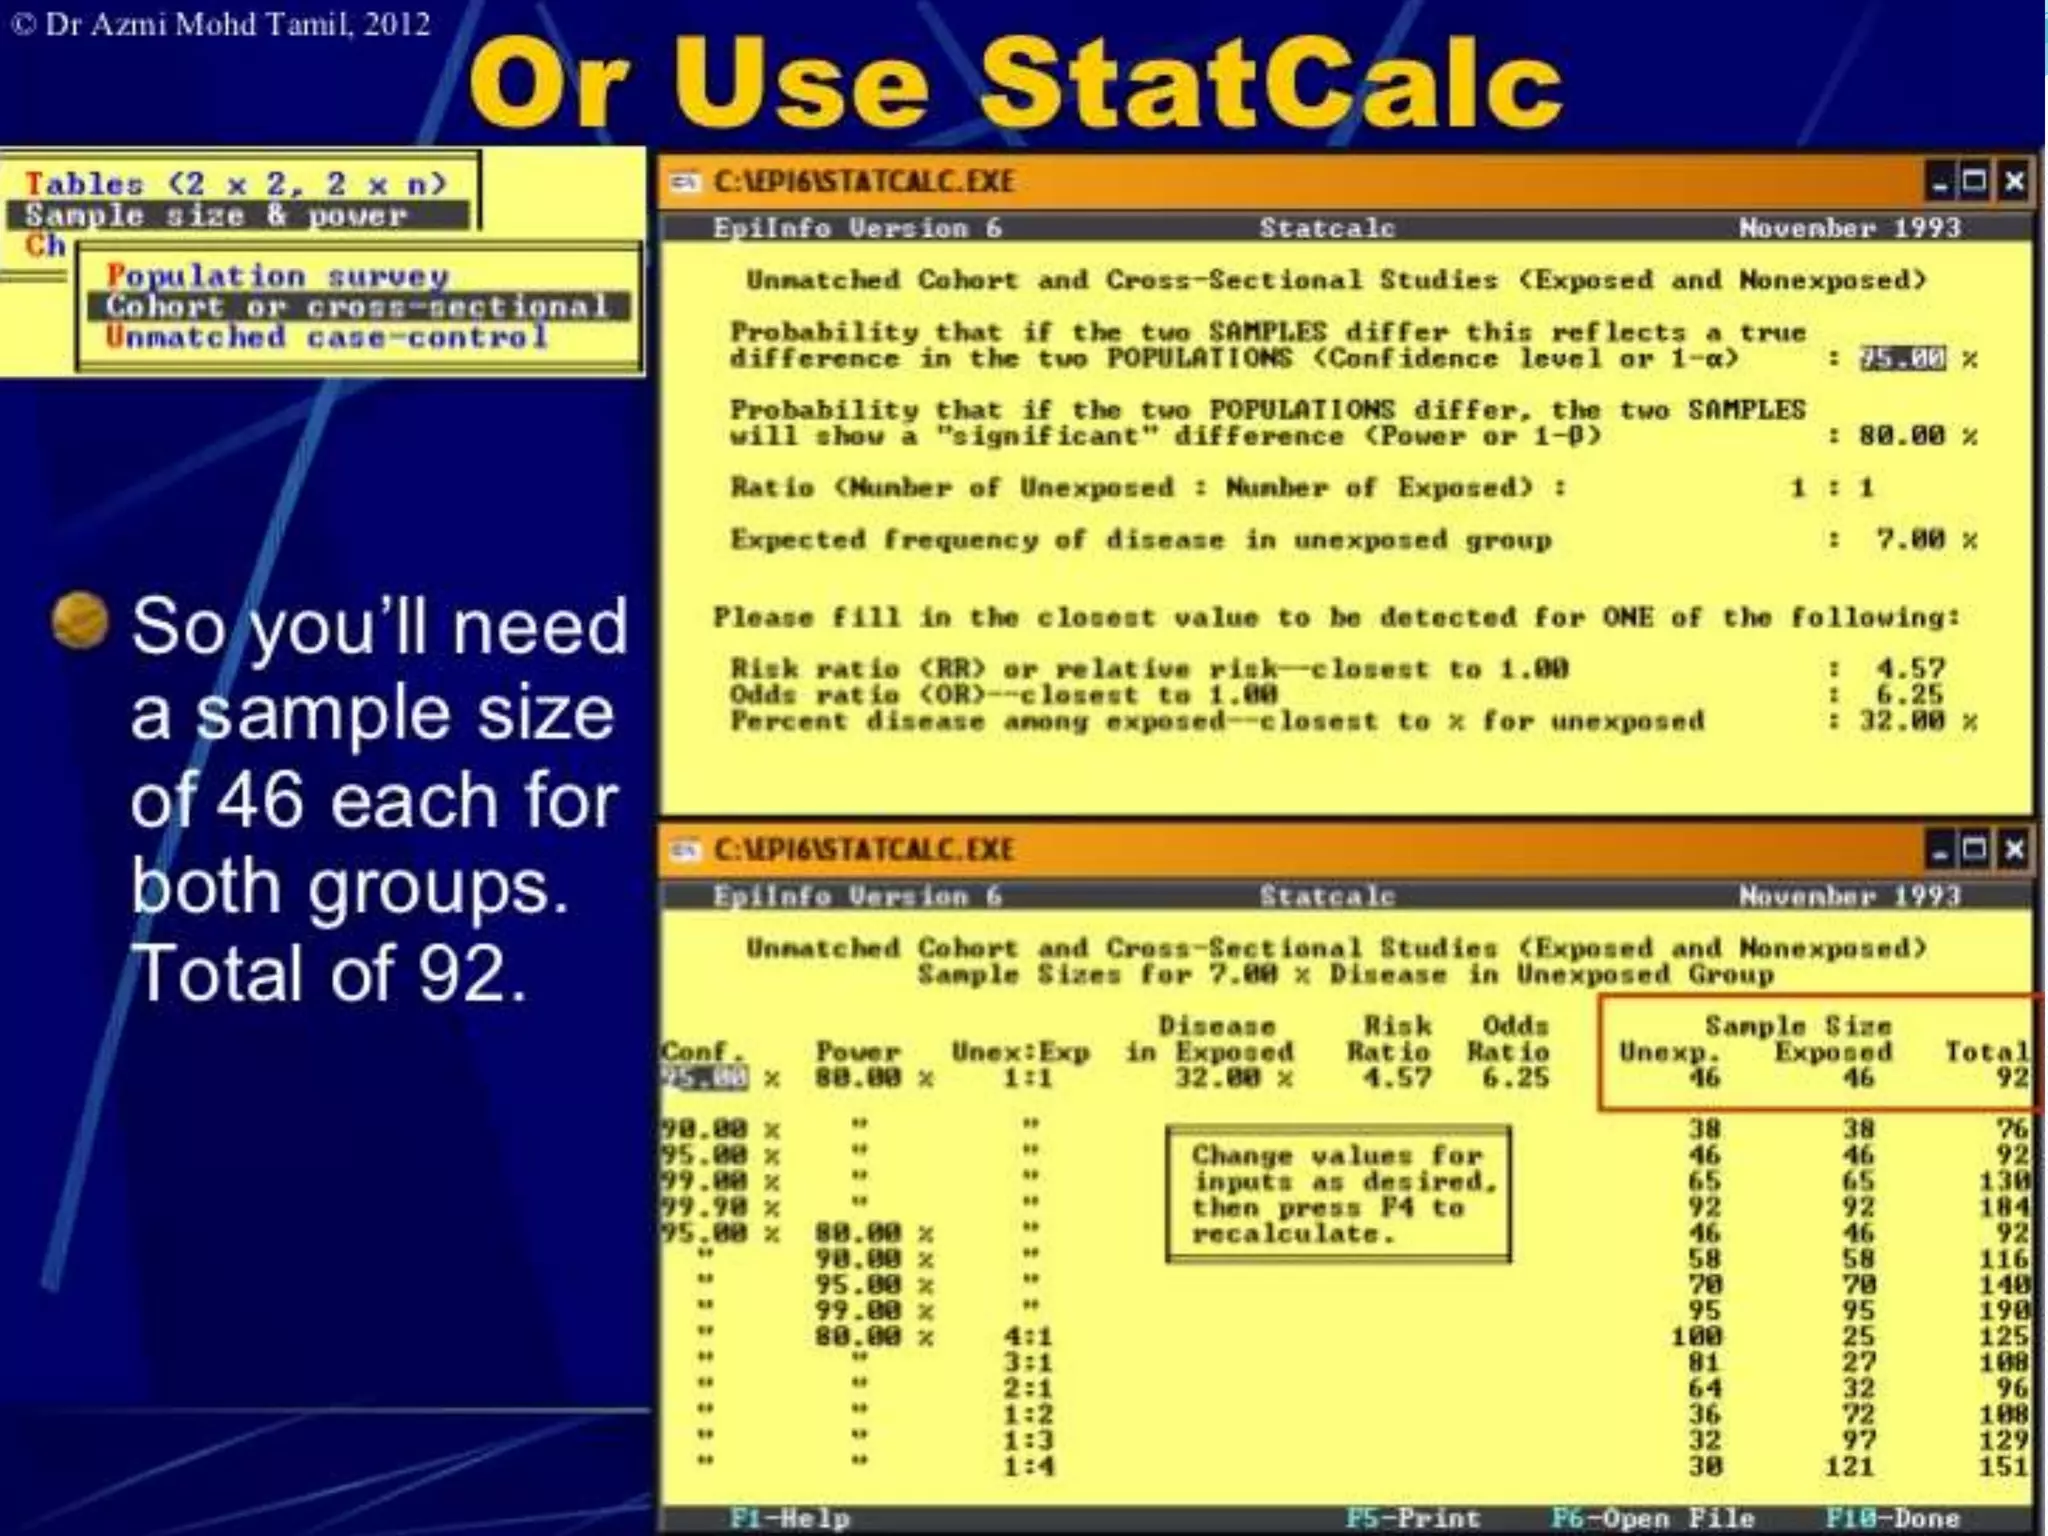
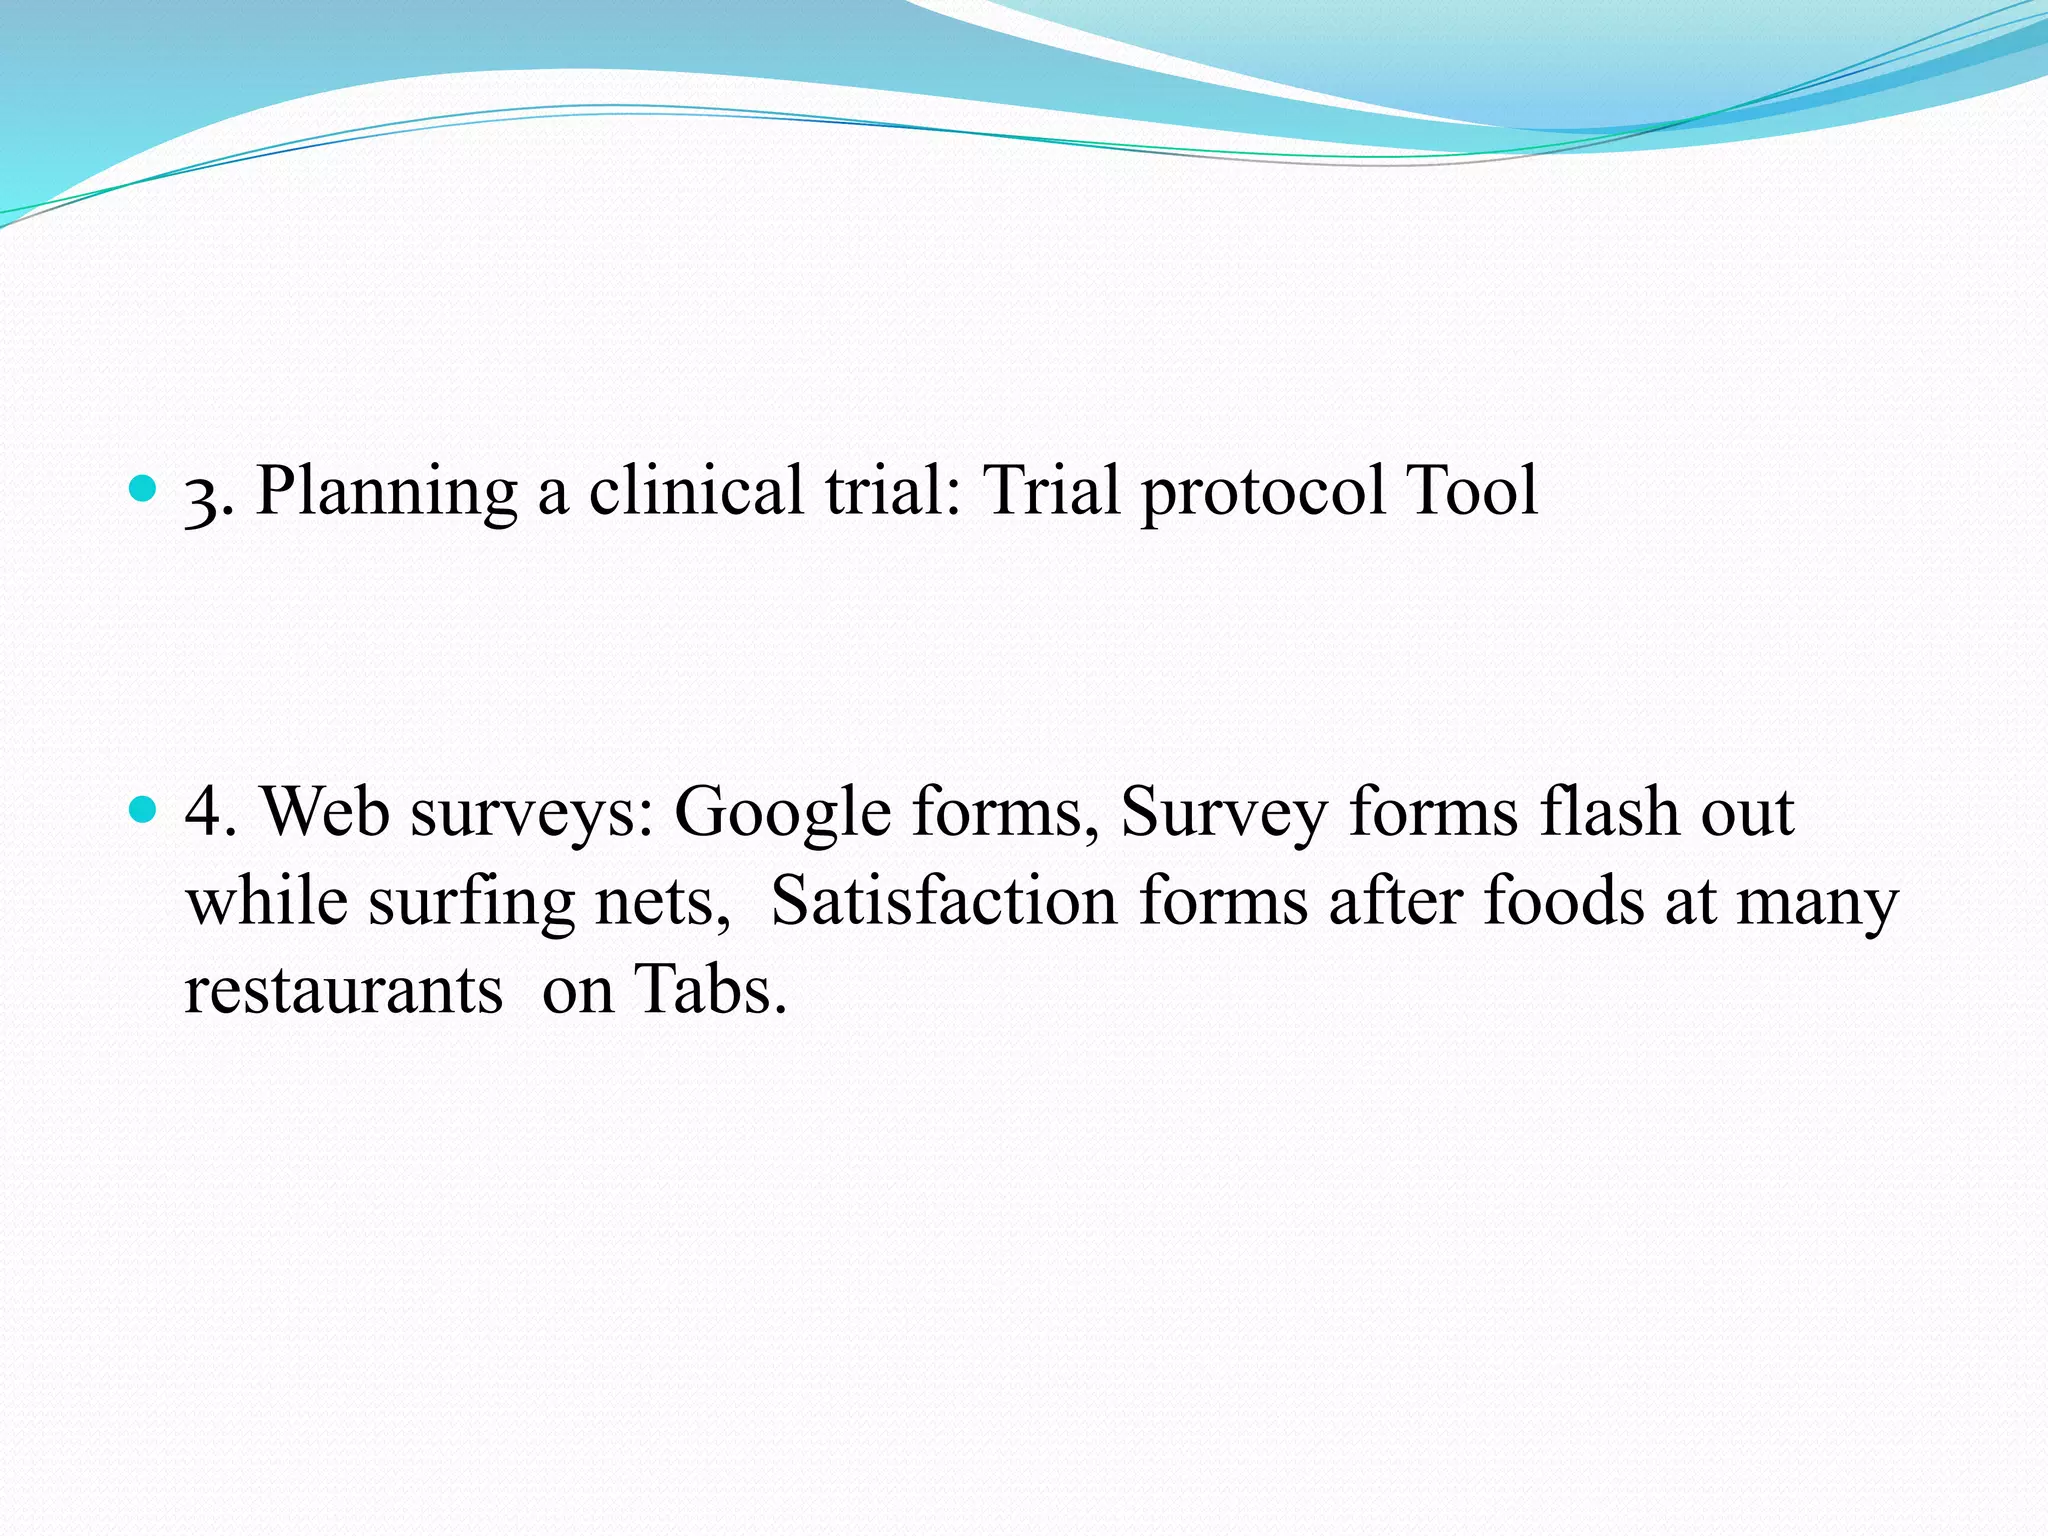
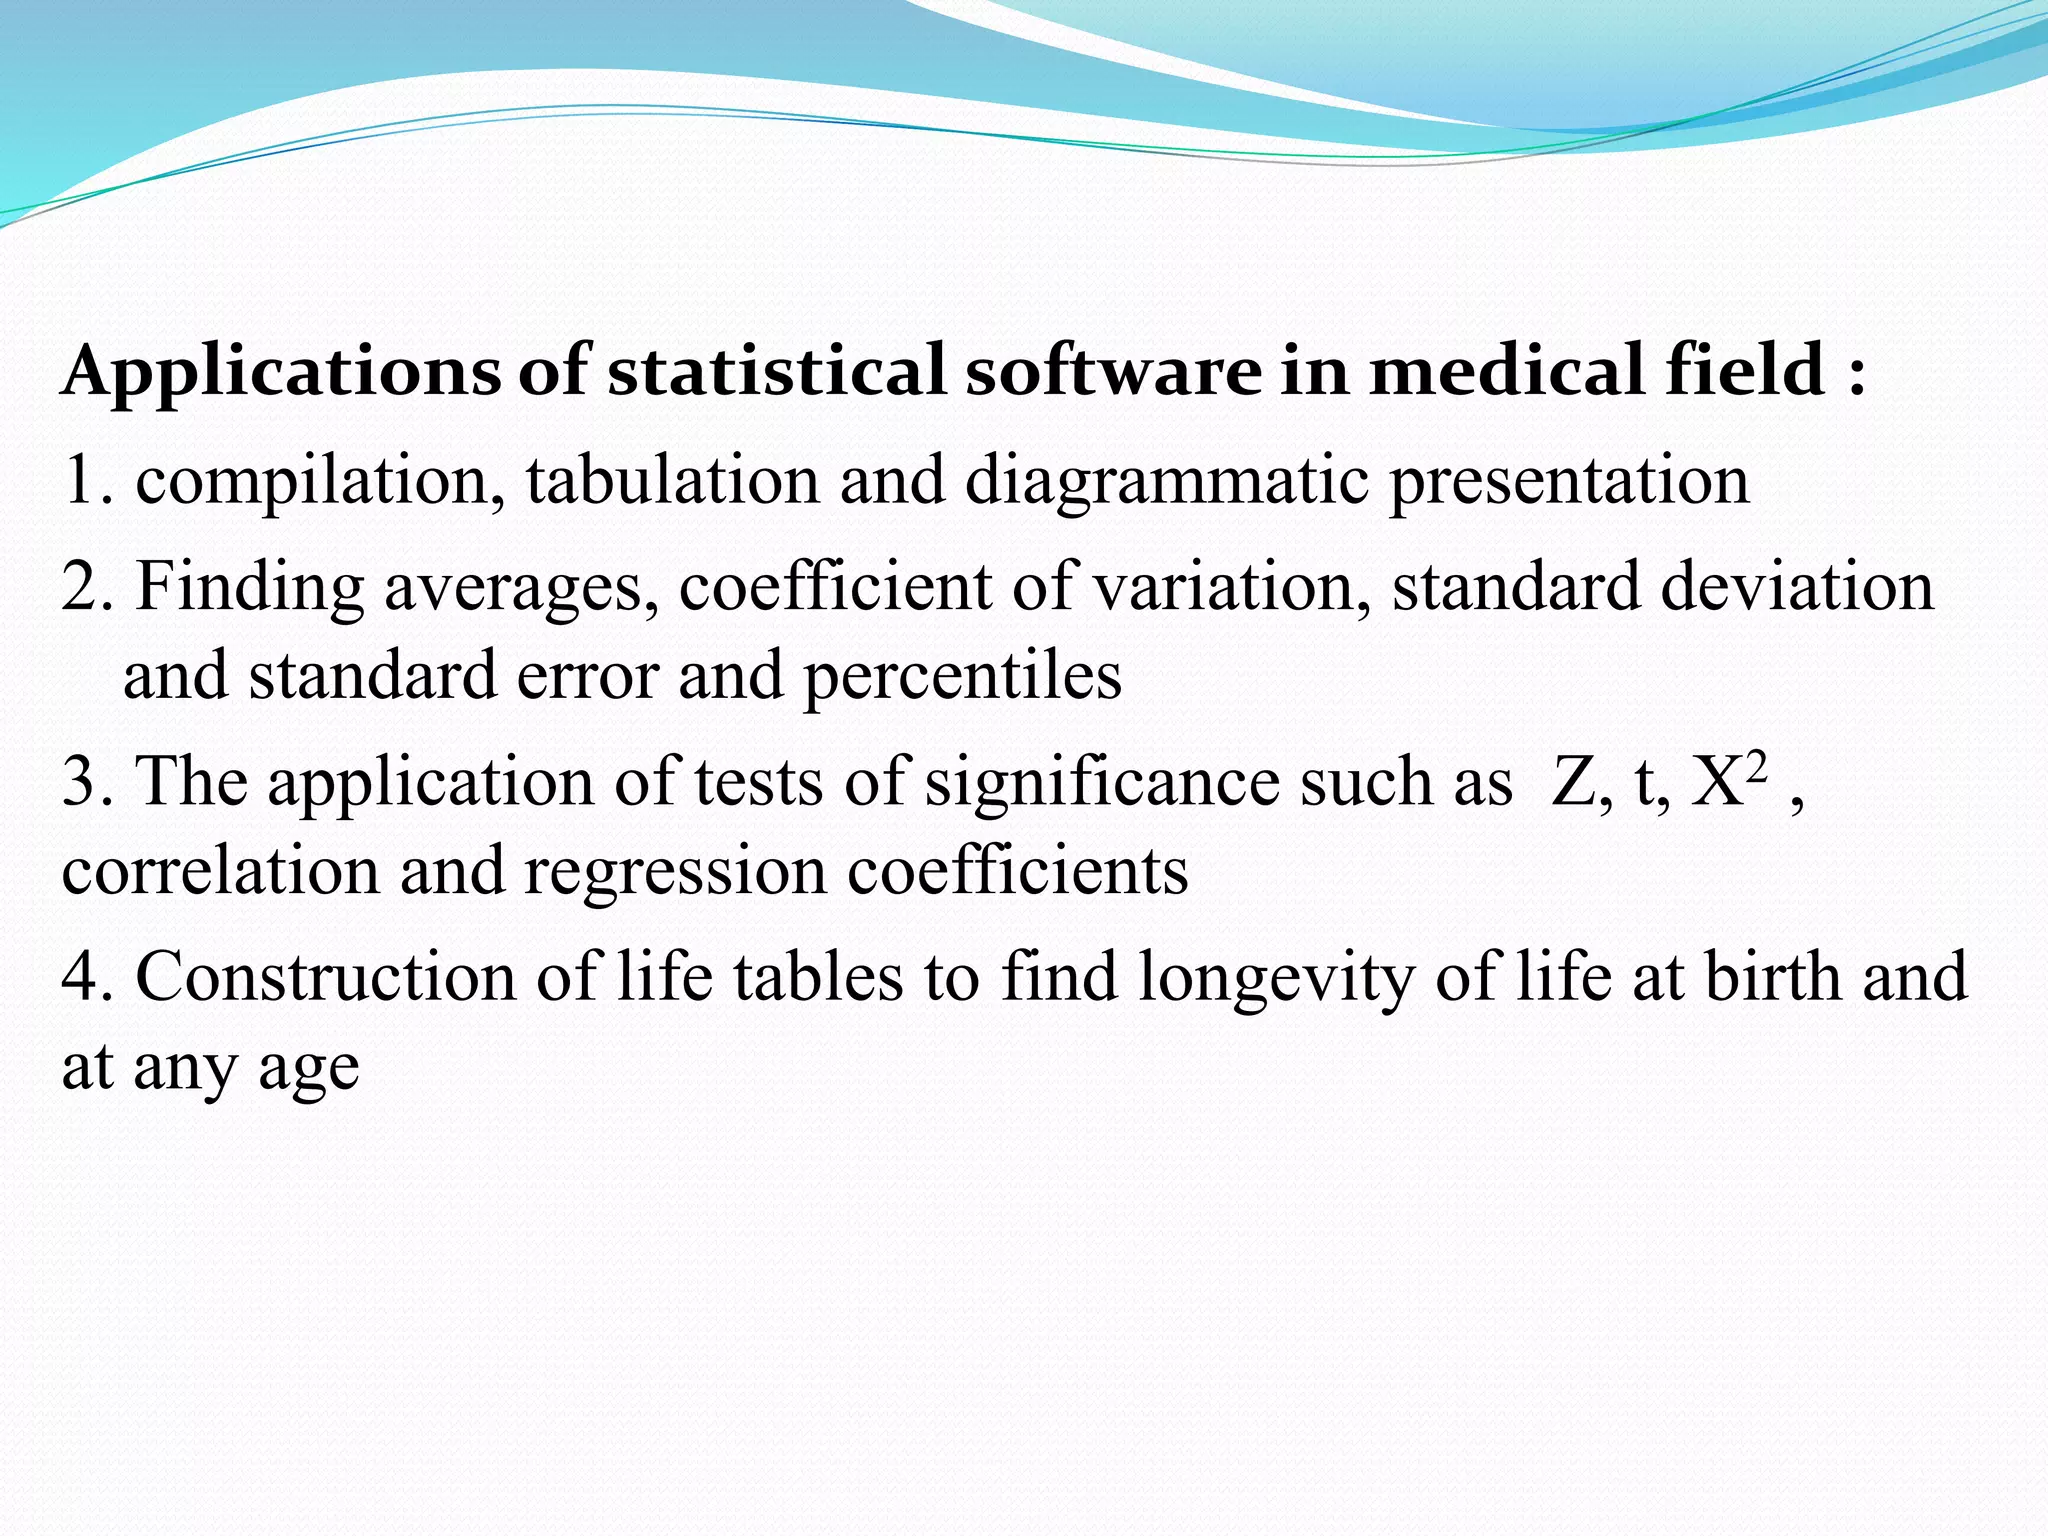
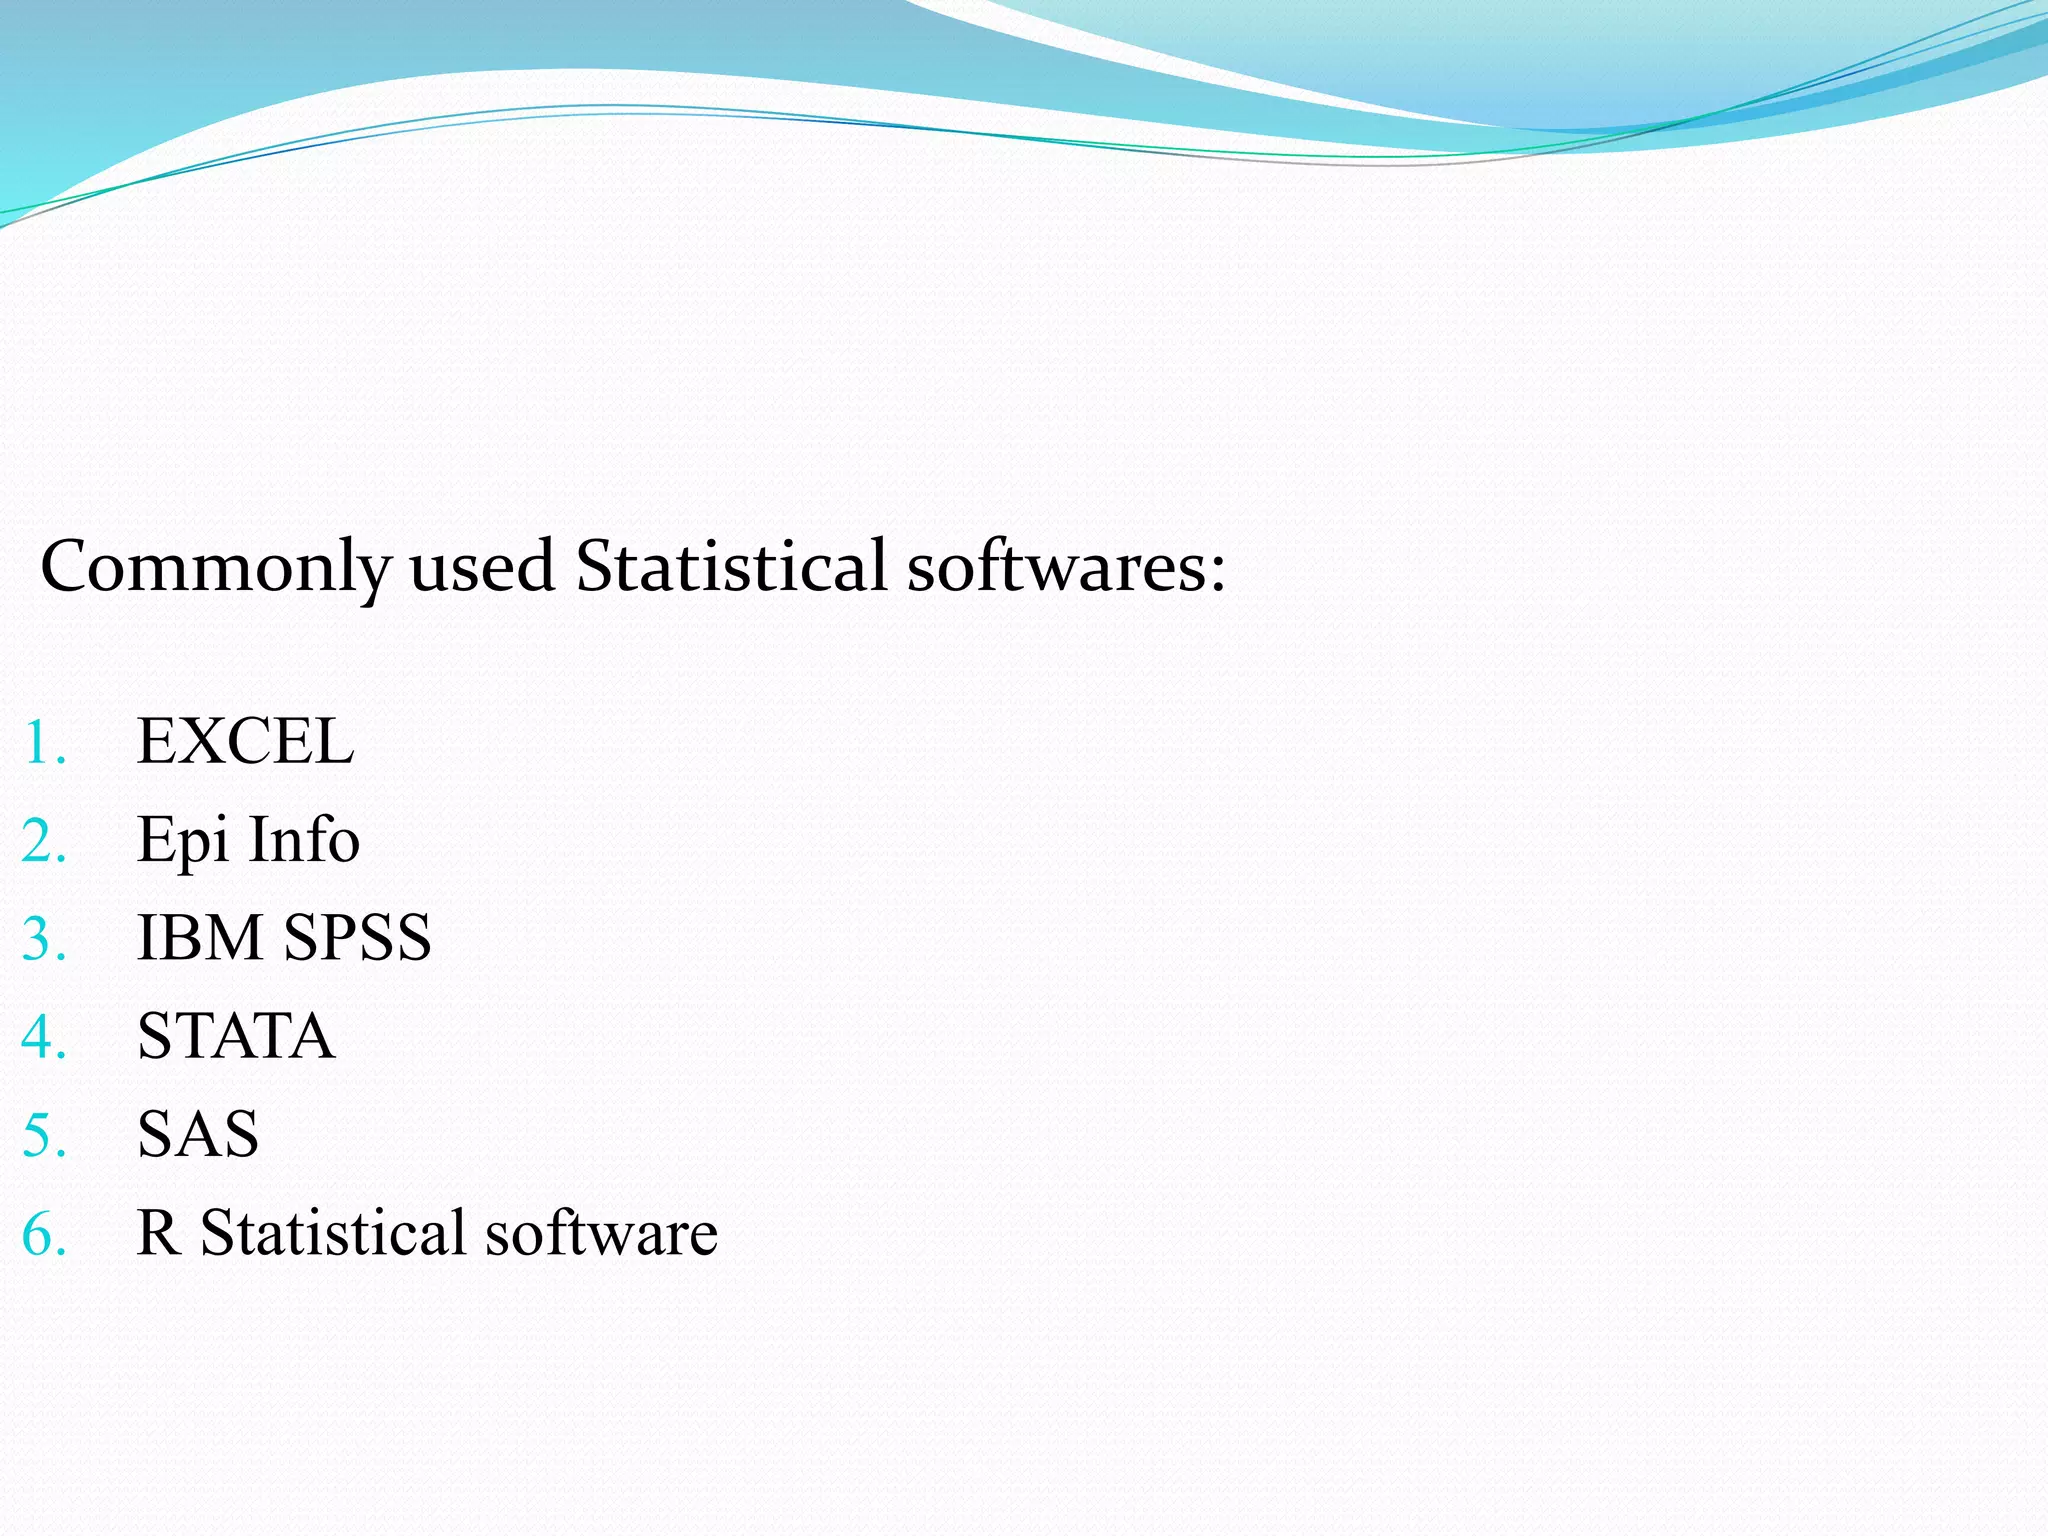
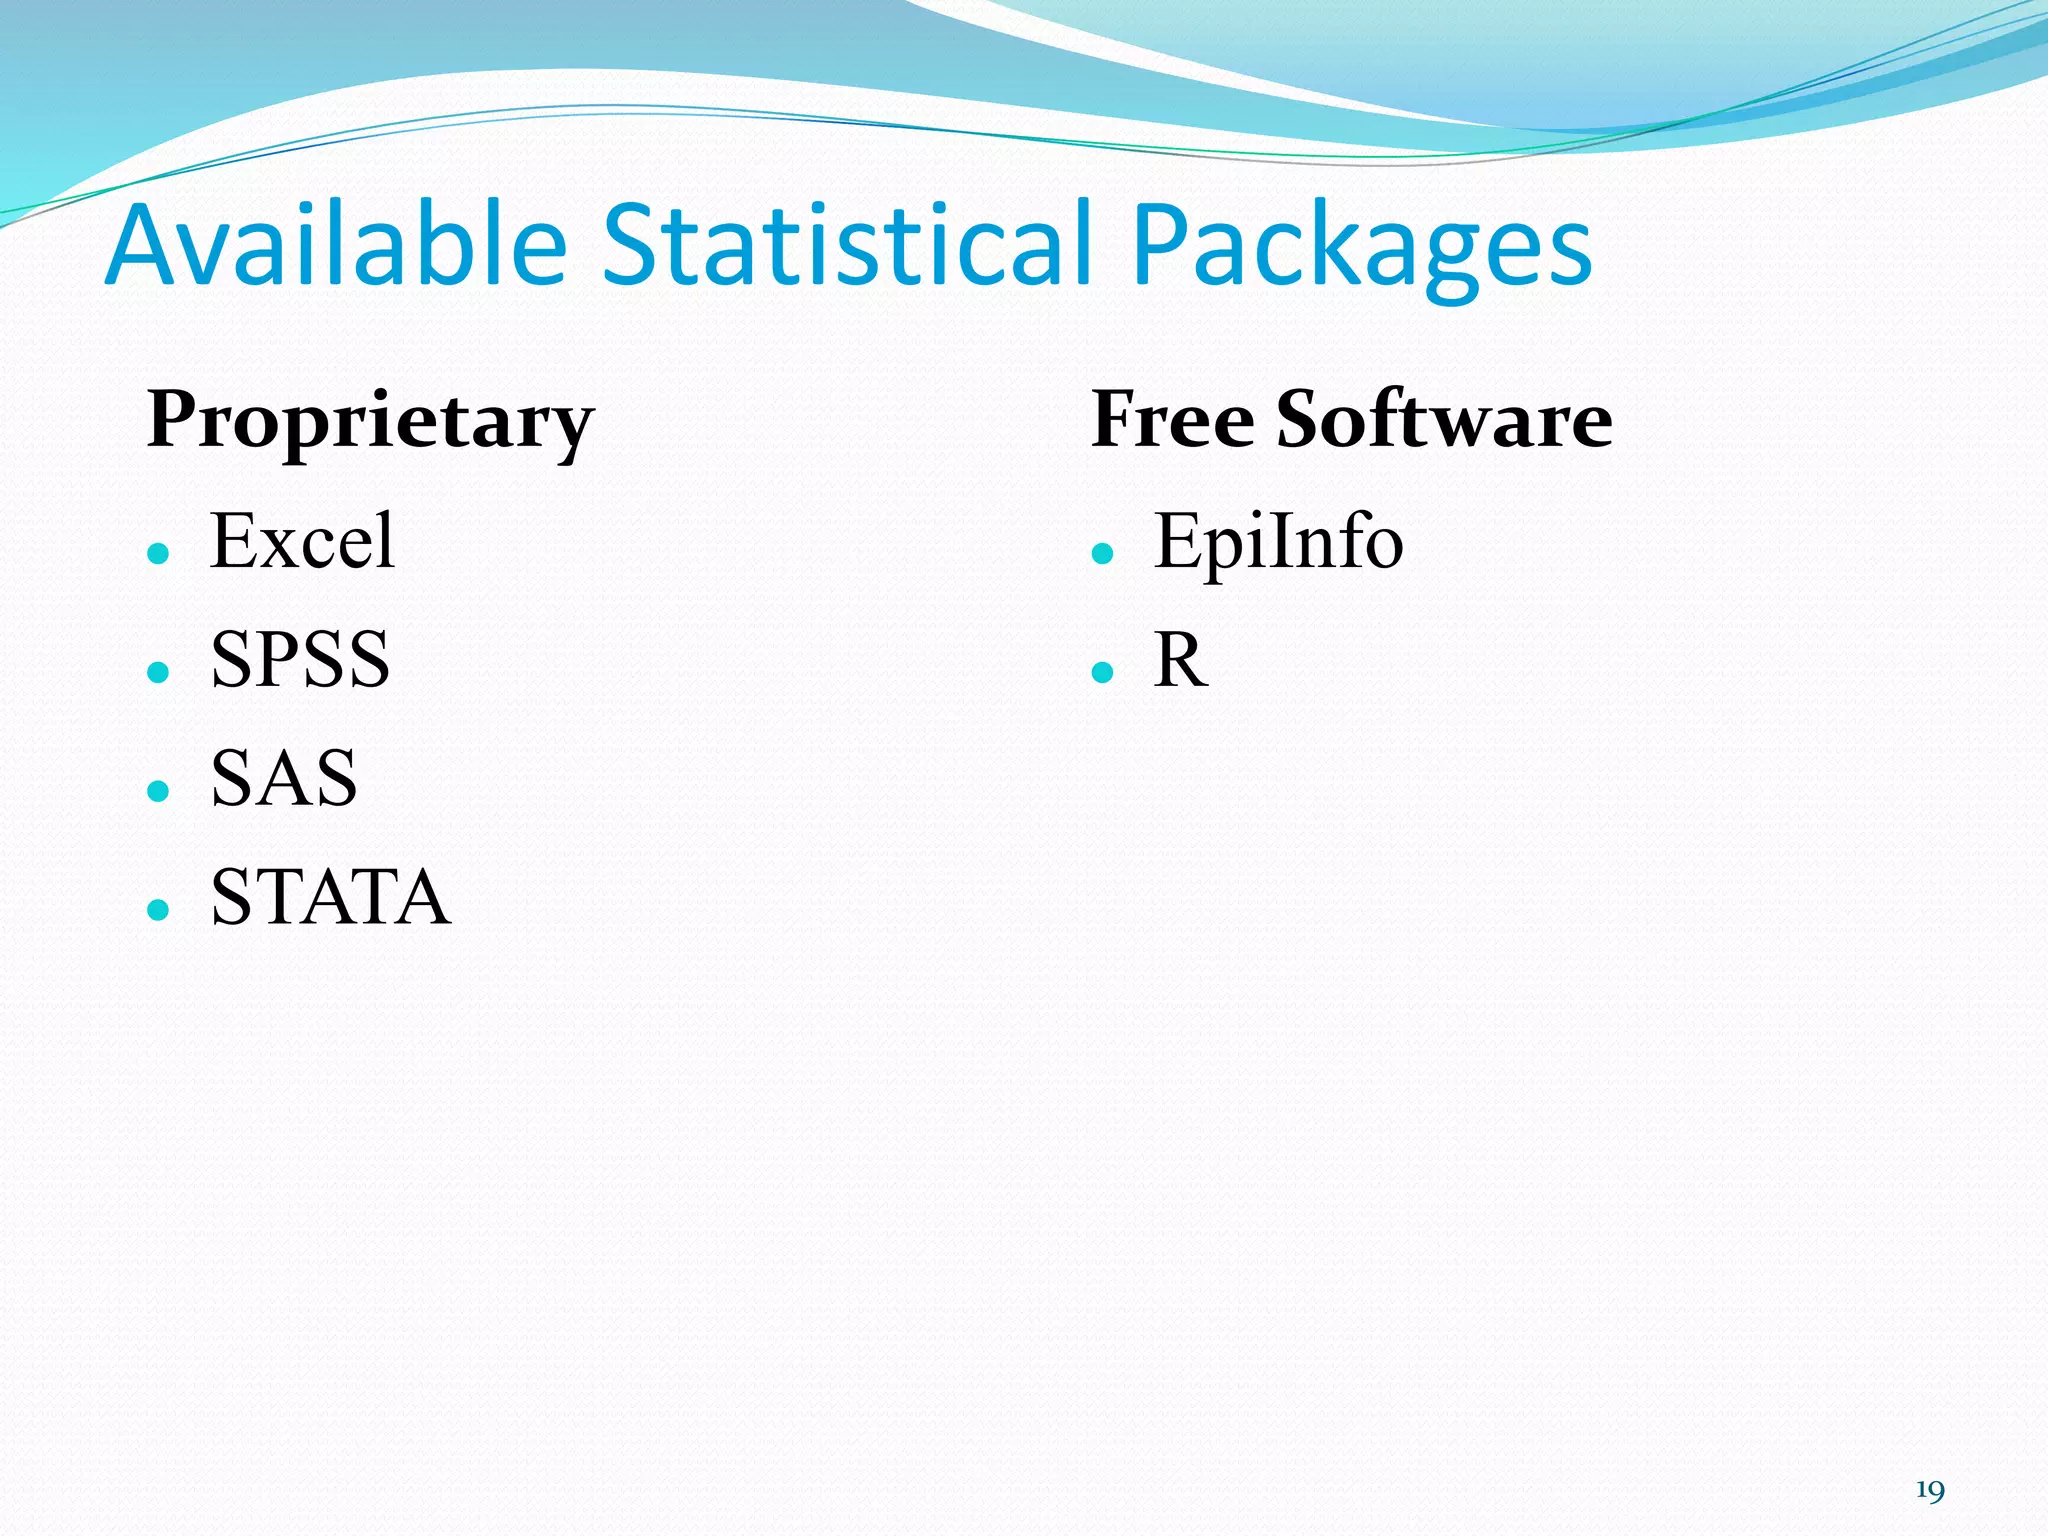
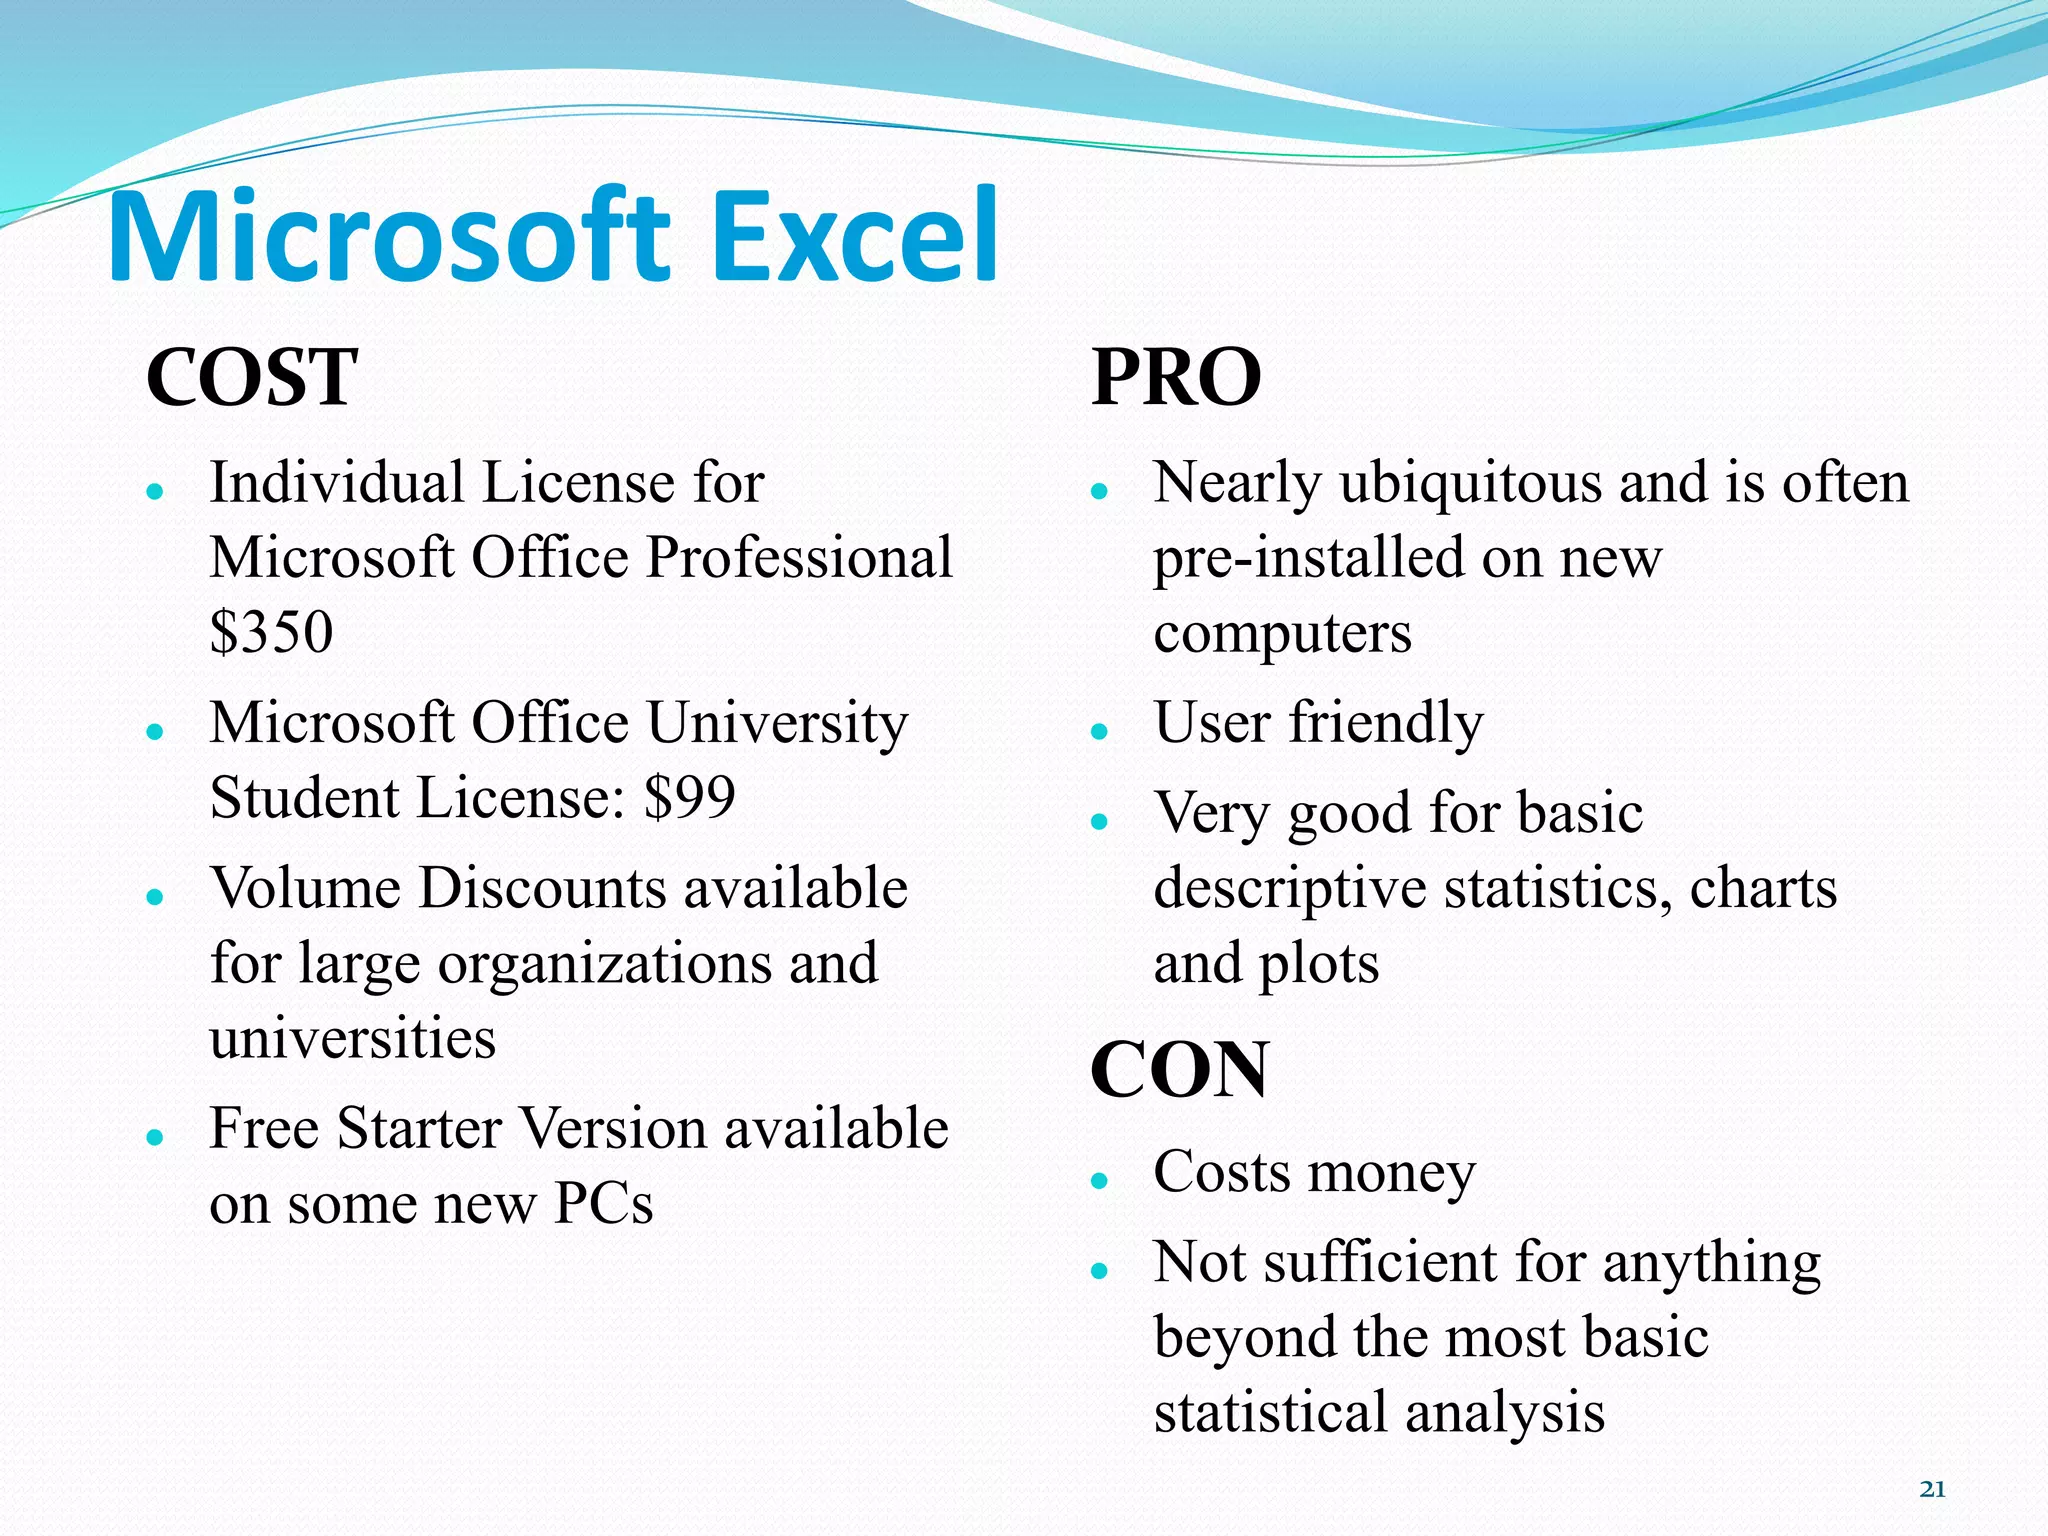
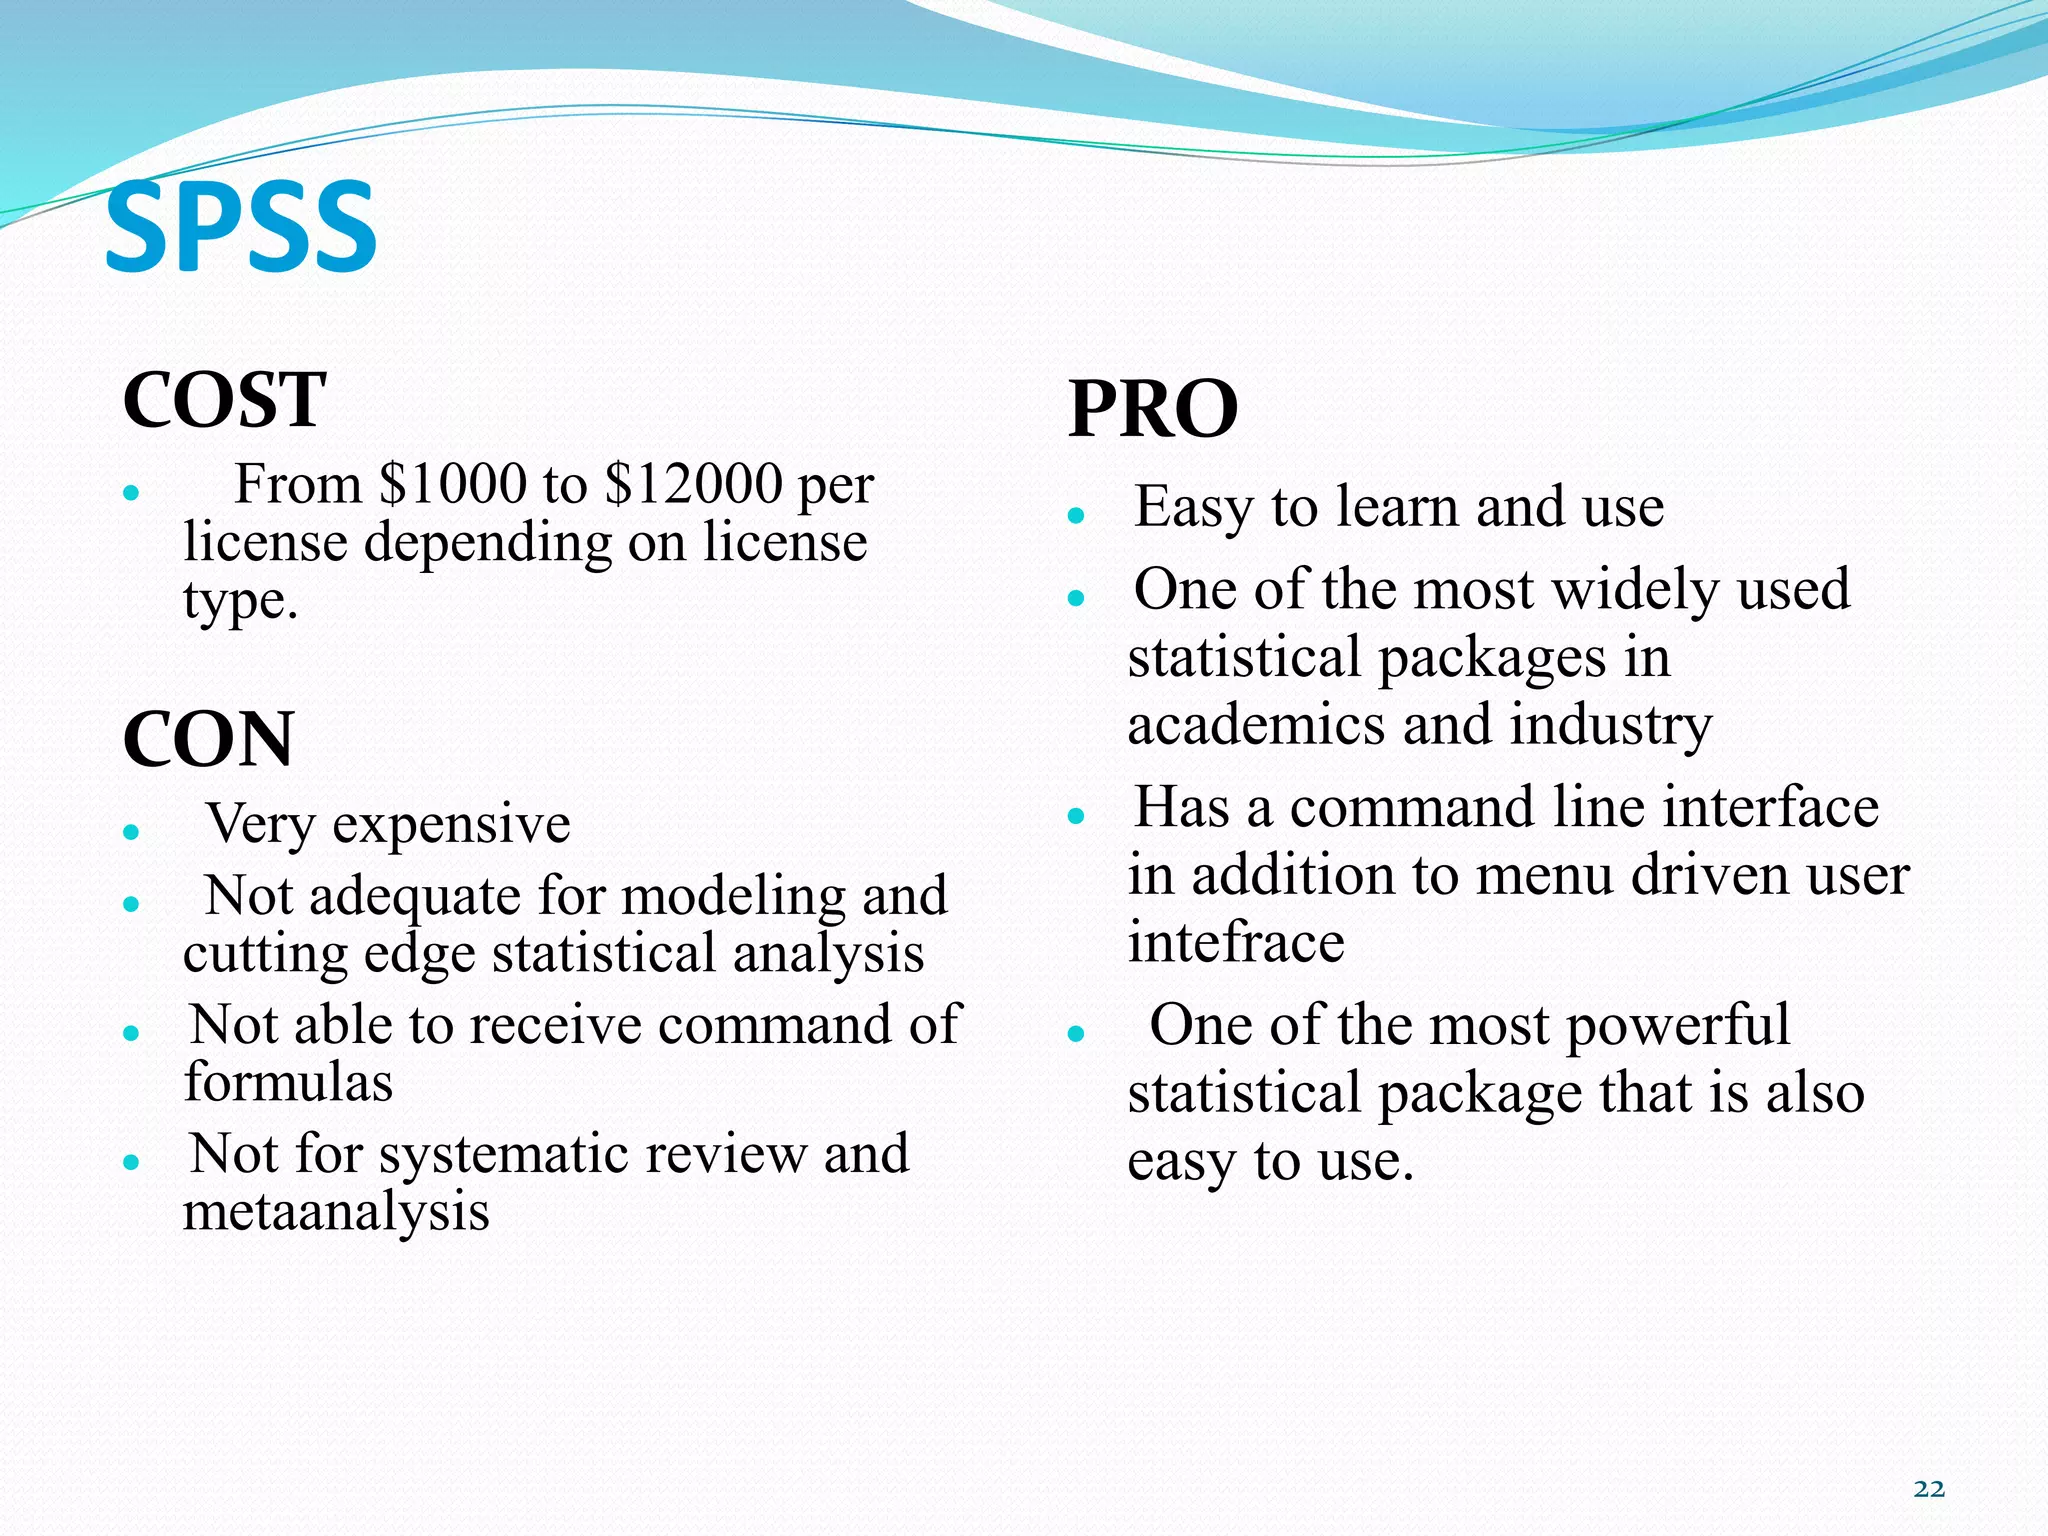
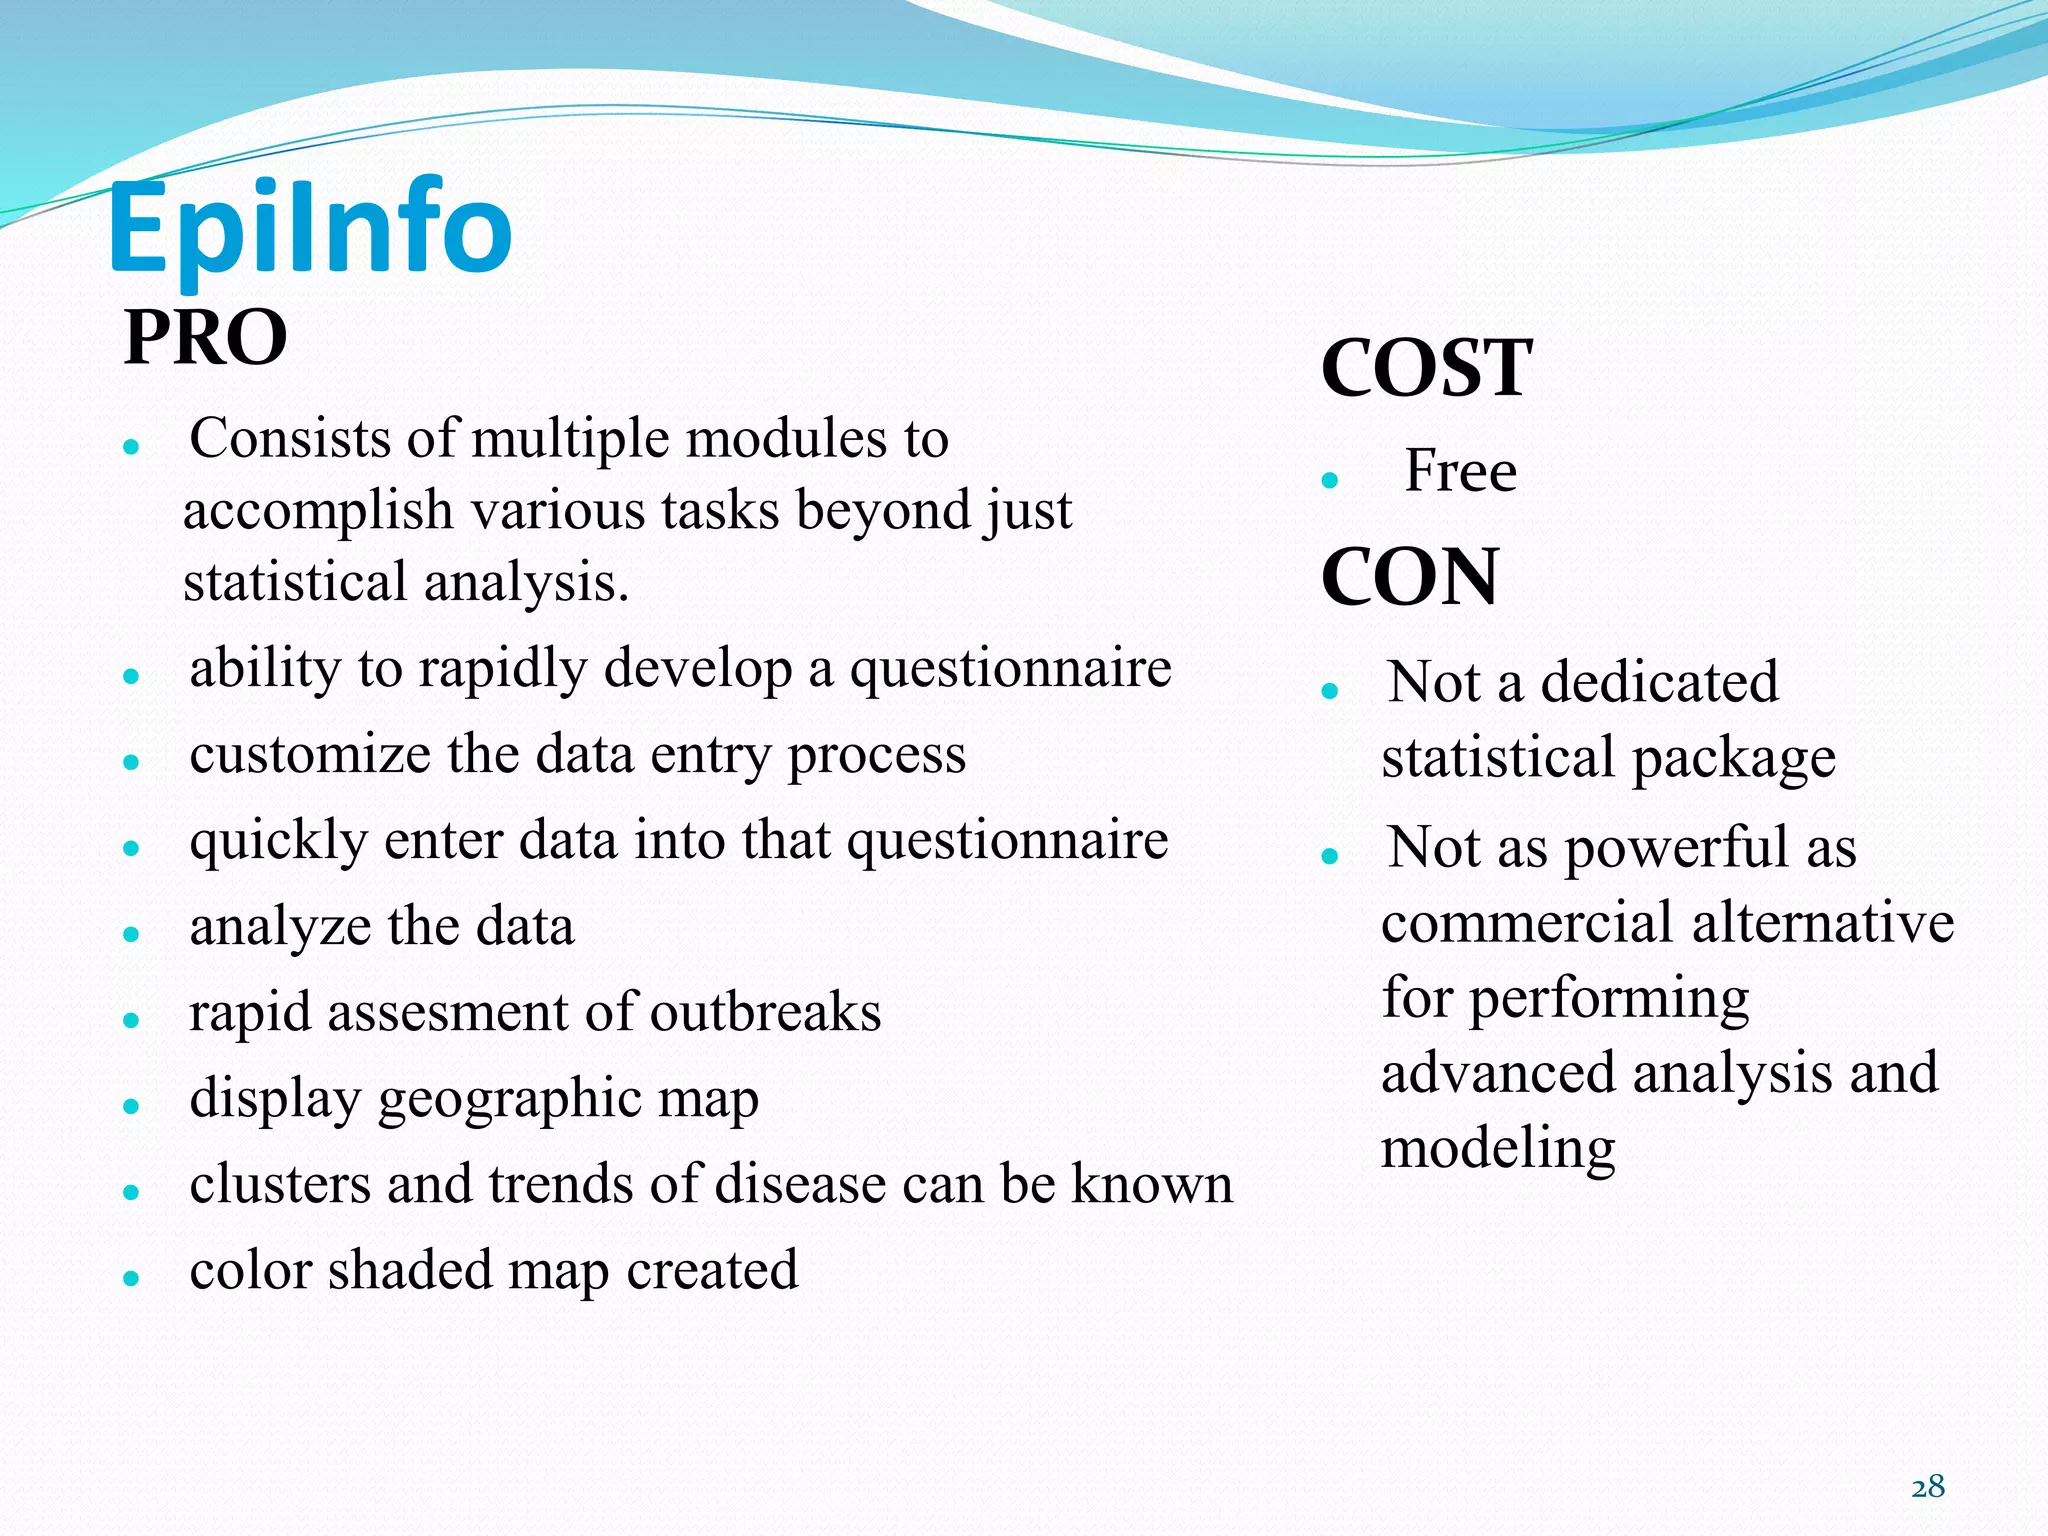
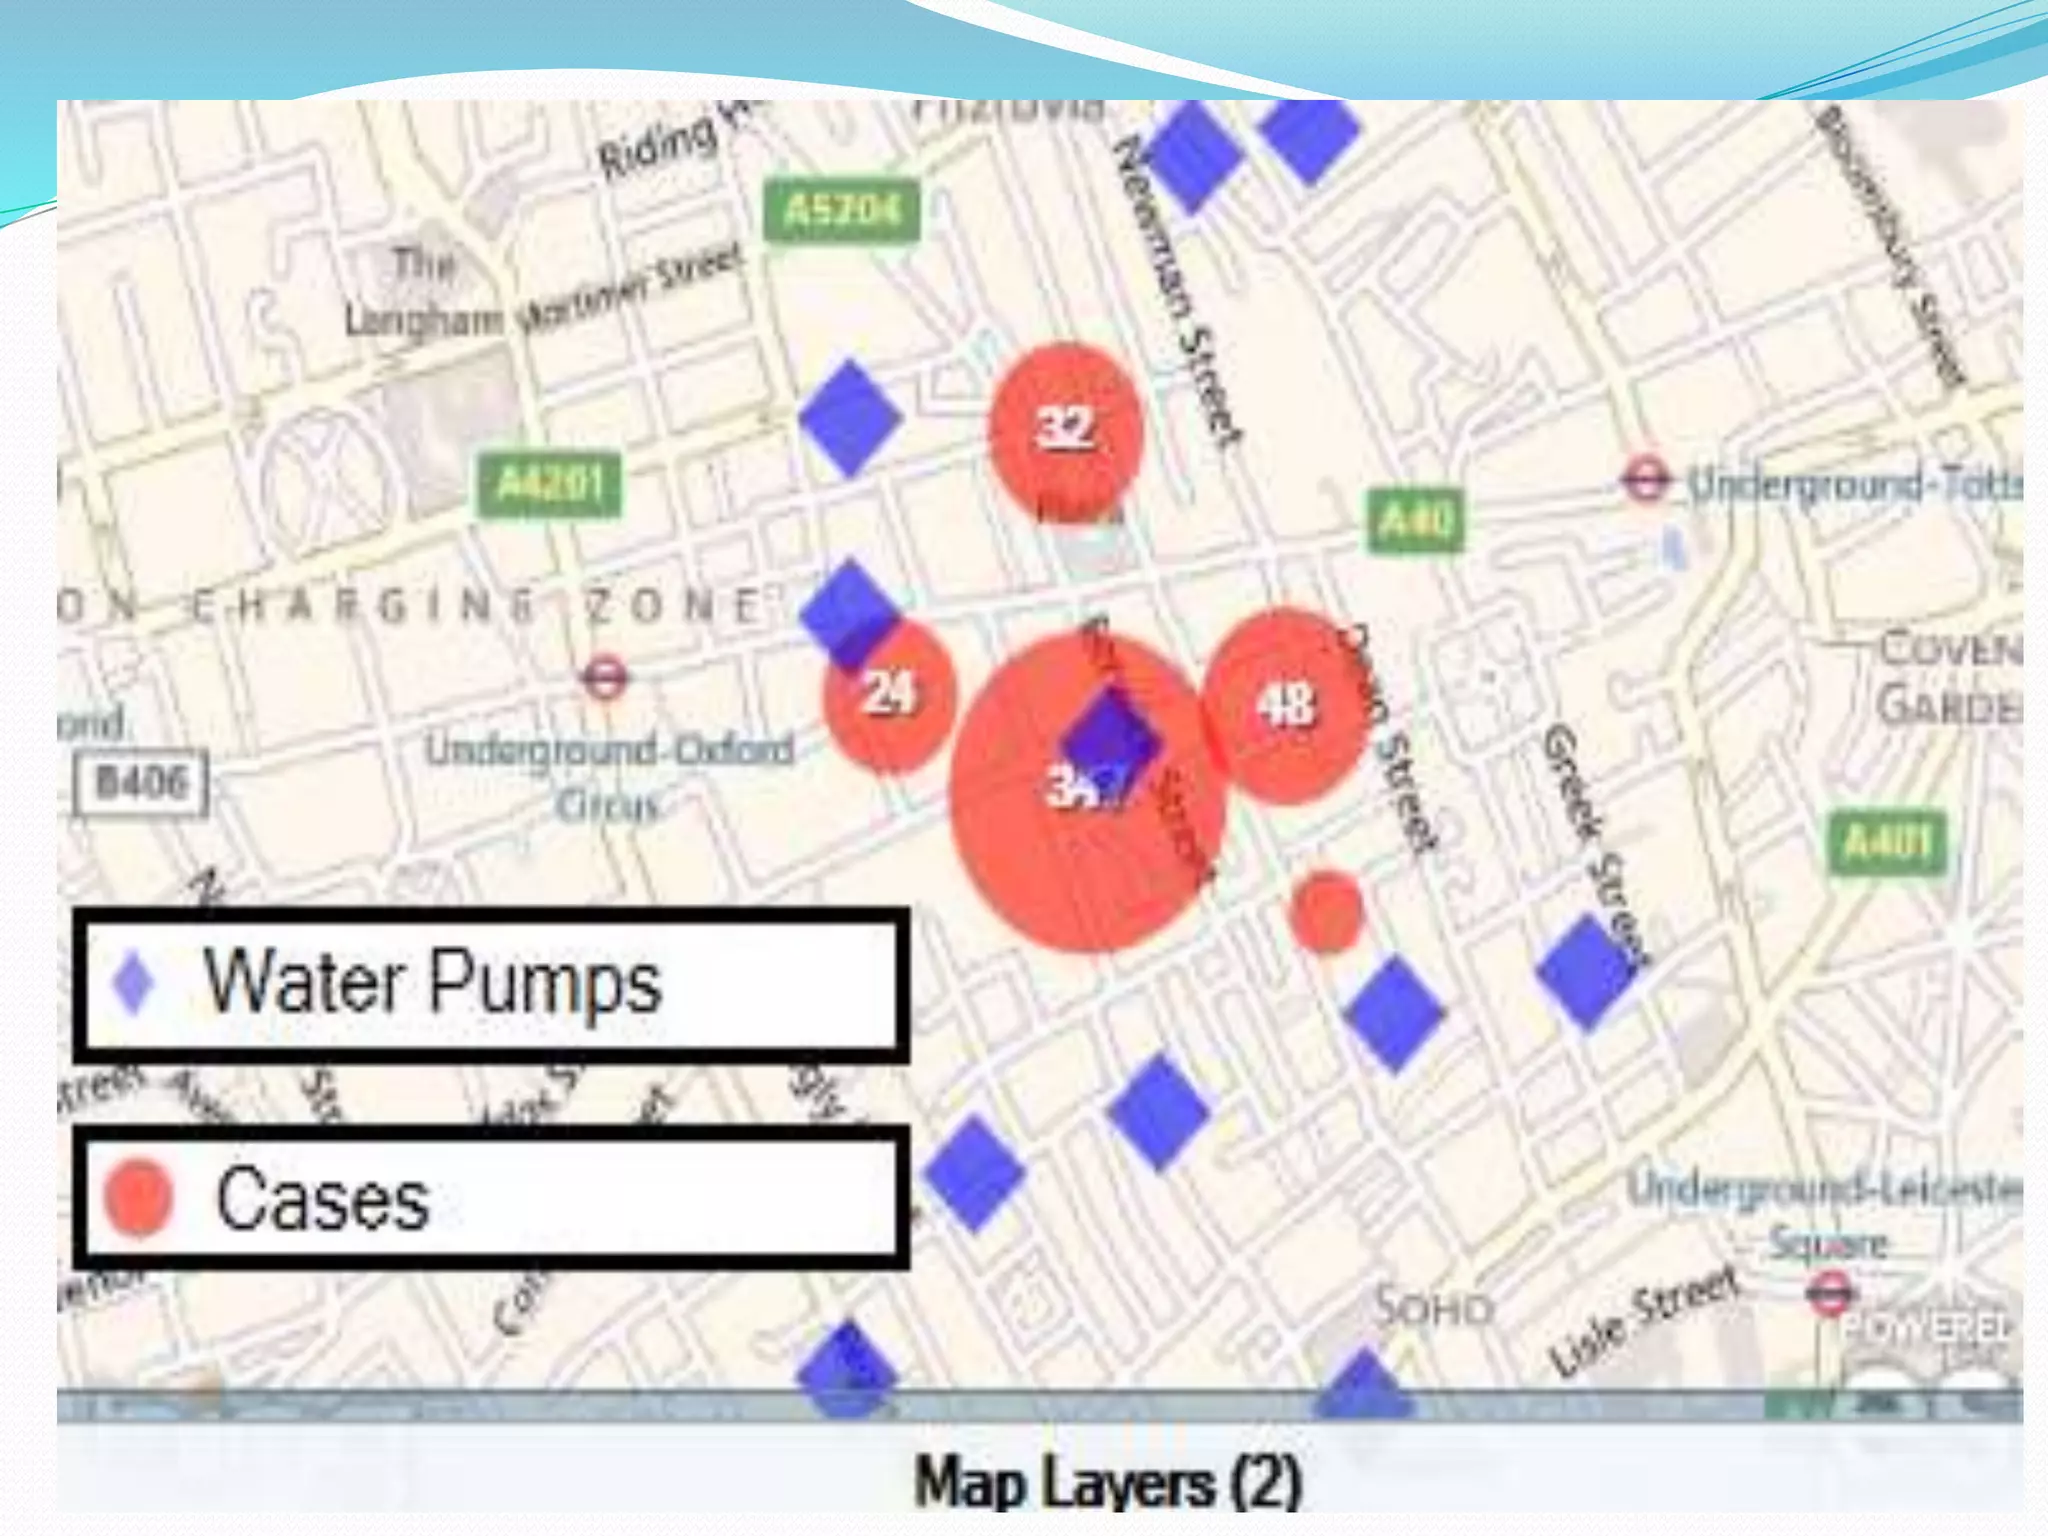
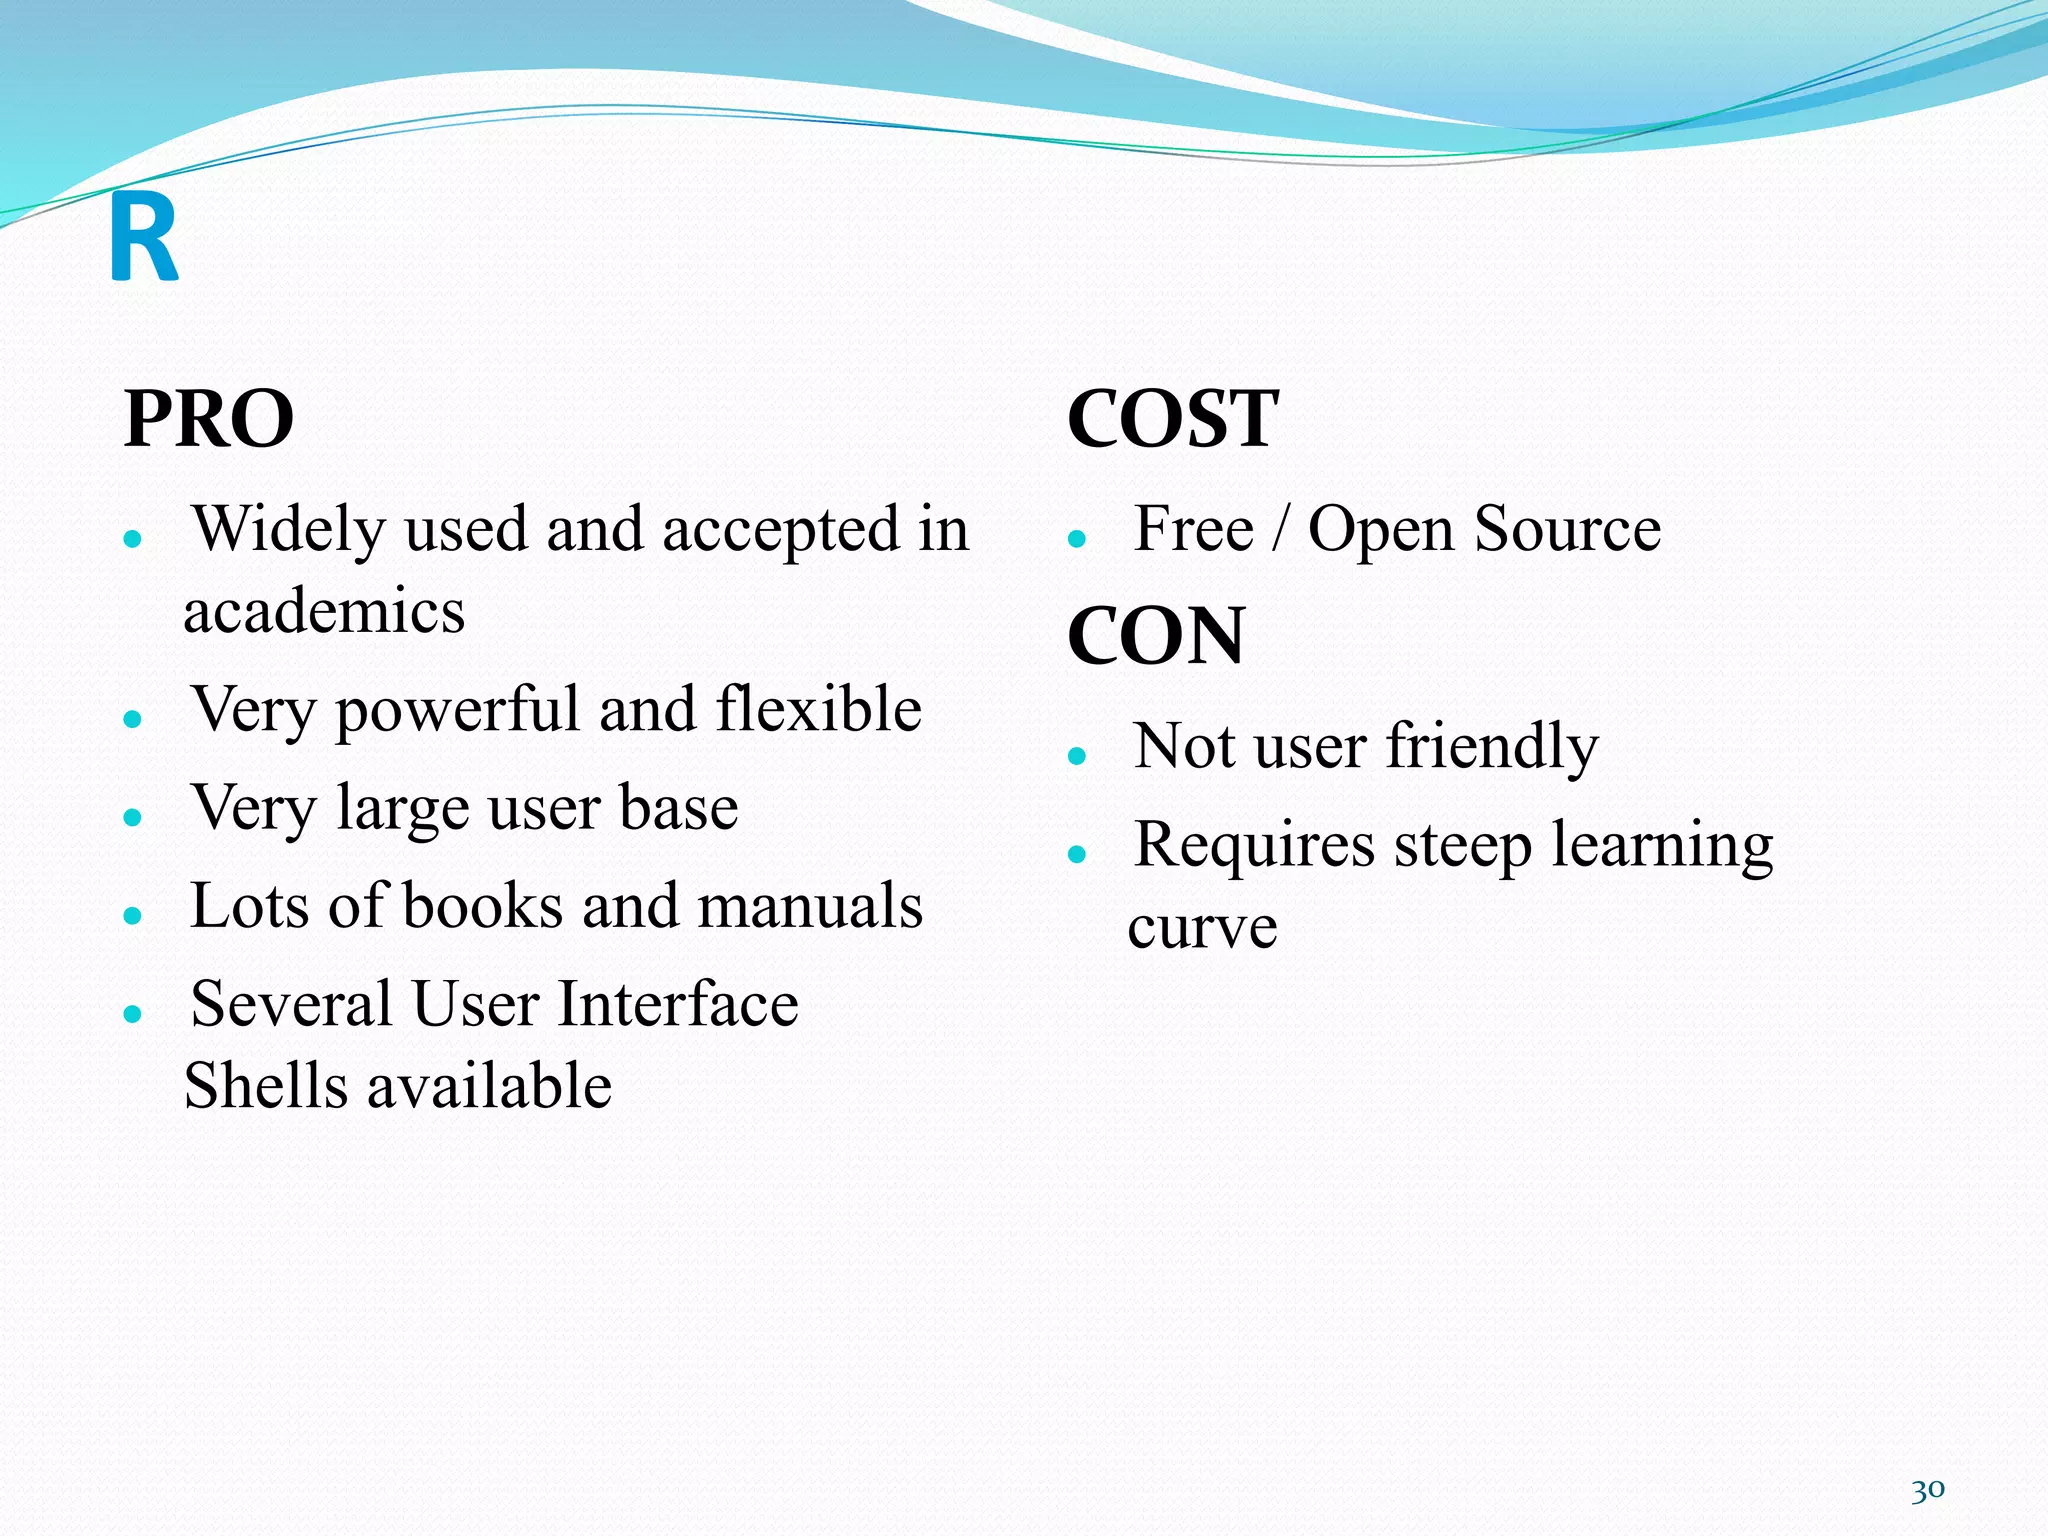
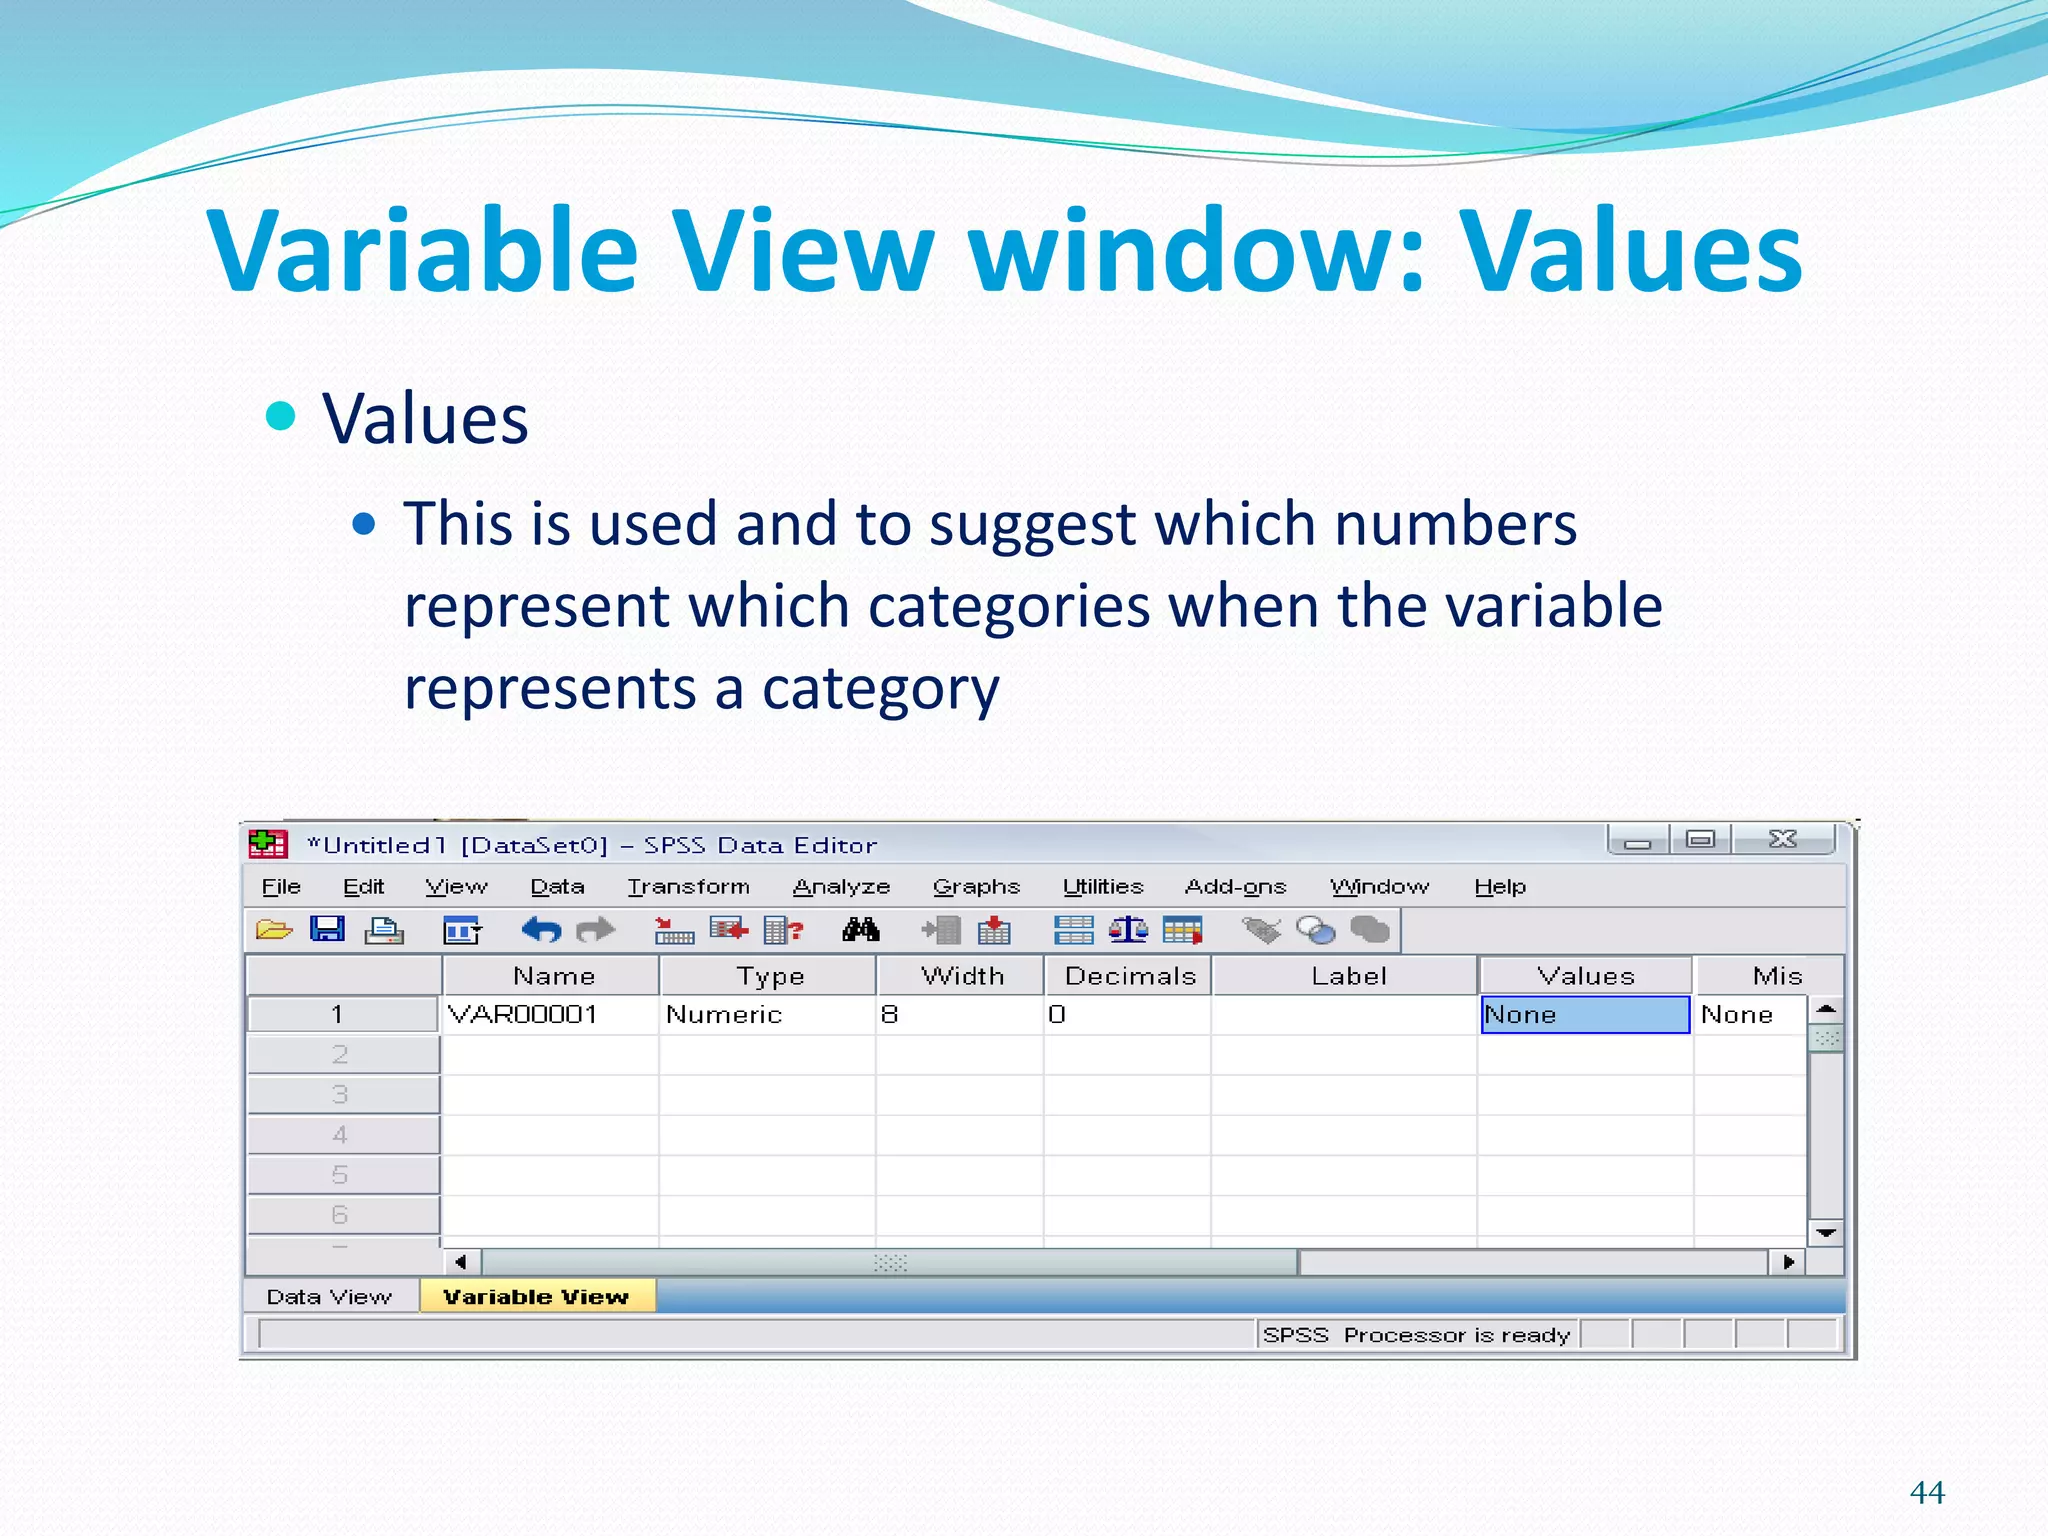
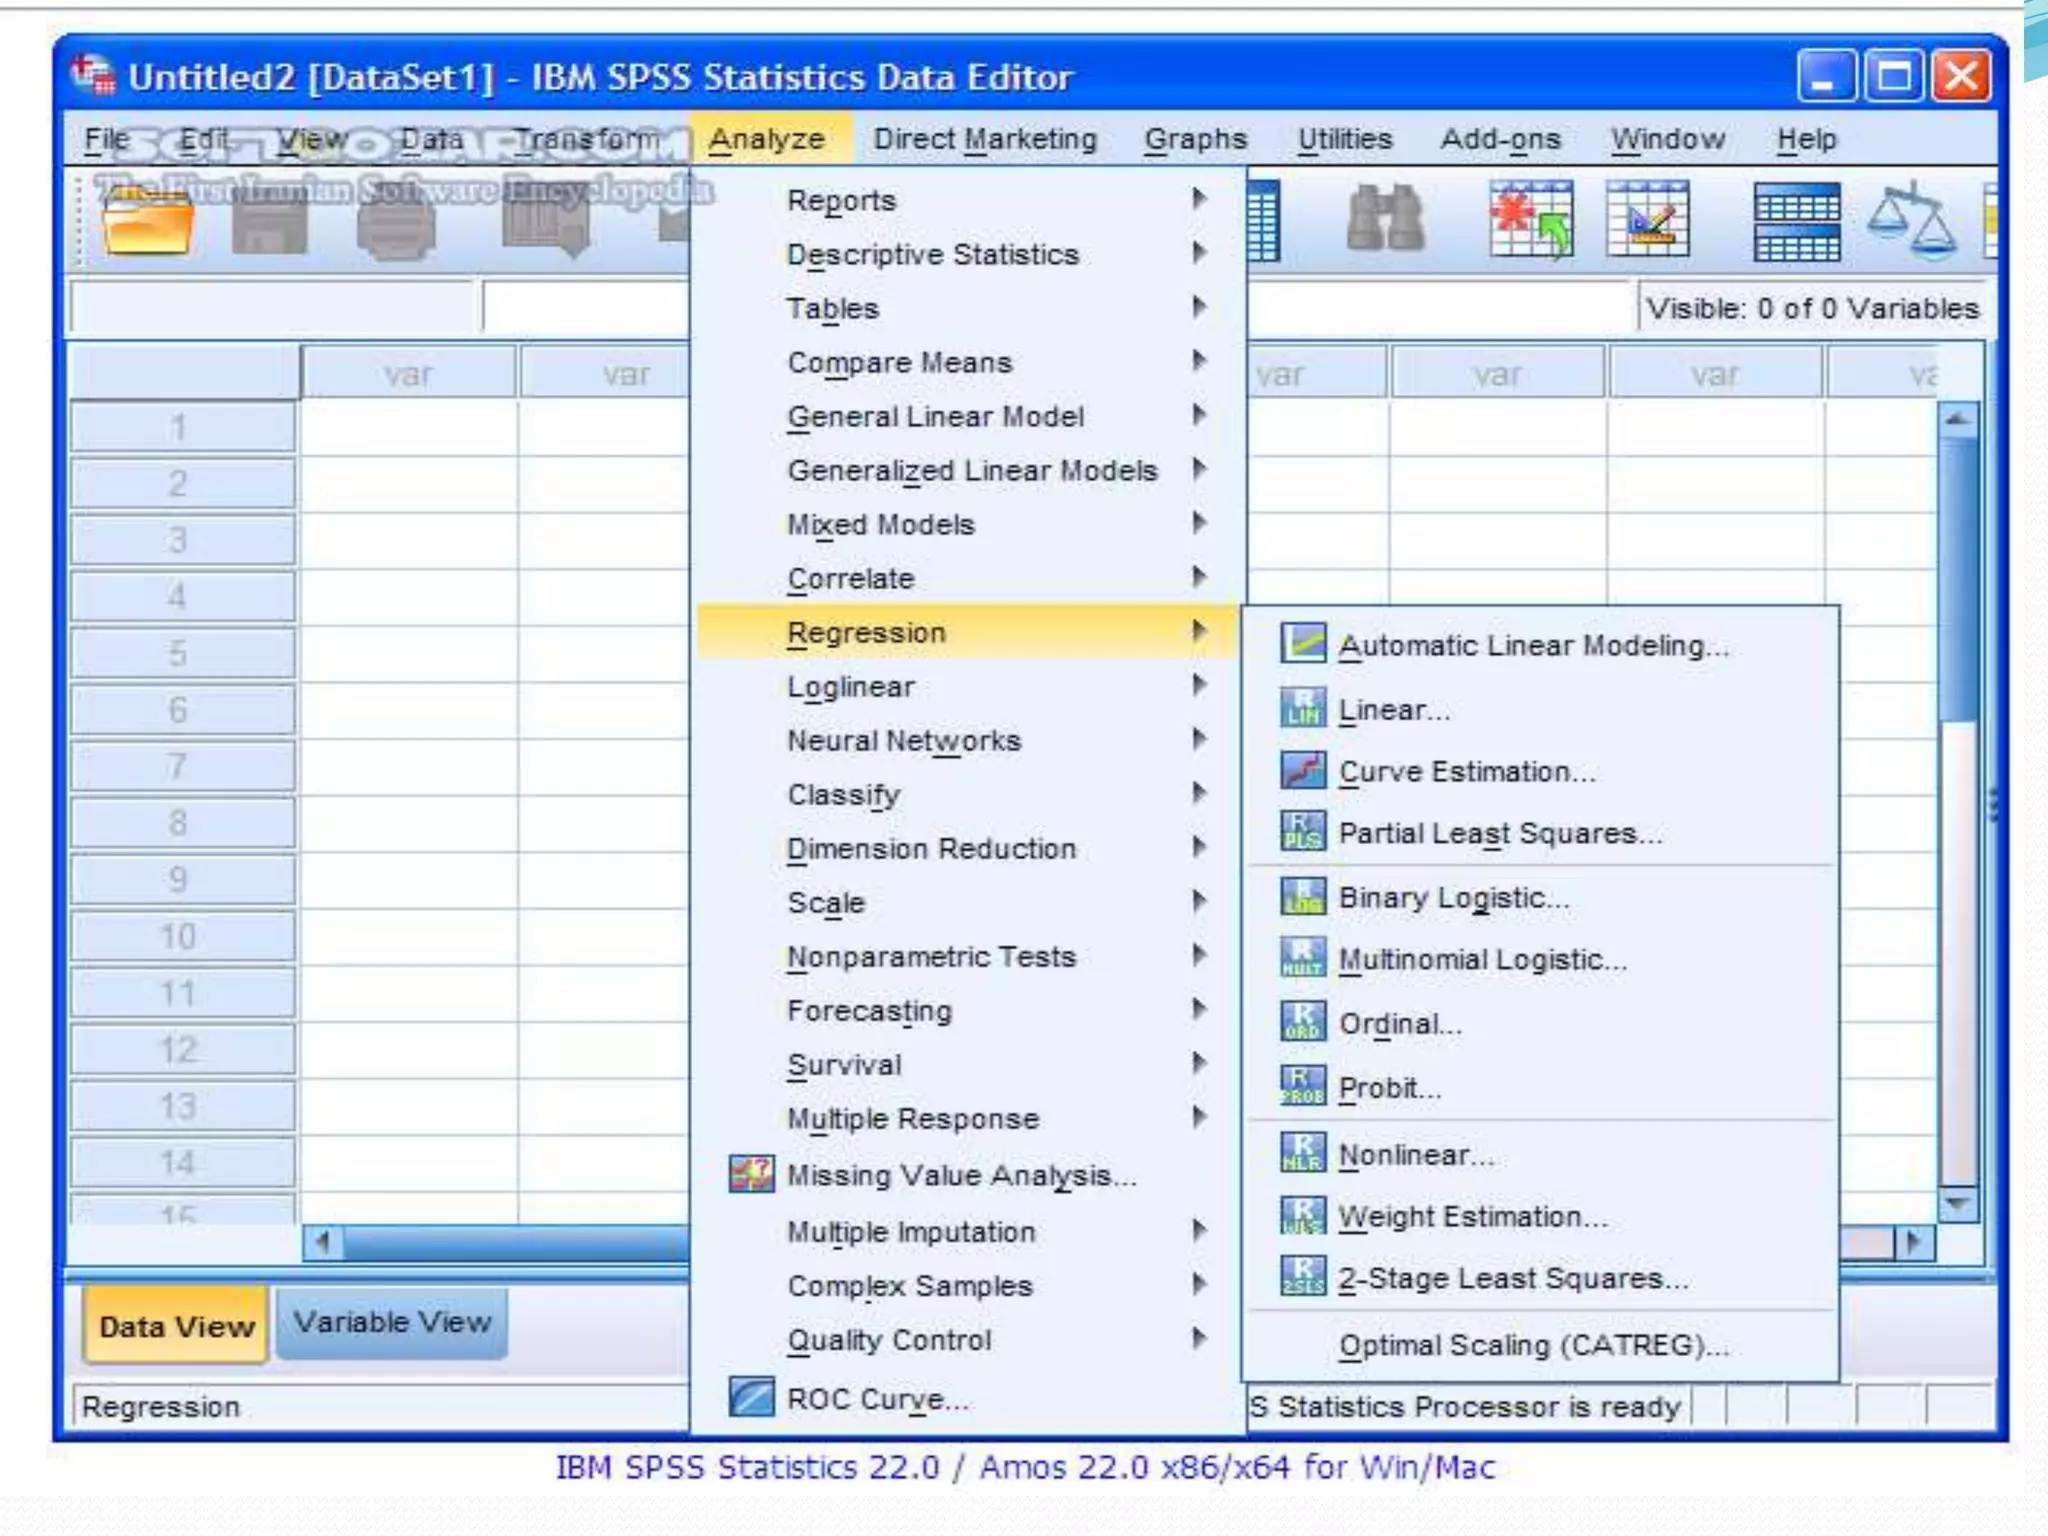
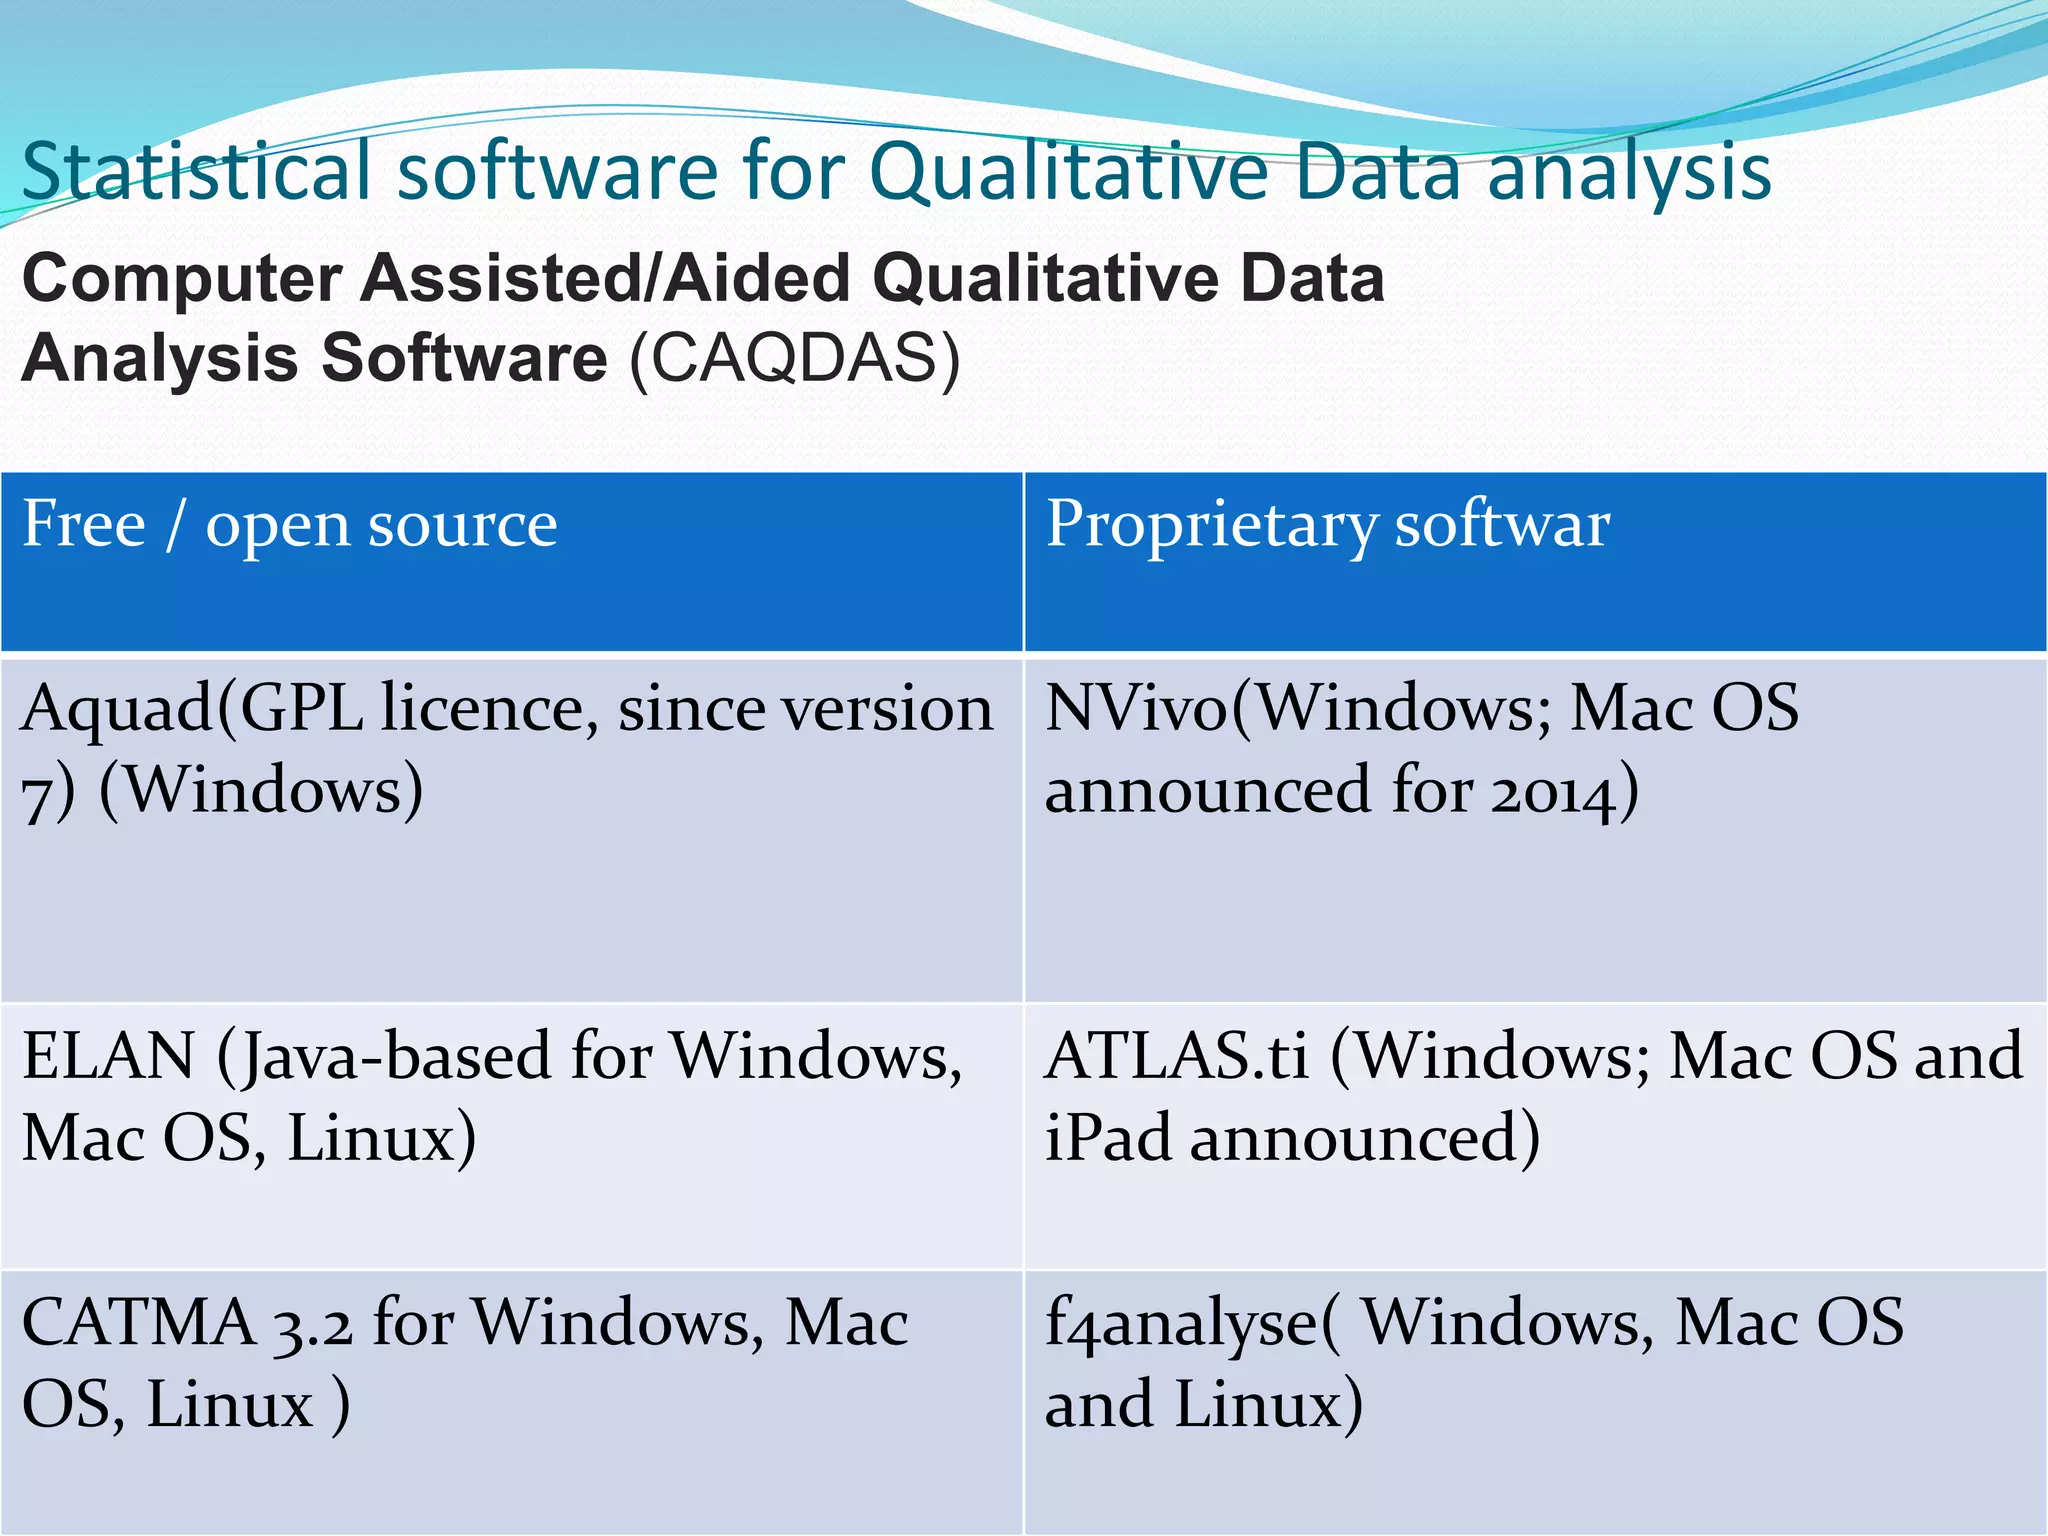
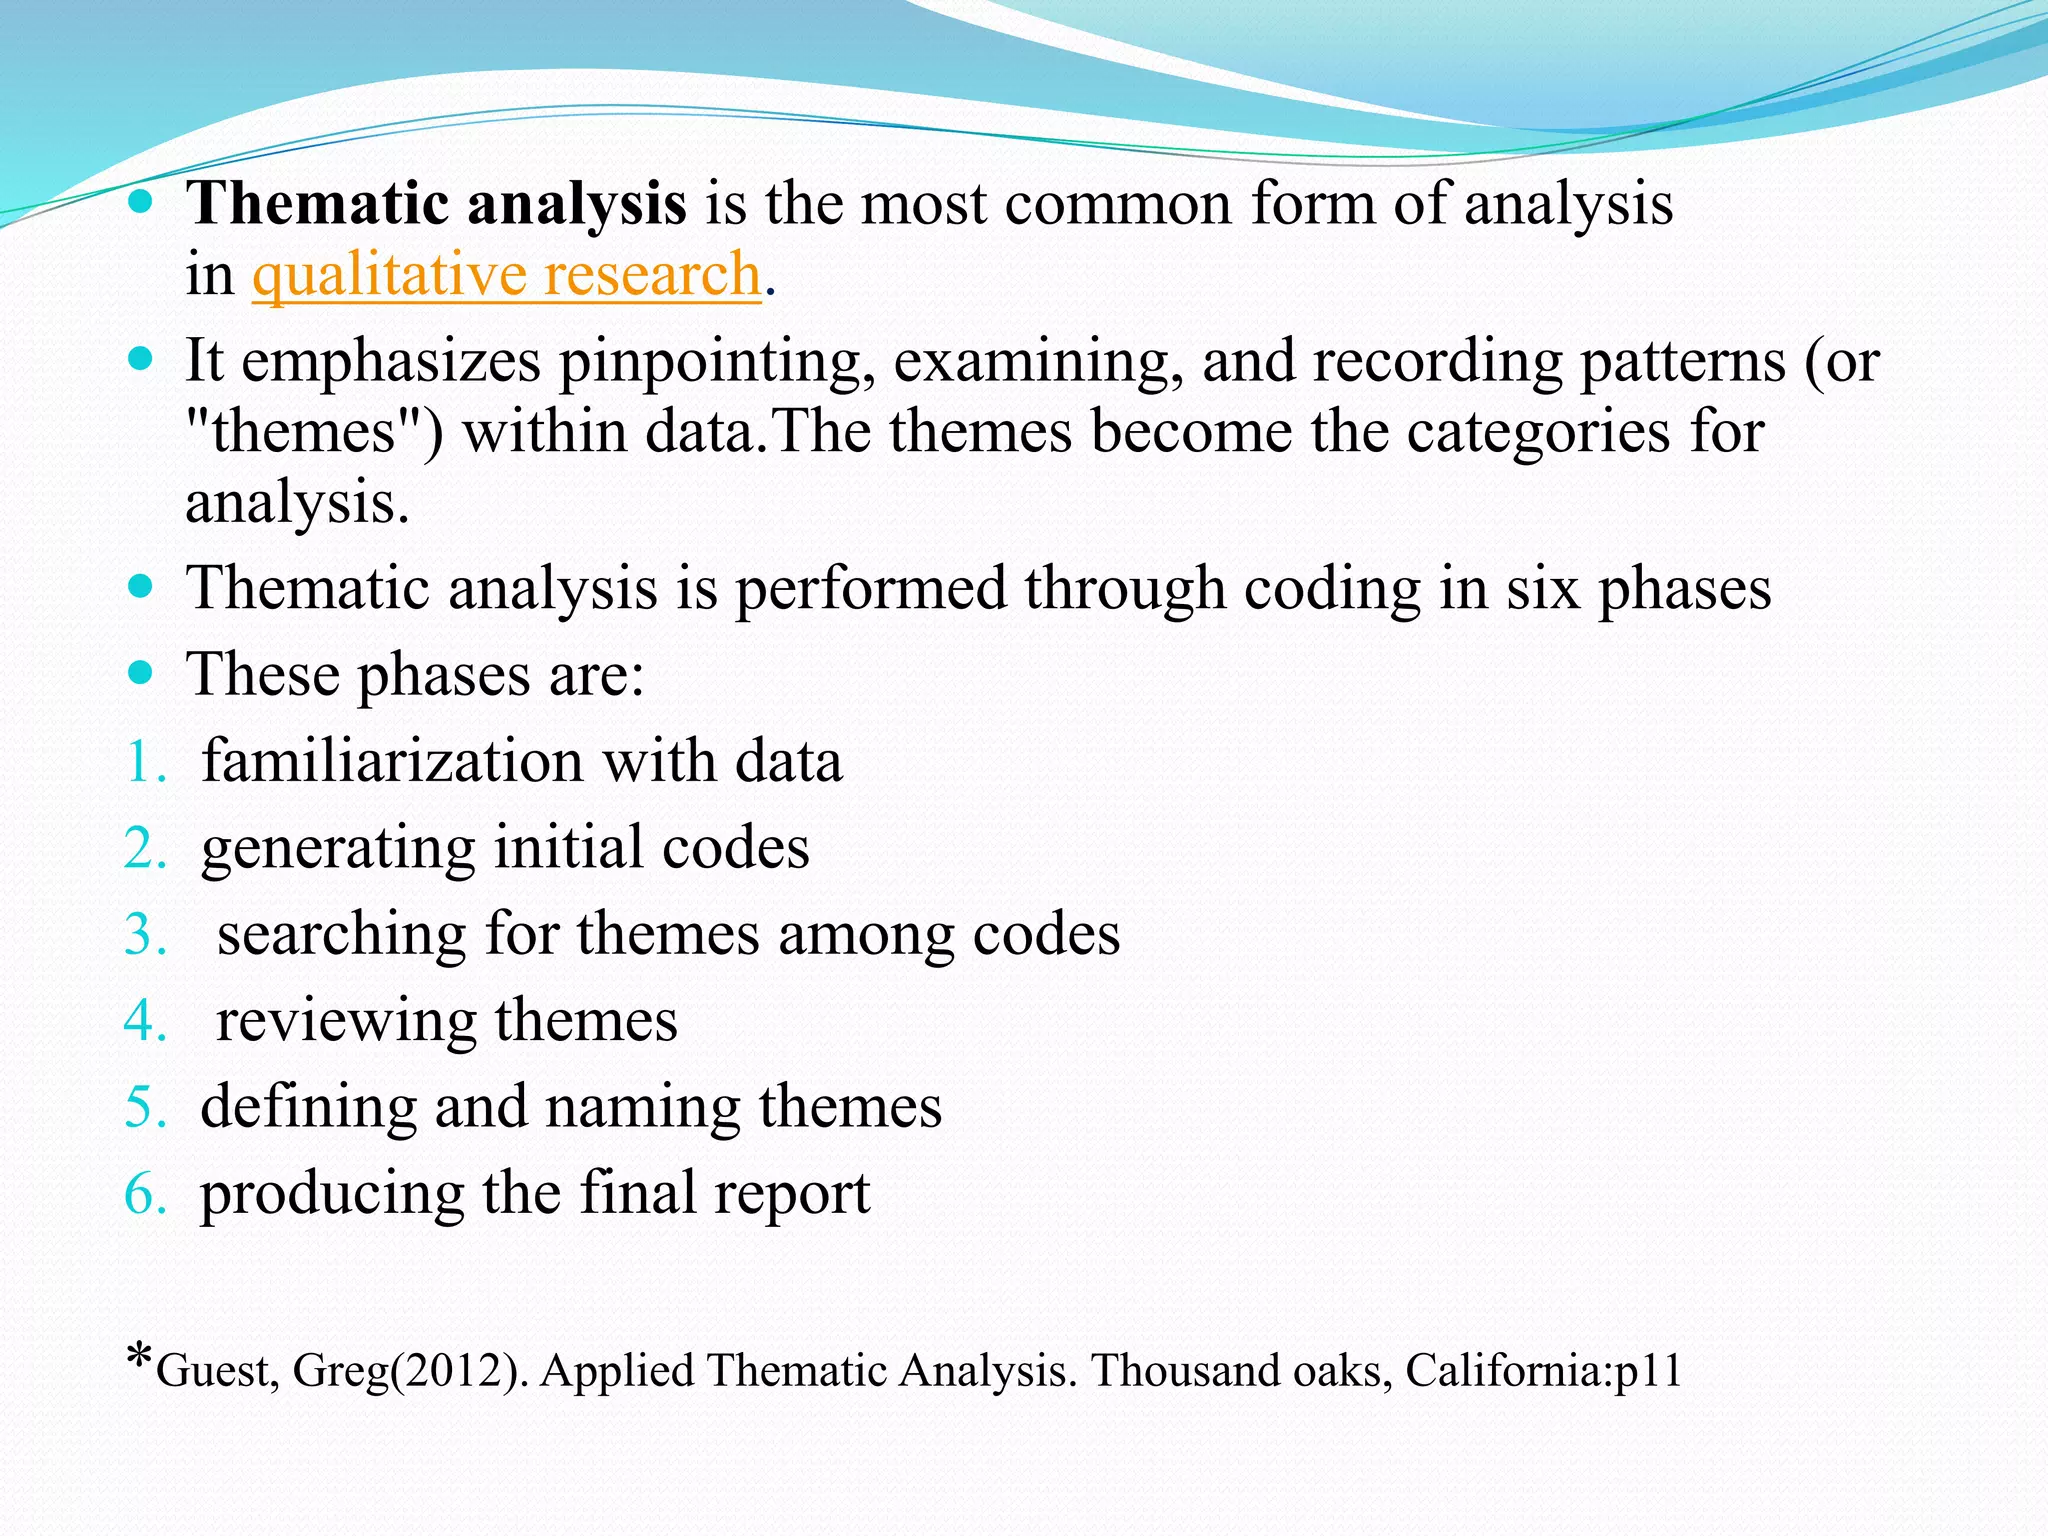
Dr. Pragyan Paramita Parija
Department of Community Medicine,
VMMC & Safdarjung Hospital, NewDelhi
1
 Introduction
 Steps for use of softwares
 Applications of statistical softwares in public health
 Advantages of using computer softwares
 Briefly about some softwares
OUTLINE OF PRESENTATION:
 STATISTICS derived from the
New Latin statisticum collegium ("council of state")
Italian word statista ("statesman" or "politician").
 It was introduced into English in 1791 by Sir John Sinclair
when he published the first of 21 volumes titled Statistical
Account of Scotland.
STATISTICS*: Statistics is the study of the collection,
organization, analysis, and interpretation of data
*BIOSTATISTICS A Foundation for Analysis in the Health Sciences, WAYNE W. DANIEL
Introduction
 Biostatistics*:
Biostatistics is the term used when tools of statistics are
applied to the data that is derived from biological sciences,
particularly from the fields of Medicine and public health.
*BIOSTATISTICS A Foundation for Analysis in the Health Sciences, WAYNE W. DANIEL,
A. Preparing for the study
B. Tools
C. Analysis
D. Programmes for specific task
* Abramsons and abramsons
STEPS FOR RESEARCH:
1. Reference Management
2. Sample Size and Power
3. Planning A clinical Trial
4. Web based survey
A. Preparing for study
 1. Reference management:
a) BiblioExpress: store, arrange, sort, format, export reference(
reference manager)
b) Zotero: + automatically captures citations from most of the pages(
Reference manager + information manager).It is an add on to the
free browser FIREFOX, it can be used only if firefox is open.
c) Mendley:
d) MyNCBI: Allow users to save pubmed researches only.
e) Mekentosj papers: large collection of PDF files managed more
easily. only available for Apple macintosh users, no version for
windows.
f) citeUlike
g) Connotea
h) Hubmed
 2. Sample Size and Power:
1. Describe
2. Compare2
3. PS
4. PASS
5. Lenth's Java Applets for power and sample size
6. OpenEpi
7. GPower
8. Power upR
 3. Planning a clinical trial: Trial protocol Tool
 4. Web surveys: Google forms, Survey forms flash out
while surfing nets, Satisfaction forms after foods at many
restaurants on Tabs.
 B. Tools:
1. Randomization - Etcetera, SISA,Gcalc
2. Calculators - Instacalc, Calcr
3. P- value - Whatis, PQRS
4. Spreadsheet- Kyplot, Lamorte
5. Graphs - RJS Graph, SBHisto
6. Epidemic curve - Decsribe
7. Text editor - Crimson editor
 C. Analysis: General - by Softwares
 D. Anaalysis: Specific Task -
1. Misclassification- Describe( single variable),
Comapre2( unpaired data), Pairsetc( paired data)
2. Assessing a scale- Etcetera( compute Cronbach's alpha)
3. Others
1. To provide the magnitude of any health problem in the
community.
2. To find out the basic factors underlying the ill-health
3. To calculate sample size from large study population while
conducting study/ research in the community.
4. To calculate survival rates of various diseases
5. To examine association between two variables in a given
study.
APPLICATIONS OF BIOSTATS IN PUBLIC HEALTH:
6. To study the prevalence and incidence of a disease.
7. To find out odds ratio, relative risk, attributable risk in case-
control and cohort study.
8. To find out normal distribution of a disease or health related
event
9. To test usefulness of sera and vaccines in the field -
percentages of attacks or deaths among the vaccinated
subjects is compared with that among the unvaccinated ones
to find whether the difference observed is statistically
significant
10. In epidemiological studies - the role of causative factors is
statistically tested.
11. In planning cycle for analysis of health situation
12. To evaluate the health programs which was introduced in the
community (success/failure).
12. To introduce and promote health legislation.
1. Accuracy and speed :
2. Versality :
3. Graphics:
4. Flexibility:
5. New variables:
6. Volume of data:
7. Easy transfer of data:
Advantages of using a computer software:
Applications of statistical software in medical field :
1. compilation, tabulation and diagrammatic presentation
2. Finding averages, coefficient of variation, standard deviation
and standard error and percentiles
3. The application of tests of significance such as Z, t, X2 ,
correlation and regression coefficients
4. Construction of life tables to find longevity of life at birth and
at any age
Commonly used Statistical softwares:
1. EXCEL
2. Epi Info
3. IBM SPSS
4. STATA
5. SAS
6. R Statistical software
Available Statistical Packages
Proprietary
 Excel
 SPSS
 SAS
 STATA
Free Software
 EpiInfo
 R
19
Types of statistical software
window Syntax Window+
syntax
Epi info SAS SPSS
MS Excel R STATA
Microsoft Excel
COST
 Individual License for
Microsoft Office Professional
$350
 Microsoft Office University
Student License: $99
 Volume Discounts available
for large organizations and
universities
 Free Starter Version available
on some new PCs
PRO
 Nearly ubiquitous and is often
pre-installed on new
computers
 User friendly
 Very good for basic
descriptive statistics, charts
and plots
CON
 Costs money
 Not sufficient for anything
beyond the most basic
statistical analysis
21
SPSS
COST
 From $1000 to $12000 per
license depending on license
type.
CON
 Very expensive
 Not adequate for modeling and
cutting edge statistical analysis
 Not able to receive command of
formulas
 Not for systematic review and
metaanalysis
PRO
 Easy to learn and use
 One of the most widely used
statistical packages in
academics and industry
 Has a command line interface
in addition to menu driven user
intefrace
 One of the most powerful
statistical package that is also
easy to use.
22
23
SAS: originally used for management and agriculture
COST
 Complicated pricing model
 $8,500 first year license fee
CON
 Not user friendly
 Steep learning curve
 Relatively poor graphics
capabilities
PRO
 Widely accepted as the leader
in statistical analysis and
modeling
 Widely used in the industry
and academia
 Very flexible and very
powerful.
24
STATA
COST
 Cheaper than SPSS
CON
 Not user friendly
 Steap learning curve
PRO
 Excellent for data
manipulation
 Systematic review and meta
analysis can be done besides
other basic statistical
services
26
EpiInfo
PRO
 Consists of multiple modules to
accomplish various tasks beyond just
statistical analysis.
 ability to rapidly develop a questionnaire
 customize the data entry process
 quickly enter data into that questionnaire
 analyze the data
 rapid assesment of outbreaks
 display geographic map
 clusters and trends of disease can be known
 color shaded map created
COST
 Free
CON
 Not a dedicated
statistical package
 Not as powerful as
commercial alternative
for performing
advanced analysis and
modeling
28
R
PRO
 Widely used and accepted in
academics
 Very powerful and flexible
 Very large user base
 Lots of books and manuals
 Several User Interface
Shells available
COST
 Free / Open Source
CON
 Not user friendly
 Requires steep learning
curve
30
Introduction: What is SPSS?
 Originally it is an acronym of Statistical Package for the
Social Science but now it stands for Statistical Product
and Service Solutions
 One of the most popular statistical packages which can
perform highly complex data manipulation and analysis
with simple instructions
The Four Windows:
• Data editor
• Output viewer
• Syntax editor
• Script window
The Four Windows: Data Editor
 Data Editor
Spreadsheet-like system for defining, entering, editing, and displaying
data.
Extension of the saved file will be “sav.”
The Four Windows: Output Viewer
 Output Viewer
Displays output and errors. Extension of the saved file will be “spv.”
The Four Windows: Syntax editor
 Syntax Editor
Text editor for syntax composition. Extension of the
saved file will be “sps.”
The Four Windows: Script Window
 Script Window
Provides the opportunity to write full-blown programs,
in a BASIC-like language. Text editor for syntax
composition. Extension of the saved file will be “sbs.”
Opening SPSS
 The default window will have the data editor
 There are two sheets in the window:
1. Data view 2. Variable view
Data View window
 The Data View window
This sheet is visible when you first open the Data
Editor and this sheet contains the data
 Click on the tab labeled Variable View
Click
Variable View window
 This sheet contains information about the data set that is stored
with the dataset
 Name
 The first character of the variable name must be alphabetic
 Variable names must be unique, and have to be less than 64
characters.
 Spaces are NOT allowed.
39
Variable View window: Type
 Type
 Click on the ‘type’ box. The two basic types of variables
that you will use are numeric and string. This column
enables you to specify the type of variable.
40
Variable View window: Width
 Width
 Width allows you to determine the number of
characters SPSS will allow to be entered for the
variable
41
Variable View window: Decimals
 Decimals
 Number of decimals
 It has to be less than or equal to 16
3.14159265
42
Variable View window: Label
 Label
 You can specify the details of the variable
 You can write characters with spaces up to 256
characters
43
Variable View window: Values
 Values
 This is used and to suggest which numbers
represent which categories when the variable
represents a category
44
 Freely available
 The software consists of three modules:
1. Anthropometric calculator
2. Individual assessment
3. Nutritional survey
WHO Anthro (version 3.2.2, January 2011)
47
 NutriStat is an open source re-creation of NutStat, a nutritional
anthropomentry tool created by the Centers for Disease Control
and Prevention (CDC) as part of the Epi Info™
 Users will also have the ability to generate z-scores and
percentiles for external data not originally created in NutriStat
 Statistical Output:
1. BMI (raw, z-score, and percentile)
2. Head Circumference
3. Height for Age
4. Weight for Age
5. Weight for Height
6. Subscapular skin fold for Age
NutriStat
Free / open source Proprietary softwar
Aquad(GPL licence, since version
7) (Windows)
NVivo(Windows; Mac OS
announced for 2014)
ELAN (Java-based for Windows,
Mac OS, Linux)
ATLAS.ti (Windows; Mac OS and
iPad announced)
CATMA 3.2 for Windows, Mac
OS, Linux )
f4analyse( Windows, Mac OS
and Linux)
Statistical software for Qualitative Data analysis
Computer Assisted/Aided Qualitative Data
Analysis Software (CAQDAS)
 Thematic analysis is the most common form of analysis
in qualitative research.
 It emphasizes pinpointing, examining, and recording patterns (or
"themes") within data.The themes become the categories for
analysis.
 Thematic analysis is performed through coding in six phases
 These phases are:
1. familiarization with data
2. generating initial codes
3. searching for themes among codes
4. reviewing themes
5. defining and naming themes
6. producing the final report
*Guest, Greg(2012). Applied Thematic Analysis. Thousand oaks, California:p11
 Ministry: Ministry of Statistics and Programme
Implementation
 Central level
1. Central Statistical Office (CSO)
2. National Sample Survey office(NSSO)
 State level:
1. Directorate of economics and statistics
Statistical bodies in India:
 STATISTICS JOURNALS:
 American Review of Mathematis And Statistics
 Bayesian Analysis
 Electronic Journal for History of Probability and Statistics
 Electronic Journal of Statistics
 Journal of Modern Applied Statistical Method
 Journal of Statistical Software
 Journal of Statistics Education
 REVSTAT
 SORT
 Sankhya - The Indian Journal of Statistics
 Statistics Education Research Journal
 Statistics on the Internet
 The R Journal
1. Abramson JH, Abramson ZH Survey methods in
community medicine:5th edition
2. Dalgaard, P. (2008). Introductory Statistics with R (2nd
edition). New York: Springer
3. Dawson B., Trapp RG, Basic and Clinical Biostatistics,
second edition, 1994
4. Dawson B., Trapp RG, Basic and Clinical Biostatistics,
second edition, 1994
5. A Foundation for Analysis in the Health Sciences, Wayne
W Daniel
6. Guest, Greg(2012).Applied Thematic Analysis. Thousand
oaks, California:p11
References:
CLICK ON YOUTUBE, TRY T
LEARN SOFTWARES
softwares in public health

softwares in public health

  • 1.
    Dr. Pragyan ParamitaParija Department of Community Medicine, VMMC & Safdarjung Hospital, NewDelhi 1
  • 2.
     Introduction  Stepsfor use of softwares  Applications of statistical softwares in public health  Advantages of using computer softwares  Briefly about some softwares OUTLINE OF PRESENTATION:
  • 3.
     STATISTICS derivedfrom the New Latin statisticum collegium ("council of state") Italian word statista ("statesman" or "politician").  It was introduced into English in 1791 by Sir John Sinclair when he published the first of 21 volumes titled Statistical Account of Scotland. STATISTICS*: Statistics is the study of the collection, organization, analysis, and interpretation of data *BIOSTATISTICS A Foundation for Analysis in the Health Sciences, WAYNE W. DANIEL Introduction
  • 4.
     Biostatistics*: Biostatistics isthe term used when tools of statistics are applied to the data that is derived from biological sciences, particularly from the fields of Medicine and public health. *BIOSTATISTICS A Foundation for Analysis in the Health Sciences, WAYNE W. DANIEL,
  • 5.
    A. Preparing forthe study B. Tools C. Analysis D. Programmes for specific task * Abramsons and abramsons STEPS FOR RESEARCH:
  • 6.
    1. Reference Management 2.Sample Size and Power 3. Planning A clinical Trial 4. Web based survey A. Preparing for study
  • 7.
     1. Referencemanagement: a) BiblioExpress: store, arrange, sort, format, export reference( reference manager) b) Zotero: + automatically captures citations from most of the pages( Reference manager + information manager).It is an add on to the free browser FIREFOX, it can be used only if firefox is open. c) Mendley: d) MyNCBI: Allow users to save pubmed researches only. e) Mekentosj papers: large collection of PDF files managed more easily. only available for Apple macintosh users, no version for windows. f) citeUlike g) Connotea h) Hubmed
  • 8.
     2. SampleSize and Power: 1. Describe 2. Compare2 3. PS 4. PASS 5. Lenth's Java Applets for power and sample size 6. OpenEpi 7. GPower 8. Power upR
  • 10.
     3. Planninga clinical trial: Trial protocol Tool  4. Web surveys: Google forms, Survey forms flash out while surfing nets, Satisfaction forms after foods at many restaurants on Tabs.
  • 11.
     B. Tools: 1.Randomization - Etcetera, SISA,Gcalc 2. Calculators - Instacalc, Calcr 3. P- value - Whatis, PQRS 4. Spreadsheet- Kyplot, Lamorte 5. Graphs - RJS Graph, SBHisto 6. Epidemic curve - Decsribe 7. Text editor - Crimson editor
  • 12.
     C. Analysis:General - by Softwares  D. Anaalysis: Specific Task - 1. Misclassification- Describe( single variable), Comapre2( unpaired data), Pairsetc( paired data) 2. Assessing a scale- Etcetera( compute Cronbach's alpha) 3. Others
  • 13.
    1. To providethe magnitude of any health problem in the community. 2. To find out the basic factors underlying the ill-health 3. To calculate sample size from large study population while conducting study/ research in the community. 4. To calculate survival rates of various diseases 5. To examine association between two variables in a given study. APPLICATIONS OF BIOSTATS IN PUBLIC HEALTH:
  • 14.
    6. To studythe prevalence and incidence of a disease. 7. To find out odds ratio, relative risk, attributable risk in case- control and cohort study. 8. To find out normal distribution of a disease or health related event 9. To test usefulness of sera and vaccines in the field - percentages of attacks or deaths among the vaccinated subjects is compared with that among the unvaccinated ones to find whether the difference observed is statistically significant
  • 15.
    10. In epidemiologicalstudies - the role of causative factors is statistically tested. 11. In planning cycle for analysis of health situation 12. To evaluate the health programs which was introduced in the community (success/failure). 12. To introduce and promote health legislation.
  • 16.
    1. Accuracy andspeed : 2. Versality : 3. Graphics: 4. Flexibility: 5. New variables: 6. Volume of data: 7. Easy transfer of data: Advantages of using a computer software:
  • 17.
    Applications of statisticalsoftware in medical field : 1. compilation, tabulation and diagrammatic presentation 2. Finding averages, coefficient of variation, standard deviation and standard error and percentiles 3. The application of tests of significance such as Z, t, X2 , correlation and regression coefficients 4. Construction of life tables to find longevity of life at birth and at any age
  • 18.
    Commonly used Statisticalsoftwares: 1. EXCEL 2. Epi Info 3. IBM SPSS 4. STATA 5. SAS 6. R Statistical software
  • 19.
    Available Statistical Packages Proprietary Excel  SPSS  SAS  STATA Free Software  EpiInfo  R 19
  • 20.
    Types of statisticalsoftware window Syntax Window+ syntax Epi info SAS SPSS MS Excel R STATA
  • 21.
    Microsoft Excel COST  IndividualLicense for Microsoft Office Professional $350  Microsoft Office University Student License: $99  Volume Discounts available for large organizations and universities  Free Starter Version available on some new PCs PRO  Nearly ubiquitous and is often pre-installed on new computers  User friendly  Very good for basic descriptive statistics, charts and plots CON  Costs money  Not sufficient for anything beyond the most basic statistical analysis 21
  • 22.
    SPSS COST  From $1000to $12000 per license depending on license type. CON  Very expensive  Not adequate for modeling and cutting edge statistical analysis  Not able to receive command of formulas  Not for systematic review and metaanalysis PRO  Easy to learn and use  One of the most widely used statistical packages in academics and industry  Has a command line interface in addition to menu driven user intefrace  One of the most powerful statistical package that is also easy to use. 22
  • 23.
  • 24.
    SAS: originally usedfor management and agriculture COST  Complicated pricing model  $8,500 first year license fee CON  Not user friendly  Steep learning curve  Relatively poor graphics capabilities PRO  Widely accepted as the leader in statistical analysis and modeling  Widely used in the industry and academia  Very flexible and very powerful. 24
  • 26.
    STATA COST  Cheaper thanSPSS CON  Not user friendly  Steap learning curve PRO  Excellent for data manipulation  Systematic review and meta analysis can be done besides other basic statistical services 26
  • 28.
    EpiInfo PRO  Consists ofmultiple modules to accomplish various tasks beyond just statistical analysis.  ability to rapidly develop a questionnaire  customize the data entry process  quickly enter data into that questionnaire  analyze the data  rapid assesment of outbreaks  display geographic map  clusters and trends of disease can be known  color shaded map created COST  Free CON  Not a dedicated statistical package  Not as powerful as commercial alternative for performing advanced analysis and modeling 28
  • 30.
    R PRO  Widely usedand accepted in academics  Very powerful and flexible  Very large user base  Lots of books and manuals  Several User Interface Shells available COST  Free / Open Source CON  Not user friendly  Requires steep learning curve 30
  • 31.
    Introduction: What isSPSS?  Originally it is an acronym of Statistical Package for the Social Science but now it stands for Statistical Product and Service Solutions  One of the most popular statistical packages which can perform highly complex data manipulation and analysis with simple instructions
  • 32.
    The Four Windows: •Data editor • Output viewer • Syntax editor • Script window
  • 33.
    The Four Windows:Data Editor  Data Editor Spreadsheet-like system for defining, entering, editing, and displaying data. Extension of the saved file will be “sav.”
  • 34.
    The Four Windows:Output Viewer  Output Viewer Displays output and errors. Extension of the saved file will be “spv.”
  • 35.
    The Four Windows:Syntax editor  Syntax Editor Text editor for syntax composition. Extension of the saved file will be “sps.”
  • 36.
    The Four Windows:Script Window  Script Window Provides the opportunity to write full-blown programs, in a BASIC-like language. Text editor for syntax composition. Extension of the saved file will be “sbs.”
  • 37.
    Opening SPSS  Thedefault window will have the data editor  There are two sheets in the window: 1. Data view 2. Variable view
  • 38.
    Data View window The Data View window This sheet is visible when you first open the Data Editor and this sheet contains the data  Click on the tab labeled Variable View Click
  • 39.
    Variable View window This sheet contains information about the data set that is stored with the dataset  Name  The first character of the variable name must be alphabetic  Variable names must be unique, and have to be less than 64 characters.  Spaces are NOT allowed. 39
  • 40.
    Variable View window:Type  Type  Click on the ‘type’ box. The two basic types of variables that you will use are numeric and string. This column enables you to specify the type of variable. 40
  • 41.
    Variable View window:Width  Width  Width allows you to determine the number of characters SPSS will allow to be entered for the variable 41
  • 42.
    Variable View window:Decimals  Decimals  Number of decimals  It has to be less than or equal to 16 3.14159265 42
  • 43.
    Variable View window:Label  Label  You can specify the details of the variable  You can write characters with spaces up to 256 characters 43
  • 44.
    Variable View window:Values  Values  This is used and to suggest which numbers represent which categories when the variable represents a category 44
  • 46.
     Freely available The software consists of three modules: 1. Anthropometric calculator 2. Individual assessment 3. Nutritional survey WHO Anthro (version 3.2.2, January 2011)
  • 47.
  • 48.
     NutriStat isan open source re-creation of NutStat, a nutritional anthropomentry tool created by the Centers for Disease Control and Prevention (CDC) as part of the Epi Info™  Users will also have the ability to generate z-scores and percentiles for external data not originally created in NutriStat  Statistical Output: 1. BMI (raw, z-score, and percentile) 2. Head Circumference 3. Height for Age 4. Weight for Age 5. Weight for Height 6. Subscapular skin fold for Age NutriStat
  • 49.
    Free / opensource Proprietary softwar Aquad(GPL licence, since version 7) (Windows) NVivo(Windows; Mac OS announced for 2014) ELAN (Java-based for Windows, Mac OS, Linux) ATLAS.ti (Windows; Mac OS and iPad announced) CATMA 3.2 for Windows, Mac OS, Linux ) f4analyse( Windows, Mac OS and Linux) Statistical software for Qualitative Data analysis Computer Assisted/Aided Qualitative Data Analysis Software (CAQDAS)
  • 50.
     Thematic analysisis the most common form of analysis in qualitative research.  It emphasizes pinpointing, examining, and recording patterns (or "themes") within data.The themes become the categories for analysis.  Thematic analysis is performed through coding in six phases  These phases are: 1. familiarization with data 2. generating initial codes 3. searching for themes among codes 4. reviewing themes 5. defining and naming themes 6. producing the final report *Guest, Greg(2012). Applied Thematic Analysis. Thousand oaks, California:p11
  • 51.
     Ministry: Ministryof Statistics and Programme Implementation  Central level 1. Central Statistical Office (CSO) 2. National Sample Survey office(NSSO)  State level: 1. Directorate of economics and statistics Statistical bodies in India:
  • 52.
     STATISTICS JOURNALS: American Review of Mathematis And Statistics  Bayesian Analysis  Electronic Journal for History of Probability and Statistics  Electronic Journal of Statistics  Journal of Modern Applied Statistical Method  Journal of Statistical Software  Journal of Statistics Education  REVSTAT  SORT  Sankhya - The Indian Journal of Statistics  Statistics Education Research Journal  Statistics on the Internet  The R Journal
  • 53.
    1. Abramson JH,Abramson ZH Survey methods in community medicine:5th edition 2. Dalgaard, P. (2008). Introductory Statistics with R (2nd edition). New York: Springer 3. Dawson B., Trapp RG, Basic and Clinical Biostatistics, second edition, 1994 4. Dawson B., Trapp RG, Basic and Clinical Biostatistics, second edition, 1994 5. A Foundation for Analysis in the Health Sciences, Wayne W Daniel 6. Guest, Greg(2012).Applied Thematic Analysis. Thousand oaks, California:p11 References:
  • 54.
    CLICK ON YOUTUBE,TRY T LEARN SOFTWARES