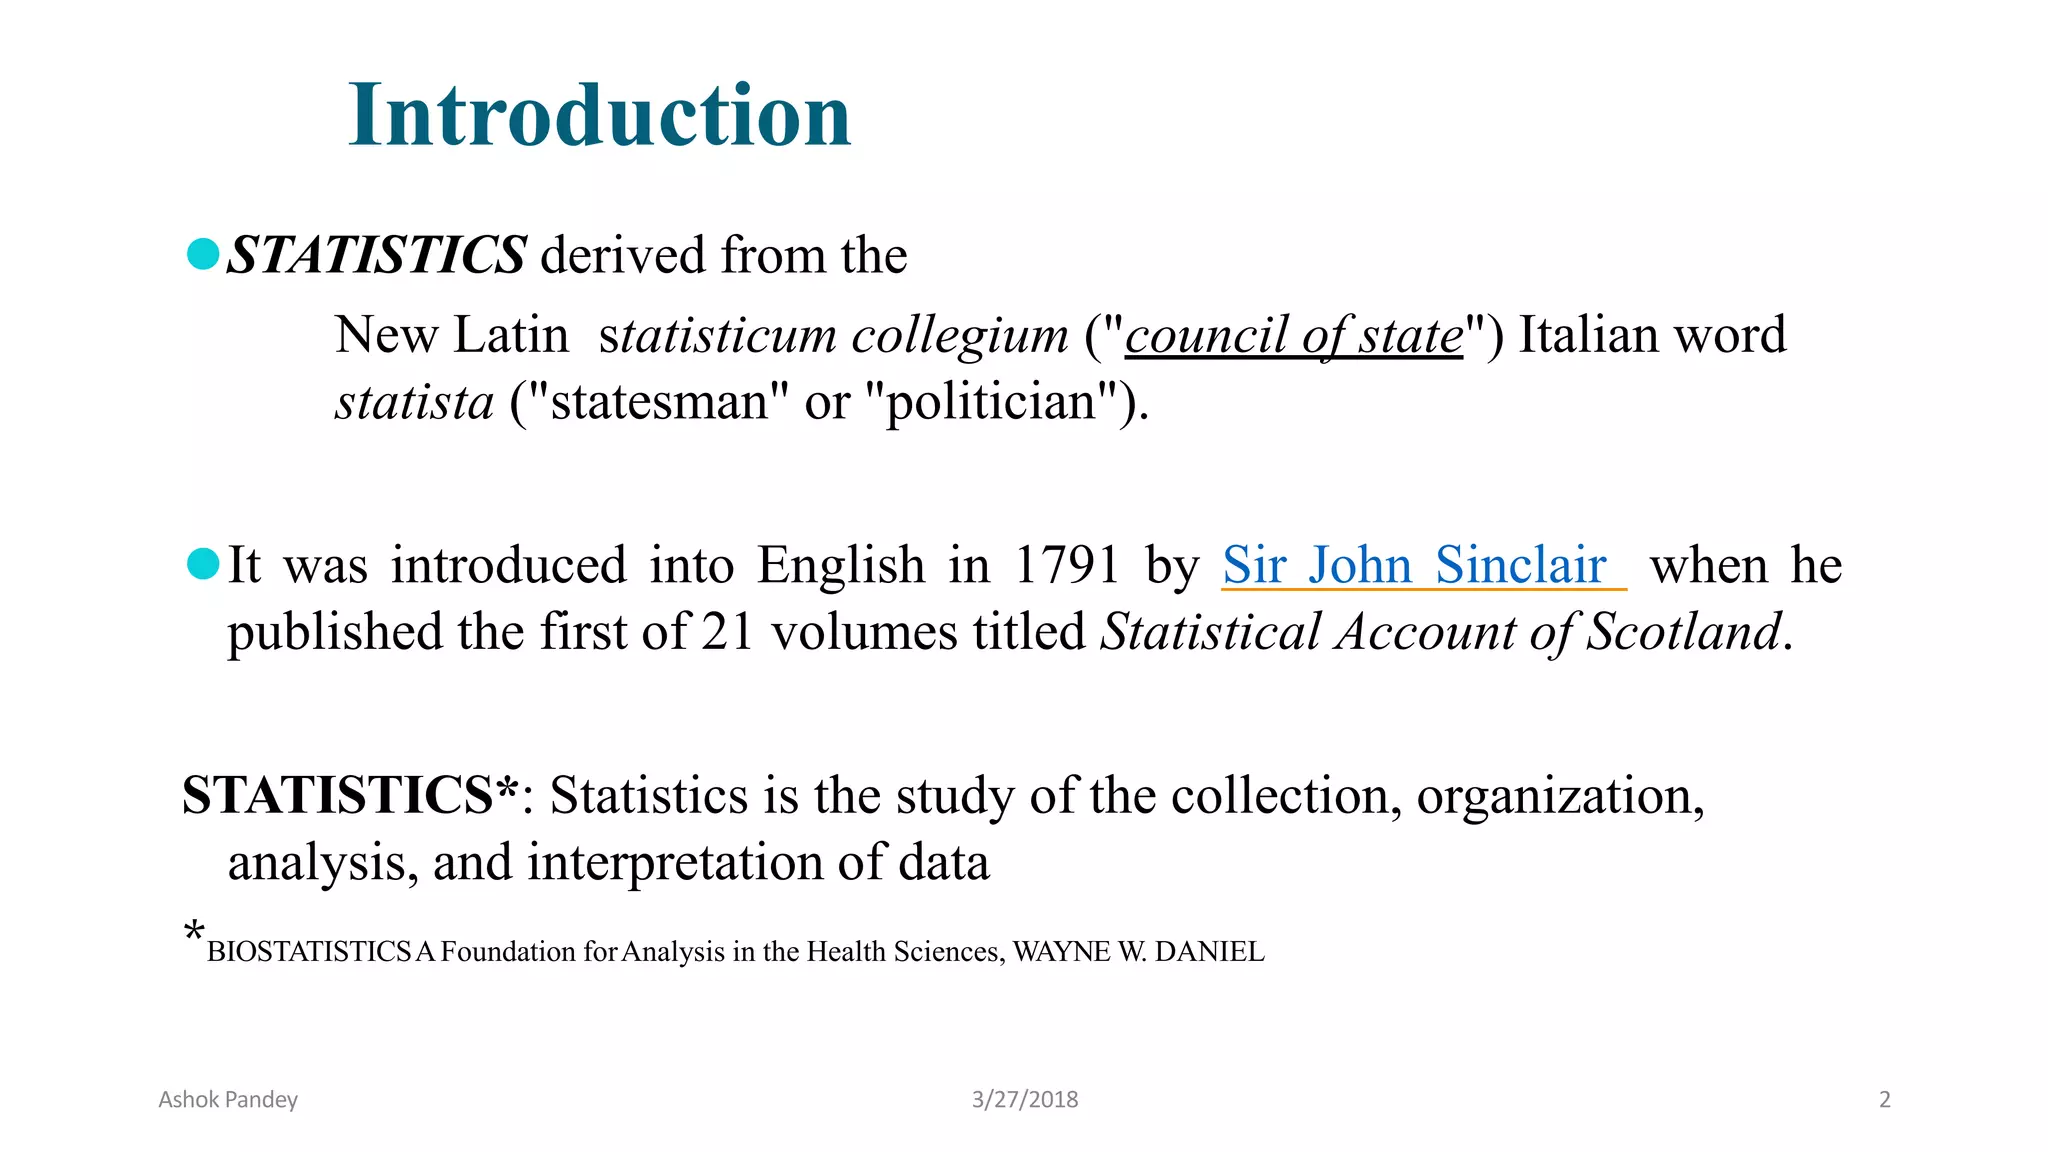
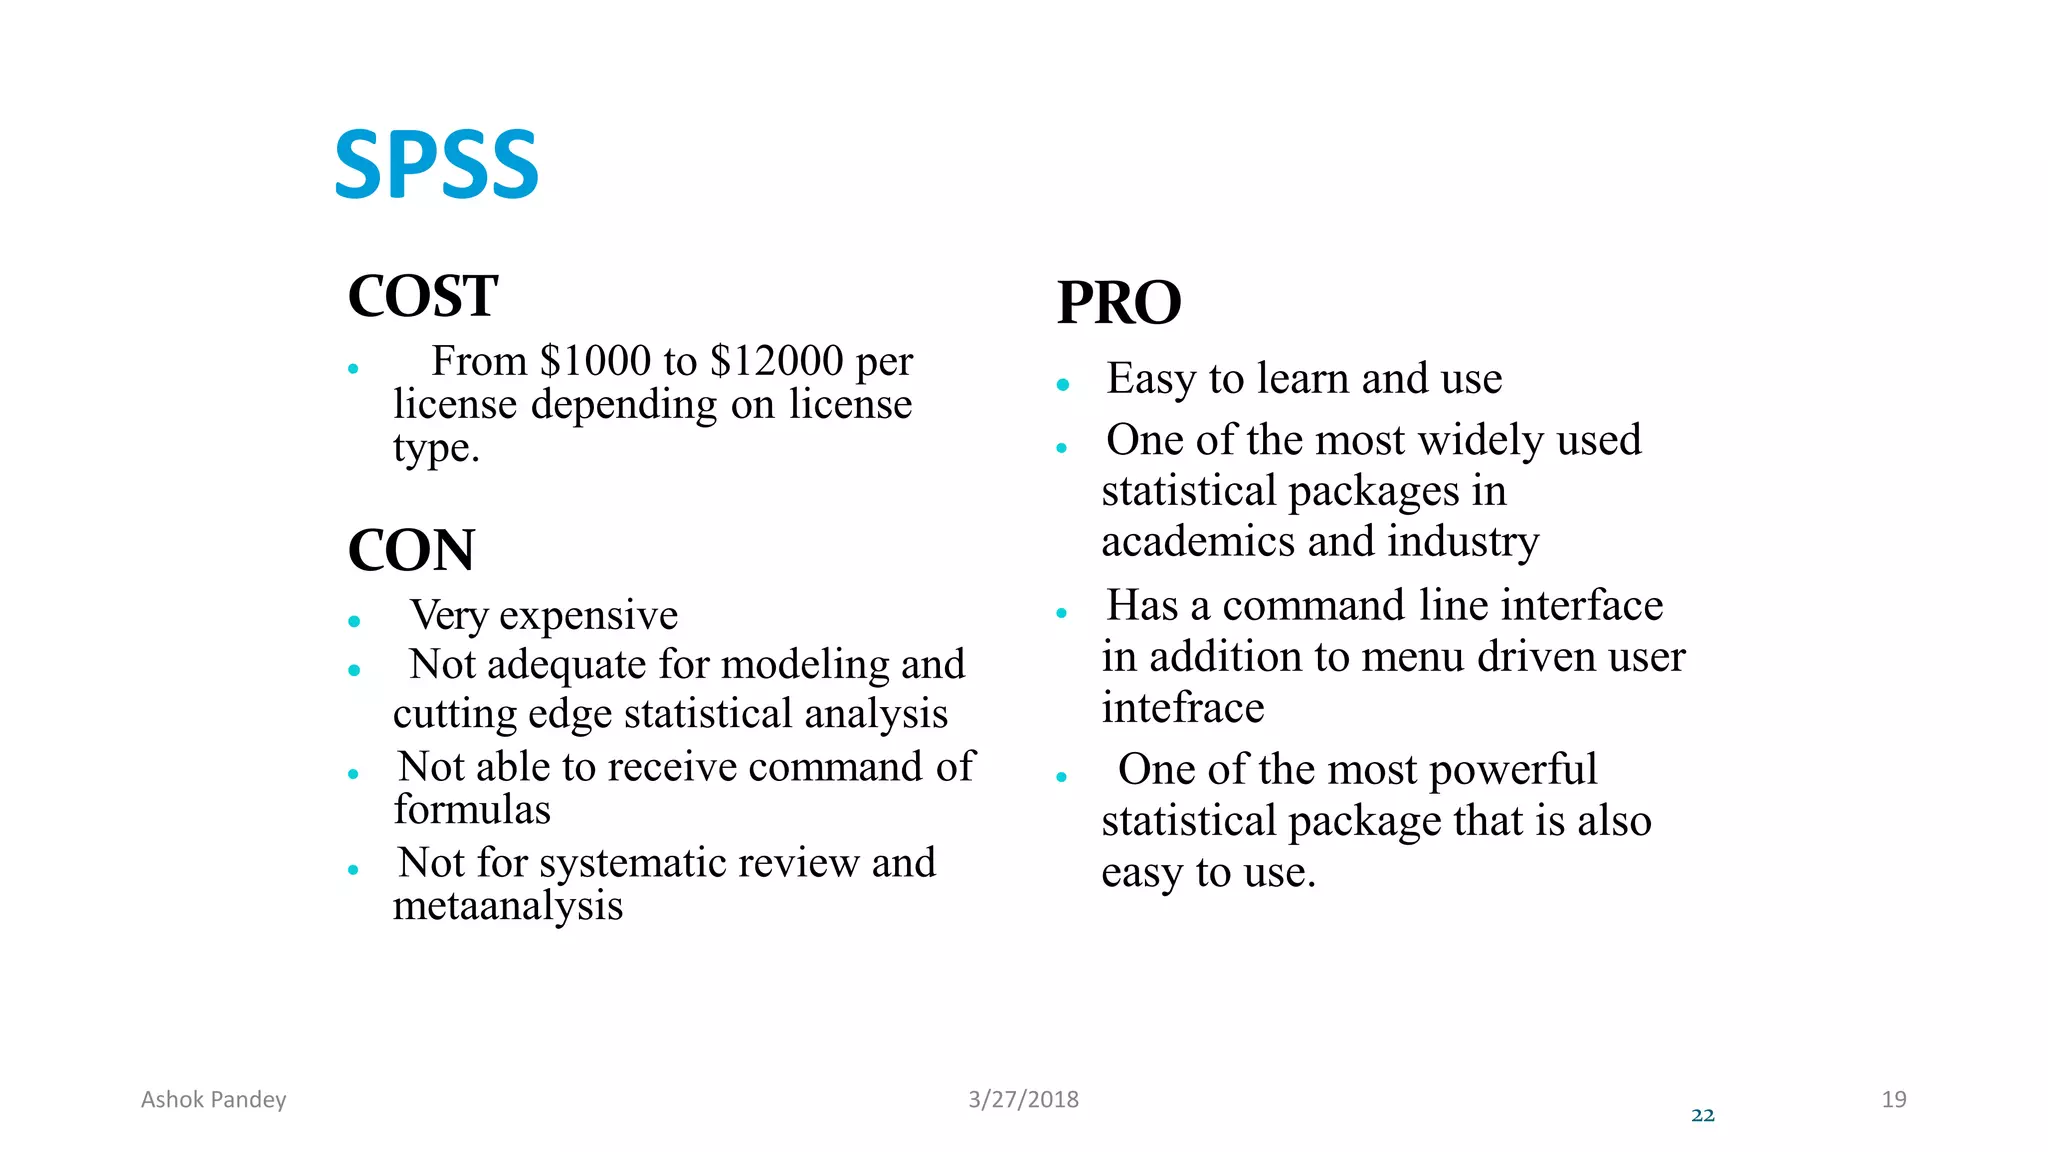
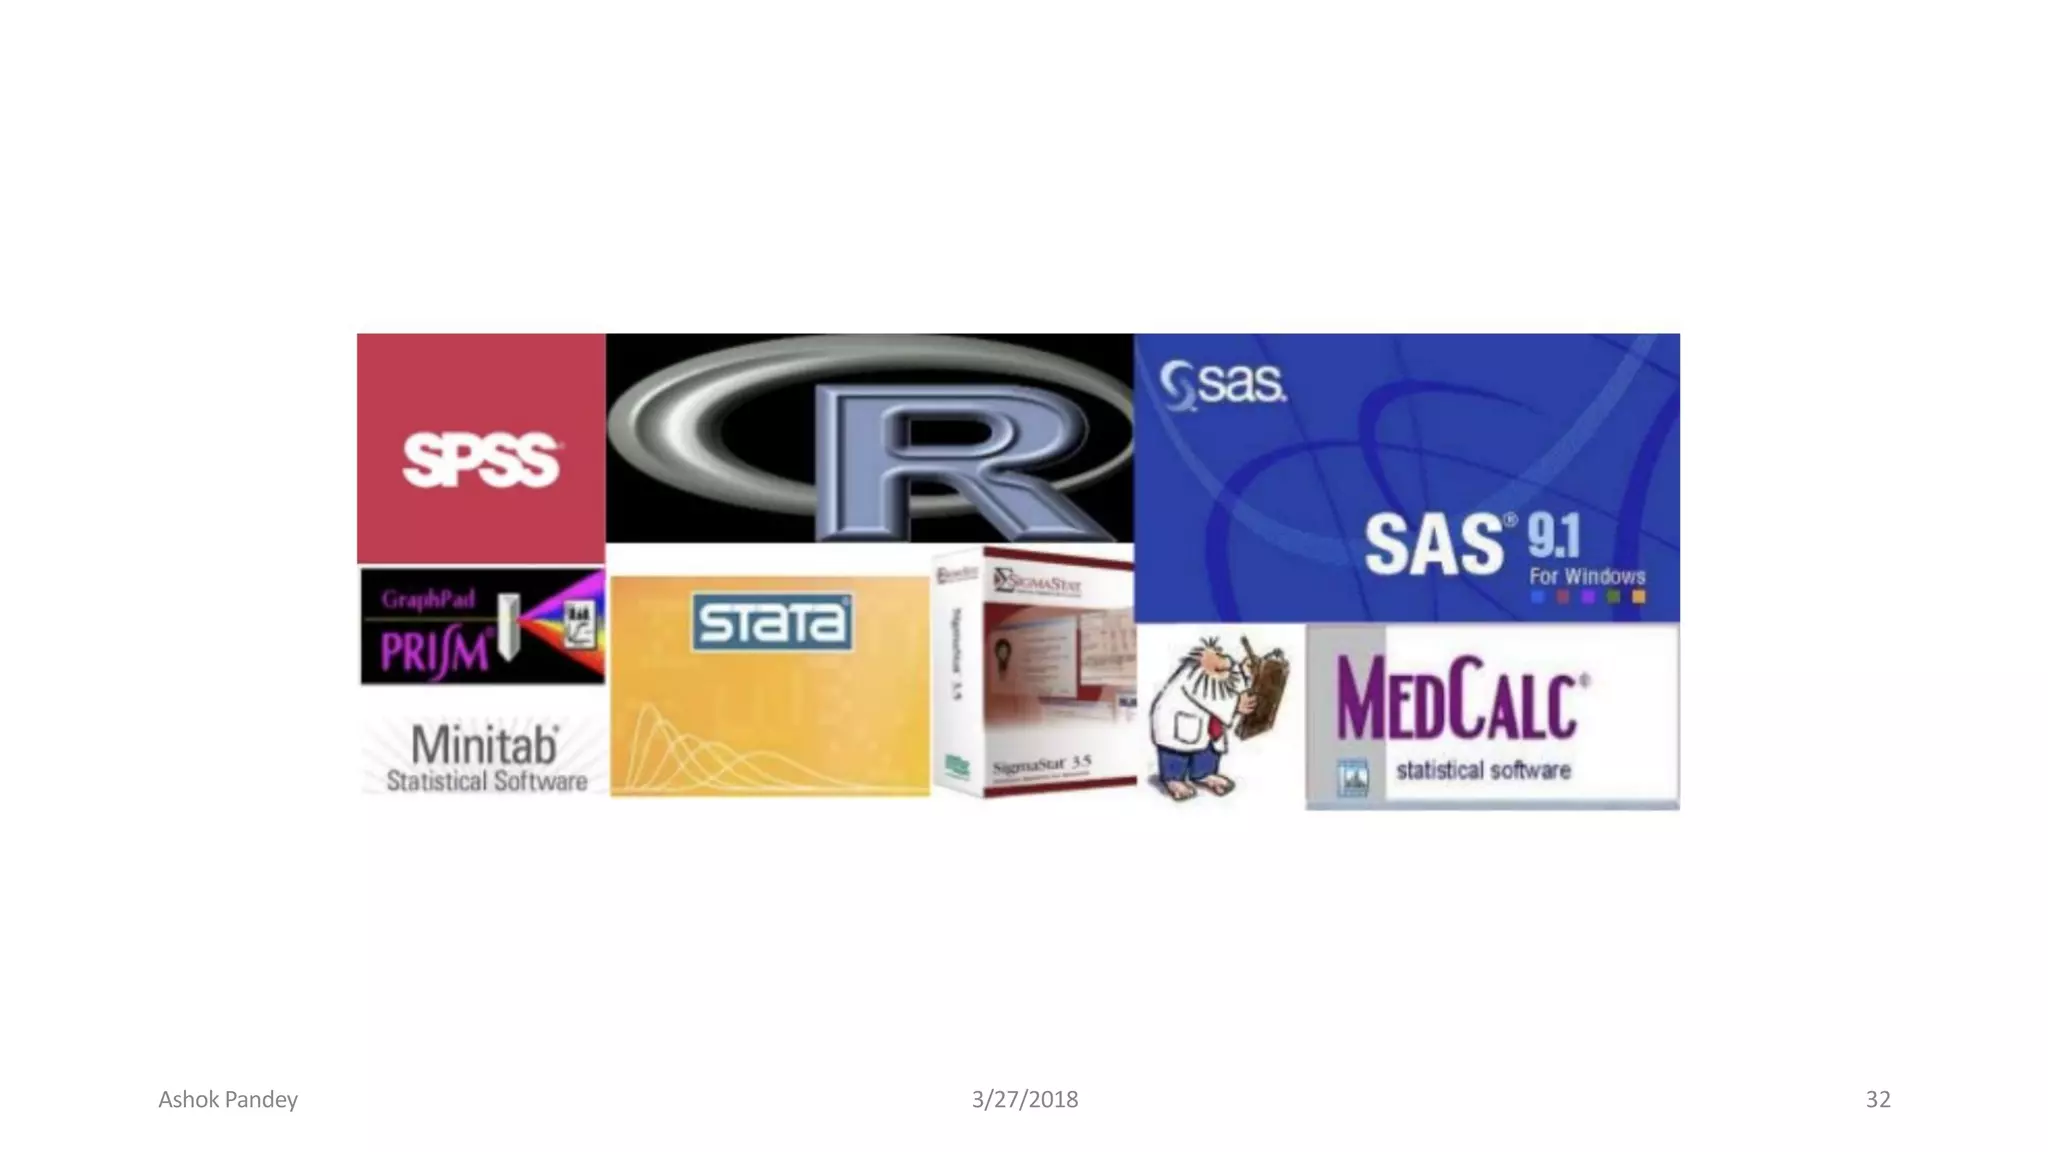
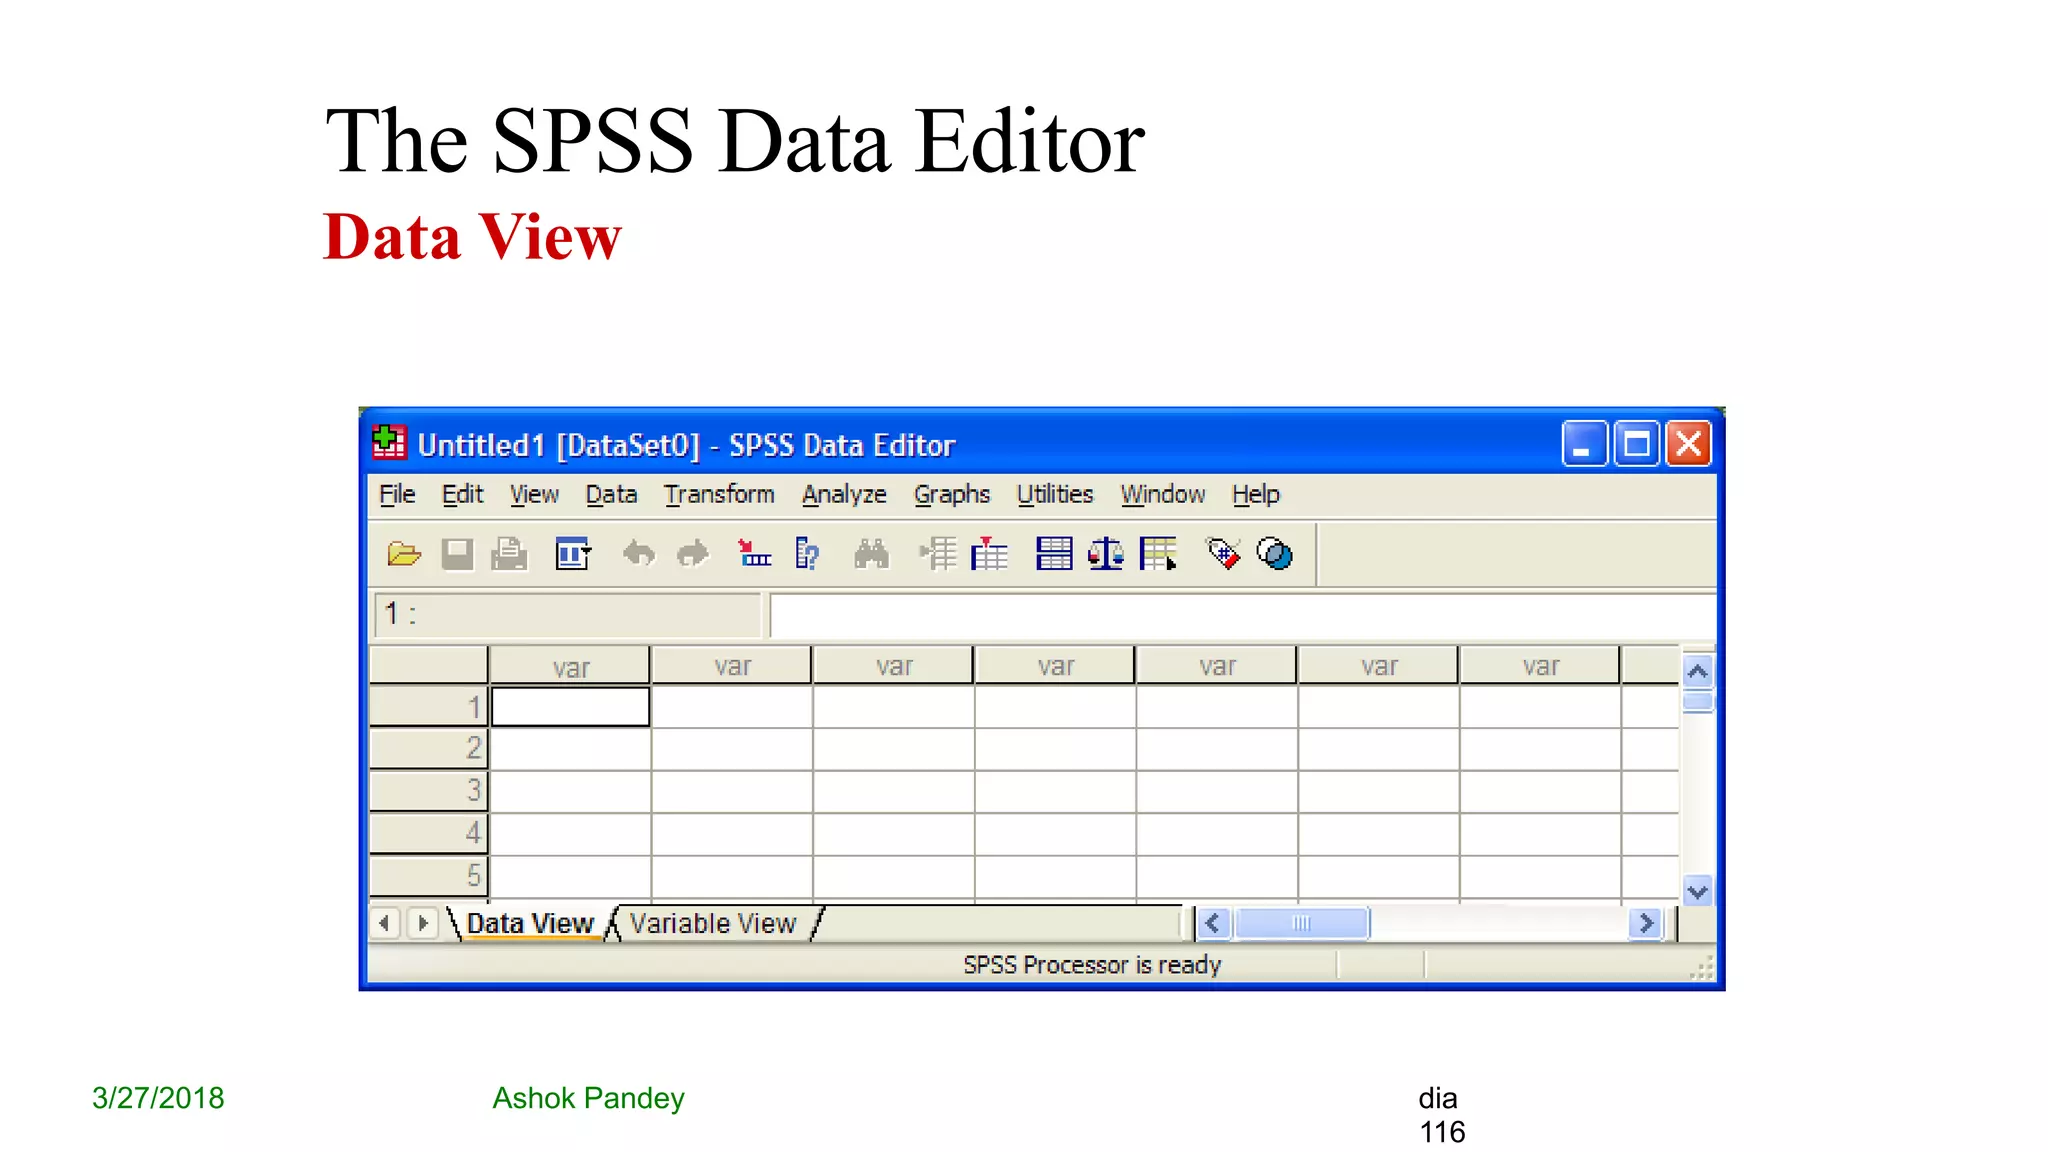
Ashok Pandey 3/27/2018 1
⚫STATISTICS derived from the
New Latin statisticum collegium ("council of state") Italian word
statista ("statesman" or "politician").
⚫It was introduced into English in 1791 by Sir John Sinclair when he
published the first of 21 volumes titled Statistical Account of Scotland.
STATISTICS*: Statistics is the study of the collection, organization,
analysis, and interpretation of data
*BIOSTATISTICSAFoundation forAnalysis in the Health Sciences, WAYNE W. DANIEL
Introduction
Ashok Pandey 3/27/2018 2
A. Preparing for the study
B. Tools
C. Analysis
D. Programmes for specific task
* Abramsons and abramsons
STEPS FOR RESEARCH:
Ashok Pandey 3/27/2018 3
1. Reference Management
2. Sample Size and Power
3. PlanningAclinical Trial
4. Web based survey
A. Preparing for study
Ashok Pandey 3/27/2018 4
⚫1. Reference management:
a) BiblioExpress: store, arrange, sort, format, export reference(
reference manager)
b) Zotero: + automatically captures citations from most of the pages(
Reference manager + information manager).It is an add on to the
free browser FIREFOX, it can be used only if firefox is open.
c) Mendley:
d) MyNCBI:Allow users to save pubmed researches only.
e) Mekentosj papers: large collection of PDF files managed more
easily. only available for Apple macintosh users, no version for
windows.
f) citeUlike
g) Connotea
h) Hubmed
Ashok Pandey 3/27/2018 5
⚫2. Sample Size and Power:
1. Describe
2. Compare2
3. PS
4. PASS
5. Lenth's JavaApplets for power and sample size
6. OpenEpi
7. GPower
8. Power upR
Ashok Pandey 3/27/2018 6
Ashok Pandey 3/27/2018 7
⚫3. Planning a clinical trial: Trial protocol Tool
⚫4. Web surveys: Google forms, Survey forms flash out
while surfing nets, Satisfaction forms after foods at many
restaurants on Tabs.
Ashok Pandey 3/27/2018 8
⚫B. Tools:
1. Randomization - Etcetera, SISA,Gcalc
2. Calculators - Instacalc, Calcr
3. P- value - Whatis, PQRS
4. Spreadsheet- Kyplot, Lamorte
5. Graphs - RJS Graph, SBHisto
6. Epidemic curve - Decsribe
7. Text editor - Crimson editor
Ashok Pandey 3/27/2018 9
⚫C.Analysis: General - by Softwares
⚫D.Anaalysis: Specific Task -
1. Misclassification- Describe( single variable),
Comapre2( unpaired data), Pairsetc( paired data)
2. Assessing a scale- Etcetera( compute Cronbach's alpha)
3. Others
Ashok Pandey 3/27/2018 10
1. To provide the magnitude of any health problem in the
community.
2. To find out the basic factors underlying the ill-health
3. To calculate sample size from large study population while
conducting study/ research in the community.
4. To calculate survival rates of various diseases
5. To examine association between two variables in a given
study.
Applications of software application in public health
Ashok Pandey 3/27/2018 11
6. To study the prevalence and incidence of a disease.
7. To find out odds ratio, relative risk, attributable risk in case-
control and cohort study.
8. To find out normal distribution of a disease or health related
event
9. To test usefulness of sera and vaccines in the field -
percentages of attacks or deaths among the vaccinated
subjects is compared with that among the unvaccinated ones
to find whether the difference observed is statistically
significant.
10. In epidemiological studies-the role of causative factors
is statistically tested.
Ashok Pandey 3/27/2018 12
1. Accuracy and speed :
2. Versality :
3. Graphics:
4. Flexibility:
5. New variables:
6. Volume of data:
7. Easy transfer of data:
Advantages of using a computer software:
Ashok Pandey 3/27/2018 13
Applications of statistical software in medical field :
1. compilation, tabulation and diagrammatic presentation
2. Finding averages, coefficient of variation, standard
deviation and standard error and percentiles
3.The application of tests of significance such as Z,
t, X2 , correlation and regression coefficients
4.Construction of life tables to find longevity of life at birth
and at any age
Ashok Pandey 3/27/2018 14
Commonly used Statistical softwares:
1. EXCEL
2. Epi Info
3. IBM SPSS
4. STATA
5. SAS
6. R Statistical software
Ashok Pandey 3/27/2018 15
Available Statistical Packages
Proprietary
 Excel
 SPSS
 SAS
 STATA
Free Software
 EpiInfo
 R
19
Ashok Pandey 3/27/2018 16
Types of statistical software
window Syntax Window+
syntax
Epi info SAS SPSS
MS Excel R STATA
Ashok Pandey 3/27/2018 17
Microsoft Excel
COST
 Individual License for
Microsoft Office Professional
$350
 Microsoft Office University
Student License: $99
 Volume Discounts available
for large organizations and
universities
 Free Starter Version available
on some new PCs
PRO
CON
 Nearly ubiquitous and is often pre-
installed on new computers
 User friendly
 Very good for basic descriptive
statistics, charts and plots
 Costs money
 Not sufficient for anything beyond
the most basic statistical analysis
21
Ashok Pandey 3/27/2018 18
SPSS
COST
 From $1000 to $12000 per
license depending on license
type.
CON
 Very expensive
 Not adequate for modeling and
cutting edge statistical analysis
 Not able to receive command of
formulas
 Not for systematic review and
metaanalysis
PRO
 Easy to learn and use
 One of the most widely used
statistical packages in
academics and industry
 Has a command line interface
in addition to menu driven user
intefrace
 One of the most powerful
statistical package that is also
easy to use.
22
Ashok Pandey 3/27/2018 19
23
Ashok Pandey 3/27/2018 20
SAS: originally used for management and agriculture
COST
 Complicated pricing model
 $8,500 first year license fee
CON
 Not user friendly
 Steep learning curve
 Relatively poor graphics
capabilities
PRO
 Widely accepted as the leader
in statistical analysis and
modeling
 Widely used in the industry
and academia
 Very flexible and very
powerful.
24
Ashok Pandey 3/27/2018 21
Ashok Pandey 3/27/2018 22
STATA
COST
 Cheaper than SPSS
CON
 Not user friendly
 Steap learning curve
PRO
 Excellent for data
manipulation
 Systematic review and meta
analysis can be done besides
other basic statistical
services
26
Ashok Pandey 3/27/2018 23
Ashok Pandey 3/27/2018 24
EpiInfo
PRO
 Consists of multiple modules to
accomplish various tasks beyond just
statistical analysis.
 ability to rapidly develop a questionnaire
 customize the data entry process
 quickly enter data into that questionnaire
 analyze the data
 rapid assesment of outbreaks
 display geographic map
 clusters and trends of disease can be known
 color shaded map created
COST
 Free
CON
 Not a dedicated
statistical package
 Not as powerful as
commercial alternative
for performing
advanced analysis and
modeling
28
Ashok Pandey 3/27/2018 25
Ashok Pandey 3/27/2018 26
R
• PRO
 Widely used and accepted in
academics
 Very powerful and flexible
 Very large user base
 Lots of books and manuals
 Several User Interface Shells
available
COST
 Free / Open Source
CON
 Not user friendly
 Requires steep learning
curve
30
Ashok Pandey 3/27/2018 27
⚫Freelyavailable
⚫The softwareconsistsof three modules:
1. Anthropometriccalculator
2. Individual assessment
3. Nutritional survey
WHO Anthro (version 3.2.2, January 2011)
Ashok Pandey 3/27/2018 28
47
Ashok Pandey 3/27/2018 29
Free / open source Proprietarysoftwar
Aquad(GPL licence, sinceversion
7) (Windows)
NVivo(Windows; Mac OS
announced for 2014)
ELAN (Java-based forWindows,
Mac OS, Linux)
ATLAS.ti (Windows; Mac OS and
iPad announced)
CATMA 3.2 forWindows, Mac
OS, Linux )
f4analyse( Windows, Mac OS
and Linux)
Statistical software for Qualitative Data analysis
ComputerAssisted/Aided Qualitative Data Analysis Software (CAQDAS)
Ashok Pandey 3/27/2018 30
⚫STATISTICS JOURNALS:
⚫American Review of Mathematis And Statistics
⚫Bayesian Analysis
⚫Electronic Journal for History of Probability and Statistics
⚫Electronic Journal of Statistics
⚫Journal of Modern Applied Statistical Method
⚫Journal of Statistical Software
⚫Journal of Statistics Education
⚫REVSTAT
⚫SORT
⚫Sankhya - The Indian Journal of Statistics
⚫Statistics Education Research Journal
⚫Statistics on the Internet
⚫The R Journal
Ashok Pandey 3/27/2018 31
Ashok Pandey 3/27/2018 32
SPSS - Statistical Package for the
Social Sciences
Ashok Pandey 3/27/2018 33
What is SPSS?
 SPSS is a comprehensive and flexible statistical analysis and
data management solution.
 SPSS is a computer program used for survey authoring and
deployment, data mining, text analytics, statistical analysis, and
collaboration and deployment.
 SPSS can take data from almost any type of file and use them to
generate tabulated reports, charts, and plots of distributions and
trends, descriptive statistics, and conduct complex statistical analyses.
 SPSS is among the most widely used programs for statistical
analysis in social science.
Ashok Pandey 3/27/2018 34
About
Its is developed by Norman H. Nie and C. Hadlai Hull of
IBM Corporation in the year 1968.
It is compatible with Windows, Linux, UNIX & Mac
operating systems.
SPSS is among the most widely used programs
for statistical analysis in social science.
Ashok Pandey 3/27/2018 35
About SPSS Inc.
• SPSS Inc. is a leading worldwide provider of
predictive analytics software and solutions.
• today SPSS has more than 250,000 customers
worldwide, served by more than 1,200 employees in
60 countries.
Ashok Pandey 3/27/2018 36
Used in…
 Telecommunications,
 Banking,
 Finance,
 Insurance,
 Healthcare,
 Manufacturing,
 Retail,
 Consumer packaged goods,
 Higher education,
 Government,
 and Market research.
Ashok Pandey 3/27/2018 37
INSTALLATION OFSPSS16.0
Ashok Pandey 3/27/2018
(STUDENT VERSION)
38
Ashok Pandey 3/27/2018 39
Ashok Pandey 3/27/2018 40
Ashok Pandey 3/27/2018 41
Ashok Pandey 3/27/2018 42
Ashok Pandey 3/27/2018 43
Ashok Pandey 3/27/2018 44
Ashok Pandey 3/27/2018 45
Ashok Pandey 3/27/2018 46
Ashok Pandey 3/27/2018 47
Ashok Pandey 3/27/2018 48
Ashok Pandey 3/27/2018 49
Ashok Pandey 3/27/2018 50
DATA
VIEW
Kiran Suwal 6/2/2018
Ashok Pandey 3/27/2018 51
VARIABLE
VIEW
Kiran Suwal 6/2/2018
Ashok Pandey 3/27/2018 52
OUTPUTNAVIGATOR WINDOW
Ashok Pandey 3/27/2018 53
SYNTAX
6/2/2018
Kiran Suwal
Ashok Pandey 3/27/2018 54
6/2/2018
Kiran Suwal
Ashok Pandey 3/27/2018 55
Ashok Pandey 3/27/2018 56
MISSING VALUES
• set.
• To change this field, click on the Missing Values… button.
• This will open the Define Missing Values: dialog box.
• Enter the appropriate information into the fields.
• When done, click on the Continue button.
Ashok Pandey 3/27/2018
• This field indicates which subset of the data will not be included in the data
57
Ashok Pandey 3/27/2018 58
Features of SPSS
 It is easy to learn and use.
 It includes a full range of data. management
system and editing tools.
 It provides in-depth statistical capabilities.
 It offers complete plotting, reporting and
presentation features.
Ashok Pandey 3/27/2018 59
Getting data into SPSS
 Creating new SPSS data files
 Opening existing SPSS system files
 Importing data from an ASCII file
 Importing data from other file formats
Ashok Pandey 3/27/2018 60
Entering Data
DATA EDITOR
 The data editor offers a simple and efficient
spreadsheet like facility for entering data and
browsing the working data file.
 This window displays the content of the data
file.
 One can create new data files or modify
existing ones.
 One can have only one data file open at a
time.
Ashok Pandey 3/27/2018 61
Cont..
 This editor provides two views of the data,
DATA VIEW
 Displays the actual data values or defined
value labels.
VARIABLE VIEW
 Displays variable definition information,
including defined variable and value labels,
data type, etc..,
Ashok Pandey 3/27/2018 62
Editing Data
PIVOT TABLE EDITOR
 Output can be modified in many ways with
is editor, and can create multidimensional
tables.
Ex:
We can edit text, swap data in rows and
columns
Ashok Pandey 3/27/2018 63
Cont..
TEXT OUTPUT EDITOR
 Text output not displayed in pivot tables
can be modified with the text output editor.
CHART EDITOR
 High-resolution charts and plots can be
modified in chart windows.
Ashok Pandey 3/27/2018 64
Saving Data
 We need to save it and give it a name. The
default extension name for saving files is ‘.sav’
.
 Ex. SSPS.sav
 Also we can able to retrieving already saved
file
Ashok Pandey 3/27/2018 65
Variables
 Variable is a user defined name of Particular
type of data to hold information (such as
income or gender or temperature or dosage).
Array of variable is a collection values of
similar data types.
Ashok Pandey 3/27/2018 66
Variables types
1. Numeric
2. Comma
3. Dot
4. Scientific notation
5. Date
6. Custom currency
7. String
Ashok Pandey 3/27/2018 67
Rules for Variable Names
 Names must begin with a letter.
 Names must not end with a period.
 Names must be no longer than eight
characters.
 Names cannot contain blanks or special
characters.
 Names must be unique.
 Names are not case sensitive. It doesn’t matter
if you call your variable CLIENT, client, or
CliENt. It’s all client to SPSS.
Ashok Pandey 3/27/2018 68
BASIC STEPS IN DATA ANALYSIS
 Get Your Data Into SPSS:
We can open a previously saved SPSS
data file, read a spreadsheet, database ,or
text data file, or enter directly in the data
editor.
 Select a Procedure:
Select a procedure from the menus to
calculate statistics or to create a chart.
Ashok Pandey 3/27/2018 69
Cont..
 Select The Variable For TheAnalysis:
Variables in the data file are displayed in a
dialog box for the procedure.
 Run The Procedure:
Results are displayed in the viewer.
Ashok Pandey 3/27/2018 70
STATISTICALPROCEDURES
 After entering the data set in data editor or
reading an ASCII data file, we are now ready
to analyze it.
The Procedures Available are
 Reports
 Descriptive Statistics
 Custom Tables
 Compare means
 General Linear model (GLM)
Ashok Pandey 3/27/2018 71
 Correlate
 Regression
 Loglinear
 Classify
 Data Reduction
 Scale
 Non parametric tests
 Time Series
 Survival
 Multiple response.
Ashok Pandey 3/27/2018 72
REPORTS
Report is a textual work made with the
specific intention of relaying information or
recounting certain events in a
widely presentable form
DESCRIPTIVE STATISTICS
This provides techniques for summarizing
Data with statistics, charts, and reports.
Ashok Pandey 3/27/2018 73
Cont..
CUSTOM TABLES
 It provides attractive, flexible, displays of
frequency counts, percentages and other
statistics.
COMPARE MEANS
 This provides techniques for testing
differences among two or more means on their
values for other variable.
Ashok Pandey 3/27/2018 74
Cont..
GENERAL LINEAR MODEL (GLM)
 This provides technique for testing
univariate and multivariate analysis-of-
including repeated
variance models
measures.
CORRELATE
 This provides measures of association for two
or more Variable measured at the interval
level.
Ashok Pandey 3/27/2018 75
Cont..
REGRESSION
 This provides a variety of regression
techniques , including Linear, logistic,
nonlinear, weighted, and two-stage least-
squares regression.
LOGLINEAR
 This provides general and hierarchical log-
linear analsis and logit analysis.
Ashok Pandey 3/27/2018 76
Cont..
CLASSIFY
 This provides cluster and discriminant analysis
DATA REDUCTION
 This provides factor analysis, correspondence
analysis, and optional scaling.
Ashok Pandey 3/27/2018 77
Cont..
SCALE
 This provides reliability analysis and
multidimensional scaling.
NON PARAMETRIC TESTS
 This provides non-parametric tests for one
sample, or for two and paired or Independent
sample.
Ashok Pandey 3/27/2018 78
Cont..
TIME SERIES
Provides exponential smoothing, autocorrelated
regression, ARIMA, X11 ARIMA, seasonal decomposition,
spectral analysis, and related techniques.
SURVIVAL
This provides techniques for analyzing the time for some
terminal event to occur, including Kaplan-Meier analysis and
Cox regression.
MULTIPLE RESPONSE:
This provides facilities to define and analyze multiple-
response .
Ashok Pandey 3/27/2018 79
GRAPHS
BAR
 Generate a simple , clustered , or stacked
bar chart of the data.
LINE
 Generate a simple or multiple line chart of
the data.
AREA
 Generate a simple or stacked area chart of
the data.
Ashok Pandey 3/27/2018 80
Ashok Pandey 3/27/2018 81
Ashok Pandey 3/27/2018 82
Ashok Pandey 3/27/2018 83
Cont..
PIE
 Generates a simple pie chart or a
composite bar chart from the data.
BOXPLOT
 Generates box plot showing the median,
outline, and extreme cases of individual
variables.
Ashok Pandey 3/27/2018 84
Ashok Pandey 3/27/2018 85
Ashok Pandey 3/27/2018 86
Cont..
PARETO
Generates Pareto charts, bar charts with a line
superimposed showing the cumulative sum.
CONTROL
Produces the most commonly-used process-
control charts.
Ashok Pandey 3/27/2018 87
Ashok Pandey 3/27/2018 88
Ashok Pandey 3/27/2018 89
Cont..
NORMAL P-P PLOTS
The cumulative proportions of a variable's
distribution against the cumulative proportions of the
normal distribution.
NORMAL Q-Q PLOTS
The quantiles of a variable's distribution against
the quantiles of the normal distribution.
SEQUENCE
Produces a plot of one or more variables by order
in the file, suitable for examining time-series data.
Ashok Pandey 3/27/2018 90
Ashok Pandey 3/27/2018 91
Ashok Pandey 3/27/2018 92
Ashok Pandey 3/27/2018 93
TIME SERIES: AUTOCORRELATIONS
• Calculates and plots the autocorrelation function (ACF) and
partial autocorrelation function of one or more series to any
specified number of lags, displaying the Box-Ljung statistic at each
lag to test the overall hypothesis that the ACF is zero at alllags.
Ashok Pandey 3/27/2018 94
Ashok Pandey 3/27/2018 95
TIME SERIES: CROSS-CORRELATIONS
Calculates and plots the cross-correlation
function of two or more series for positive,
negative, and zero lags.
Ashok Pandey 3/27/2018 96
Ashok Pandey 3/27/2018 97
TIME SERIES: SPECTRAL
• Calculates and plots univariate or bivariate periodograms and
spectral density functions, which express variation in a time series as
the sum of a series of sinusoidal components. It can optionally save
various components ofthe frequency analysis as new series.
Ashok Pandey 3/27/2018 98
Ashok Pandey 3/27/2018 99
Advantages
 SPSS offers a user friendliness that most
packages are only now catching up to.
 It is popular, and though that is certainly not
a reason for choosing a statistical package,
many data sets are easily loaded into it and
other programs can easily import SPSS files.
Ashok Pandey 3/27/2018 100
Disadvantages
 For academic use SPSS lags notably behind SAS, R
and even perhaps others that are on the more
mathematical rather than statistical side for modern
data analysis.
 Its menu offerings are typically the most basic of an
analysis and sometimes lacking even then, and it
makes doing an inappropriate analysis very easy.
 It is expensive, sometimes ridiculously so, and even
when you do buy you're really only leasing, and its
license is definitely not user friendly.
 There are often compatibility issues with prior
Ashok Pandey 3/27/2018 101
Translate the Questionnaire into SPSS
3/27/2018 Ashok Pandey
Questions in the questionnaire are mapped
into
Variables in SPSS
102
Question-response formats
3/27/2018 Ashok Pandey
• Closed-Ended
• Open-Ended with numerical response
• Open-Ended with text response
• Multiple response questions
103
Respons-format :: Closed-Ended (1)
3/27/2018 Ashok Pandey
5.How is your satisfaction with the customer
service of the staff of Suxes?
O Excellent
O Good
O Bad
O Very bad
104
Coding the answers
3/27/2018 Ashok Pandey
1 = Excellent
2 = Good
3 = Bad
4 = Very bad
105
Respons-format :: Closed-Ended (2)
3/27/2018 Ashok Pandey dia
106
11. Please indicate your gender.
O Female
O Male
Codes:
1 = Female
2 = Male
Open-ended with numerical response
3/27/2018 Ashok Pandey dia
107
2.What is your average expenditure in the
restaurant on a weekly basis?
……… euro per week
10.For how many years have you been
registered as a student at Pandion
University?
……… year(s)
Open-ended with text response
3/27/2018 Ashok Pandey dia
108
1. I would like to have the assortment
extended with the following products:
…………………………………………
Processed by
•
•
Coding manually afterwards or
Typing the answers literally (text
variable)
(Auto recode afterwards)
Scale characteristics
3/27/2018
• Description
• Order
• Distance
• Nominal
• Ordinal
• Scale
Ashok Pandey 109
Levels of measurement
3/27/2018 Ashok Pandey
Nominal
• Your course at Pandion
(Marketing, Int. Business and languages, Int.
Business administration, Management and law,
Health studies, Security);
• Smoker or non smoker (yes, no);
• Choice of a supermarket
(A&P, Wal-Mart, Sears, Aldi, other).
110
Levels of measurement
3/27/2018 Ashok Pandey dia
111
Ordinal
In your opinion, would you say the prices at
Wal-Mart are
O Higher than Sears
O About the same as Sears
O Lower than Sears
Levels of measurement
3/27/2018 Ashok Pandey dia
112
Ordinal
What is your age?
O 15–<25
O 25–<40
O 40–<60
O 60–<90
Levels of measurement
3/27/2018 Ashok Pandey dia
113
Ordinal
Statement
Strongly
disagree
Strongly
agree
a. I always look for bargains 1 2 3 4 5
b. I enjoy being outdoors 1 2 3 4 5
c. I love to cook 1 2 3 4 5
Levels of measurement
3/27/2018 Ashok Pandey dia
114
Scale
Please indicate your age.
___ Years
How much do you think a typical purchaser
of a $100,000 term life insurance policy
pays per year for that policy?
$ ____
Coding data and the data code book
3/27/2018 Ashok Pandey dia
115
Questions  Variables
• Name of the variable
• Variable label
• Value labels (data codes)
• Level of measurement (Measure)
The SPSS Data Editor
Data View
3/27/2018 Ashok Pandey dia
116
The SPSS Data Editor
Variable View
3/27/2018 Ashok Pandey dia
117
The SPSS Data Editor
3/27/2018 Ashok Pandey dia
118
Variable view
– Name
– Type (Numeric)
– Label
– Values (= the codes of the answers)
– Measure (= Level of Measurement)
SPSS Menu’s
3/27/2018 Ashok Pandey dia
119
• Analyze
– Frequencies
– Cross tabs
– Tables
SPSS Menu’s
3/27/2018 Ashok Pandey dia
120
• Graphs
– Bar
– Pie
– Histogram
– Line
– Boxplot
SPSS Output
3/27/2018 Ashok Pandey dia
121
• Separate file in Output Viewer
• Inline Editing of Tables
• Chart Editor for Graphs
Don’t forget to save
– Data file
– Output file
File formats
• Basic format is .SAV
• Supports other common formats such as .XLSX, .CSV, .DAT etc
• SPSS syntax file (.SPS) can be used to convert other formats to SPSS
format
Ashok Pandey 3/27/2018 122
Analysis
Ashok Pandey 3/27/2018 123
Ashok Pandey 3/27/2018 124
The Four Windows: Data Editor
● Data Editor
Spreadsheet-like system for defining, entering, editing,
and displaying data. Extension of the saved file will be
“sav.”
Ashok Pandey 3/27/2018 125
The Four Windows: Output Viewer
● Output Viewer
Displays output and errors. Extension of the saved file will
be “spv.”
Ashok Pandey 3/27/2018 126
The Four Windows: Syntax editor
● Syntax Editor
Text editor for syntax composition. Extension of the
saved file will be “sps.”
Ashok Pandey 3/27/2018 127
The Four Windows: Script Window
● Script Window
Provides the opportunity to write full-blown programs,
in a BASIC-like language. Text editor for syntax
composition. Extension of the saved file will be “sbs.”
Ashok Pandey 3/27/2018 128
Ashok Pandey 3/27/2018 129
Opening SPSS
● Start → All Programs → SPSS Inc→ SPSS 16.0 →
SPSS 16.0
Ashok Pandey 3/27/2018 130
Opening SPSS
● The default window will have the data editor
● There are two sheets in the window:
1. Data view 2. Variable view
Ashok Pandey 3/27/2018 131
Data View window
● The Data View window
This sheet is visible when you first open the Data Editor
and this sheet contains the data
● Click on the tab labeled Variable View
Click
Ashok Pandey 3/27/2018 132
Variable View window
● This sheet contains information about the data set that is stored
with the dataset
● Name
● The first character of the variable name must be alphabetic
● Variable names must be unique, and have to be less than 64
characters.
● Spaces are NOT allowed.
Ashok Pandey 3/27/2018 133
Variable View window: Type
● Type
● Click on the ‘type’ box. The two basic types of variables
that you will use are numeric and string. This column
enables you to specify the type of variable.
Ashok Pandey 3/27/2018 134
Variable View window: Width
● Width
● Width allows you to determine the number of
characters SPSS will allow to be entered for the
variable
Ashok Pandey 3/27/2018 135
Variable View window: Decimals
● Decimals
● Number of decimals
● It has to be less than or equal to 16
3.14159265
Ashok Pandey 3/27/2018 136
Variable View window: Label
● Label
● You can specify the details of the variable
● You can write characters with spaces up to 256
characters
Ashok Pandey 3/27/2018 137
Variable View window: Values
● Values
● This is used and to suggest which numbers
represent which categories when the
variable represents a category
Ashok Pandey 3/27/2018 138
Defining the value labels
● Click the cell in the values column as shown below
● For the value, and the label, you can put up to 60
characters.
● After defining the values click add and then click OK.
Click
Ashok Pandey 3/27/2018 139
Practice 1
● How would you put the following information into SPSS?
Value = 1 represents Male and Value = 2 represents Female
N a m e G e n d e r H e i g h t
J A U N I TA 2 5 . 4
S A L LY 2 5 . 3
D O N N A 2 5 . 6
S A B R I N A 2 5 . 7
J O H N 1 5 . 7
M A R K 1 6
E R I C 1 6 . 4
B R U C E 1 5 . 9
Ashok Pandey 3/27/2018 140
Practice 1 (Solution Sample)
Click
Ashok Pandey 3/27/2018 141
Click
Ashok Pandey 3/27/2018 142
Saving the data
● To save the data file you created simply click ‘file’ and
click ‘save as.’ You can save the file in different forms
by clicking “Save as type.”
Click
Ashok Pandey 3/27/2018 143
Sorting the data
● Click ‘Data’ and then click Sort Cases
Ashok Pandey 3/27/2018 144
Sorting the data (cont’d)
● Double Click ‘Name of the students.’ Then click
ok.
Click
Click
Ashok Pandey 3/27/2018 145
Practice 2
● How would you sort the data by the
‘Height’ of students in descending order?
● Answer
● Click data, sort cases, double click ‘height of
students,’ click ‘descending,’ and finally click ok.
Ashok Pandey 3/27/2018 146
Transforming data
● Click ‘Transform’ and then click ‘Compute Variable…’
Ashok Pandey 3/27/2018 147
Transforming data (cont’d)
● Example: Adding a new variable named ‘lnheight’ which is
the natural log of height
● Type in lnheight in the ‘Target Variable’ box. Then type in
‘ln(height)’ in the ‘Numeric Expression’ box. Click OK
Click
Ashok Pandey 3/27/2018 148
Transforming data (cont’d)
● A new variable ‘lnheight’ is added to the table
Ashok Pandey 3/27/2018 149
Practice 3
● Create a new variable named “sqrtheight”
which is the square root of height.
● Answer
Ashok Pandey 3/27/2018 150
Ashok Pandey 3/27/2018 151
The basic analysis of SPSS that
will be introduced in this class
● Frequencies
● This analysis produces frequency tables showing
frequency counts and percentages of the values of
individual variables.
● Descriptives
● This analysis shows the maximum, minimum,
mean, and standard deviation of the variables
● Linear regression analysis
● Linear Regression estimates the coefficients of the
linear equation
Ashok Pandey 3/27/2018 152
Opening the sample data
● Open ‘Employee data.sav’ from the SPSS
● Go to “File,” “Open,” and Click Data
Ashok Pandey 3/27/2018 153
Opening the sample data
● Go to Program Files,” “SPSSInc,” “SPSS16,” and
“Samples” folder.
● Open “Employee Data.sav” file
Ashok Pandey 3/27/2018 154
Frequencies
● Click ‘Analyze,’ ‘Descriptive statistics,’ then
click ‘Frequencies’
Ashok Pandey 3/27/2018 155
Frequencies
● Click gender and put it into the variable box.
● Click ‘Charts.’
● Then click ‘Bar charts’ and click ‘Continue.’
Click Click
Ashok Pandey 3/27/2018 156
Frequencies
● Finally Click OK in the Frequencies box.
Click
Ashok Pandey 3/27/2018 157
Ashok Pandey 3/27/2018 158
Using the Syntax editor
● Click ‘Analyze,’ ‘Descriptive statistics,’ then
click ‘Frequencies.’
● Put ‘Gender’ in the Variable(s) box.
● Then click ‘Charts,’ ‘Bar charts,’ and click
‘Continue.’
● Click ‘Paste.’
Click
Ashok Pandey 3/27/2018 159
Using the Syntax editor
● Highlight the commands in the Syntax editor
and then click the run icon.
● You can do the same thing by right clicking the
highlighted area and then by clicking ‘Run
Current’
Click
Right
Click!
Ashok Pandey 3/27/2018 160
Practice 4
●Do a frequency analysis on the
variable “minority”
● Create pie charts for it
●Do the same analysis using the
syntax editor
Ashok Pandey 3/27/2018 161
Ashok Pandey 3/27/2018 162
Answer
Click
Ashok Pandey 3/27/2018 163
Descriptives
● Click ‘Analyze,’ ‘Descriptive statistics,’ then
click ‘Descriptives…’
● Click ‘Educational level’ and ‘Beginning
Salary,’ and put it into the variable box.
● Click Options
Click
Ashok Pandey 3/27/2018 164
Descriptives
● The options allows you to analyze other
descriptive statistics besides the mean and Std.
● Click ‘variance’ and ‘kurtosis’
● Finally click ‘Continue’
Click
Click
Ashok Pandey 3/27/2018 165
Descriptives
● Finally Click OK in the Descriptives box. You will
be able to see the result of the analysis.
Ashok Pandey 3/27/2018 166
Regression Analysis
● Click ‘Analyze,’ ‘Regression,’ then click
‘Linear’ from the main menu.
Ashok Pandey 3/27/2018 167
Regression Analysis
● For example let’s analyze the model
● Put ‘Beginning Salary’ as Dependent and ‘Educational Level’ as
Independent.
salbegin  0  1edu 
Click
Click
Ashok Pandey 3/27/2018 168
Regression Analysis
● Clicking OK gives the result
Ashok Pandey 3/27/2018 169
Plotting the regression line
● Click ‘Graphs,’ ‘Legacy Dialogs,’
‘Interactive,’ and ‘Scatterplot’ from the
main menu.
Ashok Pandey 3/27/2018 170
Plotting the regression line
● Drag ‘Current Salary’ into the vertical axis box and ‘Beginning Salary’ in the
horizontal axis box.
● Click ‘Fit’ bar. Make sure the Method is regression in the Fit box. Then
click ‘OK’.
Click
Set this to
Regression!
Ashok Pandey 3/27/2018 171
Ashok Pandey 3/27/2018 172
Pra
● c
Fit
nidc
oe
ut w
5
hether or not the previous experience of
workers has any affect on their beginning salary?
● Take the variable “salbegin,” and “prevexp” as
dependent and independent variables
respectively.
● Plot the regression line for the above analysis
using the “scatter plot” menu.
Ashok Pandey 3/27/2018 173
Answer
Click
Ashok Pandey 3/27/2018 174
Ashok Pandey 3/27/2018 175
Click on the “fit” tab to make
sure the method is regression
Ashok Pandey 3/27/2018 176
Ashok Pandey 3/27/2018 177
Thank You. . .
Ashok Pandey 3/27/2018 178
HOW TO CREATE
“QES, REC AND
CHECK” FILE
IN
EPI-DATA
Ashok Pandey 3/27/2018 179
Step 1. CREATE “QES” file
A. Create new folder in your computer so that all epi-data
documents you are going to create are put together.
B. Open EPI-DATA software
C. Click on “Define data” from epi-data window
3/27/2018 Ashok Pandey 1
8
0
180
QES…CON’T…
3/27/2018 Ashok Pandey 1
8
1
D. Select “New .QES file” from Define data options
E.Start by writing your project name in “New. QES file”
window
F.Type “ variable name” first , followed by “Field label” then “Define
type of variable”
181
Variable name and field label
The first word you type are considered as “variable name”
Then the list of full meaning of your variable name are
“field label”
Eg. IDNo ----- (variable name)
Ashok Pandey 3/27/2018 182
Define type of variable
Using “field pick list” menu from epi-data we can decide
weather our variable are
1. Numeric
2. Text
3. Date
5
Ashok Pandey 3/27/2018 183
To make “ID number” to be assigned automatically
3/27/2018 Ashok Pandey 18
4
• From “Field pick list” menu select “Other” then select “Auto ID
number”, put the number of field length (1,2,3…) then click
“Insert”
To insert date type of variable
3/27/2018 Ashok Pandey 18
5
From “Field pick list menu” click on “Date” , select the
date formats you want to use then click “Insert”.
1. DD/MM/YYYY--- 12/03/2018 ---Standard date format
2. MM/DD/YYYY---03/12/2018
3. YYYY/MM/DD ---2018/03/12
Numeric type of variable
3/27/2018 Ashok Pandey 18
6
and Date
• We use it for variables {other than ID ,Text
variables} which we insert our data using NUMBER .
• Eg 1 = Yes (for “Yes” response we insert “1”)
2 = No (For “No” type response we insert “2”)
Create numeric type of variable using two ways
3/27/2018 Ashok Pandey 18
7
1. Using “FIELD PICK LIST” MENU from epi data window
 From “Field pick list menu” click on “Numeric” then decide the number of
digits before and after decimal points.
Eg. If we want no digits after decimal points we make digits after decimal
points as= “0”
CON’T…
3/27/2018 Ashok Pandey 18
8
And we make before decimal points based on our interest,
(that is based on our sample size).
For example----- if our sample size is 100, we make it 3. i.e field
length is 3 (# # #), for 50 sample, we make it as “2”, i.e the field
length is 2 (# #).
Second method to define Numeric type of variables
3/27/2018 Ashok Pandey 18
9
2. Using short cuts
Click shift+# on your computer
E.g for 200 we type as (shift 3x i.e ###)
After finish “QES”file “align fields”
3/27/2018 Ashok Pandey 19
0
• To make our data entry form more attractive need to align
fields
• Select “EDIT” Menu from epi-data, click “Align fields”
N.B. first click on the variable with long variable label.
Step 2. CREATE “REC” FILE
3/27/2018 Ashok Pandey 19
1
First save our “QES file” on the folder we create before and
label it.
Second click “Make data file” at epi-data menu, then select “Make
data file”
Step 3. Create “CHECK FILE”
In this part we Set rules and commands for our data
1. Define range and legal values for continuous type
of variables (e.g. age, income…). message.
14
Ashok Pandey 3/27/2018 192
CHECK…CON’T…
3/27/2018 Ashok Pandey 19
3
2. Set “MUST ENTER & REPEAT” commands
We will not pass any fields without entering data if we set “Must
enter commands”
193
CHECK…CON’T…
3/27/2018 Ashok Pandey 19
4
3. “SHOW” & “TYPE COMMENT” COMMANDS
This commands help us during data entry by showing us list of
responses to chose among the lists and type entered response for
each respondents.
194
CHECK…CON’T…
4. Define variable labels for “categorical type of variables” (1=male,
2= Female). N.B. IF the categorical variable is made of two words it
must put under double quotation.
e.g. marital status---1. “never married”--- Two words
Ashok Pandey 3/27/2018 195
Cont’d…
• 5. Set “SKIP” Commands (IF the answer for question “A” is “No” then
skip question number “B” and go to question number “C”).
Select the question where this commands setted, then Click on
“edit” in check file, then click enter and type the followings :-
AFTER ENTRY
•IF A <> 1
THEN
GOTO C
• ENDIF
Ashok Pandey 3/27/2018 196
Step 4. EXPORT “EPI-DATA” FILE TO SPSS
3/27/2018 Ashok Pandey 19
7
 Open your epi-data file, select “Export data” from epi-data window, select
SPSS, click ok
 Second select and open spss data file from folder where your epidata qes ,rec
and check files found together under the same folder.
 Third from opened spss window click on “RUN” and select “run all”
 Fourth save the new exported spss data.
197
THANK YOU ALL
3/27/2018 Ashok Pandey 19
8
198
Introduction to Endnote
What is Endnote?
Create and manages reference lists.
Enables searching of reference "libraries" by author, keyword, date,
etc.
In Word documents, automatically formats the references in APA
format for you.
Many online databases allow references to be sent directly into
Endnote.
Can also store and organise images, graphs, tables, etc.
Entering References:
Three ways:
(a) Manually type them in.
(b) Save files from online search facilities.
(c) Search online databases through Endnote and retrieve
the references directly to your Endnote library
Manually Entering References (1)
(a) To start a
new Endnote
library,
click on "file",
then "new"
(b) This box
appears -
enter a
filename for
your new
library
Manually Entering References (2)
Your new
reference library
(empty at the
moment...)
Manually Entering References (3)
To enter a
reference, go
to "New
Reference"
Manually Entering References (4)
Enter details of the
reference in the
relevant "fields"
(Optional how
many you use).
Select which
type of
reference you
want (journal,
book, comic,
etc.)
Manually Entering References (5)
Manually Entering References (6)
Click on "Close
Reference" to finish
entering this
particular reference.
Click on "New
Reference" to add
another reference.
A completed reference library:
Searching a reference library:
Information about References:
Each Reference:
Stores all the information needed to cite it in a reference list
(e.g. in a lab report or essay).
Within a library, each reference has a unique record number
which cannot be changed.
The fields (author, year etc) can be modified, deleted or new
ones added.
There are many reference types (book, journal article, newpaper
article, chart, equation, etc...)
Downloading references from the Web of Knowledge:
1. Go to library website and select "online resources":
2. Scroll down to "Web of Knowledge":
3. Click on "Web of Knowledge":
4. Click on "Web of Science":
4. Perform your search:
5. Tick the references you want to retain.
6. Click on "Save to Endnote...".
References are exported to your chosen Endnote library:
NB: shows only the new references (click on "Show all
references" to see earlier entries).
Downloading citations from ScienceDirect:
1. Go to library website, click on ScienceDirect:
2. Perform your search, then click on "export citations":
3. Pick "citations only" or "citations and abstracts":
5. Entries are added to the chosen Endnote library (this
time, with abstracts as well):
Using Endnote with Word
Endnote adds an extra menu within Microsoft Word:
Referencing conventions:
In essays and lab-reports, all cited work must be properly
referenced, by a reference in the text (author surname and date of
publication), and an entry in a reference list that contains complete
details of each reference:
In the text: "Field and Hole (2003) give lots of useful advice". Or
"Learning statistics has been shown to be easier than people think
(Field and Hole, 2003)".
In the reference list: Field, A. and Hole, G. (2003). How to design and
report experiments. London: Sage.
Problem is that the conventions for this differ slightly between
journals (although most use "A.P.A. format").
Start Word and open the document you are writing.
To cite a source, position the cursor where you want the reference to
appear, then click on "Insert Selected Citation":
Inserting references in the text:
Endnote
(a) adds the reference in the text;
(b) adds the full reference to a reference list at the end of the
document
- correctly-formated and in alphabetical order!
This is a load of rubbish I'm writing in order to show you how to use "Endnote"
(Duck and Mouse 2007). Here's some more tosh that I've just typed (Sooty and
Sweep 2007), and yet more (Lala, Tinky-winky et al. 2007).
Duck, D. and M. Mouse (2007). "Our living hell: life as prisoners in Disneyland."
Animal Behaviour 29(5): 179-199.
Lala, Tinky-winky, et al. (2007). "Effects of the media on body-image in telly-
tubbies." Journal of banal research 99: 201-203.
Sooty and Sweep (2007). Hands up: we don't have a leg to stand on. Congleton,
Garbage Books Inc.
Formatting the Bibliography:
You can format the references in different styles by choosing
‘Format Bibliography’ from the Endnote menu.
Use "APA 5th" as your output style
More Information, and how to get Endnote:
Endnote is installed on all campus PC's.
For your own computer, you need to purchase a copy.
See the Sussex University IT centre's website:
wants to help researchers
organize, share, and discover
research papers.
Mendeley
 What is Mendeley?
 Creating your library
 Managing your documents & references
 Citing and sharing references
Based in London, Mendeley are 15 researchers, graduates and
software developers from...
...backed by co-founders and
former executives of:
research libraries
researchers papers
disciplines
music libraries
artists
songs
genres
Last.fm
Mendeley
What is Mendeley?
Mendeley is free academic software
(Win, Mac & Linux) to manage, share,
read, annotate and cite your research
papers...
...and a research network to manage
your papers online, discover research
trends and statistics, and to connect to
like-minded researchers.
What is Mendeley?
Set up and manage your collections
Add tags & notes and edit document details
Library showing all your documents (citation or table view)
Filter your papers by authors,
keywords, tags, or publications
Creating your library
Adding your papers
You have different options to set up your library:
• Add single files or an entire folder
• “Watch a folder” to automatically import PDF files
• Add existing EndNote/BibTeX/RIS databases, or…
…drag & drop PDF files into the library pane…
… and Mendeley will try to extract the
document details automatically
Document details lookup
You can also try to complete the document
details by querying various databases
(Crossref, PubMed, ArXiv or Google Scholar)
Enter the DOI, PubMed, or ArXiv ID and
click on the magnifier glass to start lookup
And remember – made a mistake?
Press CTRL+Z (or Edit > Undo)
to undo the last step
Web Importer
To install the Web Importer,
drag & drop the bookmarklet to
your Favorites/Bookmarks
in your internet browser
Supported sites
www.mendeley.com/import
The Web Importer helps you to
grab citations off the web
Using the Web Importer
On the web page with
the reference(s) you
want to capture: click on
the bookmarklet…
…then click on “Import” to import
the reference/paper to your
Mendeley library. If
possible/available, also the
associated PDF will be imported.
Synchronize and manage your library online
Synchronize
your library
You can also add
references and
edit & manage your
library online
In addition, you will get statistics
about your library, your impact
and your research field (see later)
Manage your library
Star your favorite papers
Documents can be marked read/unread
Filter by authors, tags, publications or keywords
Open attached PDF files in integrated viewer
Search as you type
Full text search in Mendeley’s PDF viewer
Annotate and highlight
Mendeley‘s File Organizer
Mendeley can also organize
your PDF files in a consistent
folder structure on your hard
disk and rename them
according to their document
details
You can find the File Organizer in
Tools > Options > File Organizer
Citing and sharing references
Citing in Word & Open Office
Click on “Insert Citation” in Word
Highlight the paper you want to cite
Citing in Word & Open Office
“Send citation” to Word
Citation will show up based on selected style
Cite into Google documents
or other editors by copy & paste
Creating bibliographies
Insert a bibliography based on the citations
Public Collections (“Reading Lists”)
You can make a collection public in “Edit Settings”
View the collection online –
other users can subscribe via
clicking on “Subscribe” on
the collection page.
A Public Collection acts like a “Reading List” –
you can add references to the collection, and
users who have subscribed to this collection will
get the references pushed into their Mendeley
account. PDFs are not attached.
Shared Collections
A shared collection allows a
research group to create a private,
shared library and to
collaboratively edit and annotate
documents and references.
Only the members of this
collection can see it online
Create your professional research profile
Discover research statistics
What is your impact?
Leave feedback and see what’s coming next
Visit http://feedback.mendeley.com
to see what others are saying, leave
feedback, request features or report bugs

Spss and software Application

  • 1.
  • 2.
    ⚫STATISTICS derived fromthe New Latin statisticum collegium ("council of state") Italian word statista ("statesman" or "politician"). ⚫It was introduced into English in 1791 by Sir John Sinclair when he published the first of 21 volumes titled Statistical Account of Scotland. STATISTICS*: Statistics is the study of the collection, organization, analysis, and interpretation of data *BIOSTATISTICSAFoundation forAnalysis in the Health Sciences, WAYNE W. DANIEL Introduction Ashok Pandey 3/27/2018 2
  • 3.
    A. Preparing forthe study B. Tools C. Analysis D. Programmes for specific task * Abramsons and abramsons STEPS FOR RESEARCH: Ashok Pandey 3/27/2018 3
  • 4.
    1. Reference Management 2.Sample Size and Power 3. PlanningAclinical Trial 4. Web based survey A. Preparing for study Ashok Pandey 3/27/2018 4
  • 5.
    ⚫1. Reference management: a)BiblioExpress: store, arrange, sort, format, export reference( reference manager) b) Zotero: + automatically captures citations from most of the pages( Reference manager + information manager).It is an add on to the free browser FIREFOX, it can be used only if firefox is open. c) Mendley: d) MyNCBI:Allow users to save pubmed researches only. e) Mekentosj papers: large collection of PDF files managed more easily. only available for Apple macintosh users, no version for windows. f) citeUlike g) Connotea h) Hubmed Ashok Pandey 3/27/2018 5
  • 6.
    ⚫2. Sample Sizeand Power: 1. Describe 2. Compare2 3. PS 4. PASS 5. Lenth's JavaApplets for power and sample size 6. OpenEpi 7. GPower 8. Power upR Ashok Pandey 3/27/2018 6
  • 7.
  • 8.
    ⚫3. Planning aclinical trial: Trial protocol Tool ⚫4. Web surveys: Google forms, Survey forms flash out while surfing nets, Satisfaction forms after foods at many restaurants on Tabs. Ashok Pandey 3/27/2018 8
  • 9.
    ⚫B. Tools: 1. Randomization- Etcetera, SISA,Gcalc 2. Calculators - Instacalc, Calcr 3. P- value - Whatis, PQRS 4. Spreadsheet- Kyplot, Lamorte 5. Graphs - RJS Graph, SBHisto 6. Epidemic curve - Decsribe 7. Text editor - Crimson editor Ashok Pandey 3/27/2018 9
  • 10.
    ⚫C.Analysis: General -by Softwares ⚫D.Anaalysis: Specific Task - 1. Misclassification- Describe( single variable), Comapre2( unpaired data), Pairsetc( paired data) 2. Assessing a scale- Etcetera( compute Cronbach's alpha) 3. Others Ashok Pandey 3/27/2018 10
  • 11.
    1. To providethe magnitude of any health problem in the community. 2. To find out the basic factors underlying the ill-health 3. To calculate sample size from large study population while conducting study/ research in the community. 4. To calculate survival rates of various diseases 5. To examine association between two variables in a given study. Applications of software application in public health Ashok Pandey 3/27/2018 11
  • 12.
    6. To studythe prevalence and incidence of a disease. 7. To find out odds ratio, relative risk, attributable risk in case- control and cohort study. 8. To find out normal distribution of a disease or health related event 9. To test usefulness of sera and vaccines in the field - percentages of attacks or deaths among the vaccinated subjects is compared with that among the unvaccinated ones to find whether the difference observed is statistically significant. 10. In epidemiological studies-the role of causative factors is statistically tested. Ashok Pandey 3/27/2018 12
  • 13.
    1. Accuracy andspeed : 2. Versality : 3. Graphics: 4. Flexibility: 5. New variables: 6. Volume of data: 7. Easy transfer of data: Advantages of using a computer software: Ashok Pandey 3/27/2018 13
  • 14.
    Applications of statisticalsoftware in medical field : 1. compilation, tabulation and diagrammatic presentation 2. Finding averages, coefficient of variation, standard deviation and standard error and percentiles 3.The application of tests of significance such as Z, t, X2 , correlation and regression coefficients 4.Construction of life tables to find longevity of life at birth and at any age Ashok Pandey 3/27/2018 14
  • 15.
    Commonly used Statisticalsoftwares: 1. EXCEL 2. Epi Info 3. IBM SPSS 4. STATA 5. SAS 6. R Statistical software Ashok Pandey 3/27/2018 15
  • 16.
    Available Statistical Packages Proprietary Excel  SPSS  SAS  STATA Free Software  EpiInfo  R 19 Ashok Pandey 3/27/2018 16
  • 17.
    Types of statisticalsoftware window Syntax Window+ syntax Epi info SAS SPSS MS Excel R STATA Ashok Pandey 3/27/2018 17
  • 18.
    Microsoft Excel COST  IndividualLicense for Microsoft Office Professional $350  Microsoft Office University Student License: $99  Volume Discounts available for large organizations and universities  Free Starter Version available on some new PCs PRO CON  Nearly ubiquitous and is often pre- installed on new computers  User friendly  Very good for basic descriptive statistics, charts and plots  Costs money  Not sufficient for anything beyond the most basic statistical analysis 21 Ashok Pandey 3/27/2018 18
  • 19.
    SPSS COST  From $1000to $12000 per license depending on license type. CON  Very expensive  Not adequate for modeling and cutting edge statistical analysis  Not able to receive command of formulas  Not for systematic review and metaanalysis PRO  Easy to learn and use  One of the most widely used statistical packages in academics and industry  Has a command line interface in addition to menu driven user intefrace  One of the most powerful statistical package that is also easy to use. 22 Ashok Pandey 3/27/2018 19
  • 20.
  • 21.
    SAS: originally usedfor management and agriculture COST  Complicated pricing model  $8,500 first year license fee CON  Not user friendly  Steep learning curve  Relatively poor graphics capabilities PRO  Widely accepted as the leader in statistical analysis and modeling  Widely used in the industry and academia  Very flexible and very powerful. 24 Ashok Pandey 3/27/2018 21
  • 22.
  • 23.
    STATA COST  Cheaper thanSPSS CON  Not user friendly  Steap learning curve PRO  Excellent for data manipulation  Systematic review and meta analysis can be done besides other basic statistical services 26 Ashok Pandey 3/27/2018 23
  • 24.
  • 25.
    EpiInfo PRO  Consists ofmultiple modules to accomplish various tasks beyond just statistical analysis.  ability to rapidly develop a questionnaire  customize the data entry process  quickly enter data into that questionnaire  analyze the data  rapid assesment of outbreaks  display geographic map  clusters and trends of disease can be known  color shaded map created COST  Free CON  Not a dedicated statistical package  Not as powerful as commercial alternative for performing advanced analysis and modeling 28 Ashok Pandey 3/27/2018 25
  • 26.
  • 27.
    R • PRO  Widelyused and accepted in academics  Very powerful and flexible  Very large user base  Lots of books and manuals  Several User Interface Shells available COST  Free / Open Source CON  Not user friendly  Requires steep learning curve 30 Ashok Pandey 3/27/2018 27
  • 28.
    ⚫Freelyavailable ⚫The softwareconsistsof threemodules: 1. Anthropometriccalculator 2. Individual assessment 3. Nutritional survey WHO Anthro (version 3.2.2, January 2011) Ashok Pandey 3/27/2018 28
  • 29.
  • 30.
    Free / opensource Proprietarysoftwar Aquad(GPL licence, sinceversion 7) (Windows) NVivo(Windows; Mac OS announced for 2014) ELAN (Java-based forWindows, Mac OS, Linux) ATLAS.ti (Windows; Mac OS and iPad announced) CATMA 3.2 forWindows, Mac OS, Linux ) f4analyse( Windows, Mac OS and Linux) Statistical software for Qualitative Data analysis ComputerAssisted/Aided Qualitative Data Analysis Software (CAQDAS) Ashok Pandey 3/27/2018 30
  • 31.
    ⚫STATISTICS JOURNALS: ⚫American Reviewof Mathematis And Statistics ⚫Bayesian Analysis ⚫Electronic Journal for History of Probability and Statistics ⚫Electronic Journal of Statistics ⚫Journal of Modern Applied Statistical Method ⚫Journal of Statistical Software ⚫Journal of Statistics Education ⚫REVSTAT ⚫SORT ⚫Sankhya - The Indian Journal of Statistics ⚫Statistics Education Research Journal ⚫Statistics on the Internet ⚫The R Journal Ashok Pandey 3/27/2018 31
  • 32.
  • 33.
    SPSS - StatisticalPackage for the Social Sciences Ashok Pandey 3/27/2018 33
  • 34.
    What is SPSS? SPSS is a comprehensive and flexible statistical analysis and data management solution.  SPSS is a computer program used for survey authoring and deployment, data mining, text analytics, statistical analysis, and collaboration and deployment.  SPSS can take data from almost any type of file and use them to generate tabulated reports, charts, and plots of distributions and trends, descriptive statistics, and conduct complex statistical analyses.  SPSS is among the most widely used programs for statistical analysis in social science. Ashok Pandey 3/27/2018 34
  • 35.
    About Its is developedby Norman H. Nie and C. Hadlai Hull of IBM Corporation in the year 1968. It is compatible with Windows, Linux, UNIX & Mac operating systems. SPSS is among the most widely used programs for statistical analysis in social science. Ashok Pandey 3/27/2018 35
  • 36.
    About SPSS Inc. •SPSS Inc. is a leading worldwide provider of predictive analytics software and solutions. • today SPSS has more than 250,000 customers worldwide, served by more than 1,200 employees in 60 countries. Ashok Pandey 3/27/2018 36
  • 37.
    Used in…  Telecommunications, Banking,  Finance,  Insurance,  Healthcare,  Manufacturing,  Retail,  Consumer packaged goods,  Higher education,  Government,  and Market research. Ashok Pandey 3/27/2018 37
  • 38.
    INSTALLATION OFSPSS16.0 Ashok Pandey3/27/2018 (STUDENT VERSION) 38
  • 39.
  • 40.
  • 41.
  • 42.
  • 43.
  • 44.
  • 45.
  • 46.
  • 47.
  • 48.
  • 49.
  • 50.
  • 51.
  • 52.
  • 53.
  • 54.
  • 55.
  • 56.
  • 57.
    MISSING VALUES • set. •To change this field, click on the Missing Values… button. • This will open the Define Missing Values: dialog box. • Enter the appropriate information into the fields. • When done, click on the Continue button. Ashok Pandey 3/27/2018 • This field indicates which subset of the data will not be included in the data 57
  • 58.
  • 59.
    Features of SPSS It is easy to learn and use.  It includes a full range of data. management system and editing tools.  It provides in-depth statistical capabilities.  It offers complete plotting, reporting and presentation features. Ashok Pandey 3/27/2018 59
  • 60.
    Getting data intoSPSS  Creating new SPSS data files  Opening existing SPSS system files  Importing data from an ASCII file  Importing data from other file formats Ashok Pandey 3/27/2018 60
  • 61.
    Entering Data DATA EDITOR The data editor offers a simple and efficient spreadsheet like facility for entering data and browsing the working data file.  This window displays the content of the data file.  One can create new data files or modify existing ones.  One can have only one data file open at a time. Ashok Pandey 3/27/2018 61
  • 62.
    Cont..  This editorprovides two views of the data, DATA VIEW  Displays the actual data values or defined value labels. VARIABLE VIEW  Displays variable definition information, including defined variable and value labels, data type, etc.., Ashok Pandey 3/27/2018 62
  • 63.
    Editing Data PIVOT TABLEEDITOR  Output can be modified in many ways with is editor, and can create multidimensional tables. Ex: We can edit text, swap data in rows and columns Ashok Pandey 3/27/2018 63
  • 64.
    Cont.. TEXT OUTPUT EDITOR Text output not displayed in pivot tables can be modified with the text output editor. CHART EDITOR  High-resolution charts and plots can be modified in chart windows. Ashok Pandey 3/27/2018 64
  • 65.
    Saving Data  Weneed to save it and give it a name. The default extension name for saving files is ‘.sav’ .  Ex. SSPS.sav  Also we can able to retrieving already saved file Ashok Pandey 3/27/2018 65
  • 66.
    Variables  Variable isa user defined name of Particular type of data to hold information (such as income or gender or temperature or dosage). Array of variable is a collection values of similar data types. Ashok Pandey 3/27/2018 66
  • 67.
    Variables types 1. Numeric 2.Comma 3. Dot 4. Scientific notation 5. Date 6. Custom currency 7. String Ashok Pandey 3/27/2018 67
  • 68.
    Rules for VariableNames  Names must begin with a letter.  Names must not end with a period.  Names must be no longer than eight characters.  Names cannot contain blanks or special characters.  Names must be unique.  Names are not case sensitive. It doesn’t matter if you call your variable CLIENT, client, or CliENt. It’s all client to SPSS. Ashok Pandey 3/27/2018 68
  • 69.
    BASIC STEPS INDATA ANALYSIS  Get Your Data Into SPSS: We can open a previously saved SPSS data file, read a spreadsheet, database ,or text data file, or enter directly in the data editor.  Select a Procedure: Select a procedure from the menus to calculate statistics or to create a chart. Ashok Pandey 3/27/2018 69
  • 70.
    Cont..  Select TheVariable For TheAnalysis: Variables in the data file are displayed in a dialog box for the procedure.  Run The Procedure: Results are displayed in the viewer. Ashok Pandey 3/27/2018 70
  • 71.
    STATISTICALPROCEDURES  After enteringthe data set in data editor or reading an ASCII data file, we are now ready to analyze it. The Procedures Available are  Reports  Descriptive Statistics  Custom Tables  Compare means  General Linear model (GLM) Ashok Pandey 3/27/2018 71
  • 72.
     Correlate  Regression Loglinear  Classify  Data Reduction  Scale  Non parametric tests  Time Series  Survival  Multiple response. Ashok Pandey 3/27/2018 72
  • 73.
    REPORTS Report is atextual work made with the specific intention of relaying information or recounting certain events in a widely presentable form DESCRIPTIVE STATISTICS This provides techniques for summarizing Data with statistics, charts, and reports. Ashok Pandey 3/27/2018 73
  • 74.
    Cont.. CUSTOM TABLES  Itprovides attractive, flexible, displays of frequency counts, percentages and other statistics. COMPARE MEANS  This provides techniques for testing differences among two or more means on their values for other variable. Ashok Pandey 3/27/2018 74
  • 75.
    Cont.. GENERAL LINEAR MODEL(GLM)  This provides technique for testing univariate and multivariate analysis-of- including repeated variance models measures. CORRELATE  This provides measures of association for two or more Variable measured at the interval level. Ashok Pandey 3/27/2018 75
  • 76.
    Cont.. REGRESSION  This providesa variety of regression techniques , including Linear, logistic, nonlinear, weighted, and two-stage least- squares regression. LOGLINEAR  This provides general and hierarchical log- linear analsis and logit analysis. Ashok Pandey 3/27/2018 76
  • 77.
    Cont.. CLASSIFY  This providescluster and discriminant analysis DATA REDUCTION  This provides factor analysis, correspondence analysis, and optional scaling. Ashok Pandey 3/27/2018 77
  • 78.
    Cont.. SCALE  This providesreliability analysis and multidimensional scaling. NON PARAMETRIC TESTS  This provides non-parametric tests for one sample, or for two and paired or Independent sample. Ashok Pandey 3/27/2018 78
  • 79.
    Cont.. TIME SERIES Provides exponentialsmoothing, autocorrelated regression, ARIMA, X11 ARIMA, seasonal decomposition, spectral analysis, and related techniques. SURVIVAL This provides techniques for analyzing the time for some terminal event to occur, including Kaplan-Meier analysis and Cox regression. MULTIPLE RESPONSE: This provides facilities to define and analyze multiple- response . Ashok Pandey 3/27/2018 79
  • 80.
    GRAPHS BAR  Generate asimple , clustered , or stacked bar chart of the data. LINE  Generate a simple or multiple line chart of the data. AREA  Generate a simple or stacked area chart of the data. Ashok Pandey 3/27/2018 80
  • 81.
  • 82.
  • 83.
  • 84.
    Cont.. PIE  Generates asimple pie chart or a composite bar chart from the data. BOXPLOT  Generates box plot showing the median, outline, and extreme cases of individual variables. Ashok Pandey 3/27/2018 84
  • 85.
  • 86.
  • 87.
    Cont.. PARETO Generates Pareto charts,bar charts with a line superimposed showing the cumulative sum. CONTROL Produces the most commonly-used process- control charts. Ashok Pandey 3/27/2018 87
  • 88.
  • 89.
  • 90.
    Cont.. NORMAL P-P PLOTS Thecumulative proportions of a variable's distribution against the cumulative proportions of the normal distribution. NORMAL Q-Q PLOTS The quantiles of a variable's distribution against the quantiles of the normal distribution. SEQUENCE Produces a plot of one or more variables by order in the file, suitable for examining time-series data. Ashok Pandey 3/27/2018 90
  • 91.
  • 92.
  • 93.
  • 94.
    TIME SERIES: AUTOCORRELATIONS •Calculates and plots the autocorrelation function (ACF) and partial autocorrelation function of one or more series to any specified number of lags, displaying the Box-Ljung statistic at each lag to test the overall hypothesis that the ACF is zero at alllags. Ashok Pandey 3/27/2018 94
  • 95.
  • 96.
    TIME SERIES: CROSS-CORRELATIONS Calculatesand plots the cross-correlation function of two or more series for positive, negative, and zero lags. Ashok Pandey 3/27/2018 96
  • 97.
  • 98.
    TIME SERIES: SPECTRAL •Calculates and plots univariate or bivariate periodograms and spectral density functions, which express variation in a time series as the sum of a series of sinusoidal components. It can optionally save various components ofthe frequency analysis as new series. Ashok Pandey 3/27/2018 98
  • 99.
  • 100.
    Advantages  SPSS offersa user friendliness that most packages are only now catching up to.  It is popular, and though that is certainly not a reason for choosing a statistical package, many data sets are easily loaded into it and other programs can easily import SPSS files. Ashok Pandey 3/27/2018 100
  • 101.
    Disadvantages  For academicuse SPSS lags notably behind SAS, R and even perhaps others that are on the more mathematical rather than statistical side for modern data analysis.  Its menu offerings are typically the most basic of an analysis and sometimes lacking even then, and it makes doing an inappropriate analysis very easy.  It is expensive, sometimes ridiculously so, and even when you do buy you're really only leasing, and its license is definitely not user friendly.  There are often compatibility issues with prior Ashok Pandey 3/27/2018 101
  • 102.
    Translate the Questionnaireinto SPSS 3/27/2018 Ashok Pandey Questions in the questionnaire are mapped into Variables in SPSS 102
  • 103.
    Question-response formats 3/27/2018 AshokPandey • Closed-Ended • Open-Ended with numerical response • Open-Ended with text response • Multiple response questions 103
  • 104.
    Respons-format :: Closed-Ended(1) 3/27/2018 Ashok Pandey 5.How is your satisfaction with the customer service of the staff of Suxes? O Excellent O Good O Bad O Very bad 104
  • 105.
    Coding the answers 3/27/2018Ashok Pandey 1 = Excellent 2 = Good 3 = Bad 4 = Very bad 105
  • 106.
    Respons-format :: Closed-Ended(2) 3/27/2018 Ashok Pandey dia 106 11. Please indicate your gender. O Female O Male Codes: 1 = Female 2 = Male
  • 107.
    Open-ended with numericalresponse 3/27/2018 Ashok Pandey dia 107 2.What is your average expenditure in the restaurant on a weekly basis? ……… euro per week 10.For how many years have you been registered as a student at Pandion University? ……… year(s)
  • 108.
    Open-ended with textresponse 3/27/2018 Ashok Pandey dia 108 1. I would like to have the assortment extended with the following products: ………………………………………… Processed by • • Coding manually afterwards or Typing the answers literally (text variable) (Auto recode afterwards)
  • 109.
    Scale characteristics 3/27/2018 • Description •Order • Distance • Nominal • Ordinal • Scale Ashok Pandey 109
  • 110.
    Levels of measurement 3/27/2018Ashok Pandey Nominal • Your course at Pandion (Marketing, Int. Business and languages, Int. Business administration, Management and law, Health studies, Security); • Smoker or non smoker (yes, no); • Choice of a supermarket (A&P, Wal-Mart, Sears, Aldi, other). 110
  • 111.
    Levels of measurement 3/27/2018Ashok Pandey dia 111 Ordinal In your opinion, would you say the prices at Wal-Mart are O Higher than Sears O About the same as Sears O Lower than Sears
  • 112.
    Levels of measurement 3/27/2018Ashok Pandey dia 112 Ordinal What is your age? O 15–<25 O 25–<40 O 40–<60 O 60–<90
  • 113.
    Levels of measurement 3/27/2018Ashok Pandey dia 113 Ordinal Statement Strongly disagree Strongly agree a. I always look for bargains 1 2 3 4 5 b. I enjoy being outdoors 1 2 3 4 5 c. I love to cook 1 2 3 4 5
  • 114.
    Levels of measurement 3/27/2018Ashok Pandey dia 114 Scale Please indicate your age. ___ Years How much do you think a typical purchaser of a $100,000 term life insurance policy pays per year for that policy? $ ____
  • 115.
    Coding data andthe data code book 3/27/2018 Ashok Pandey dia 115 Questions  Variables • Name of the variable • Variable label • Value labels (data codes) • Level of measurement (Measure)
  • 116.
    The SPSS DataEditor Data View 3/27/2018 Ashok Pandey dia 116
  • 117.
    The SPSS DataEditor Variable View 3/27/2018 Ashok Pandey dia 117
  • 118.
    The SPSS DataEditor 3/27/2018 Ashok Pandey dia 118 Variable view – Name – Type (Numeric) – Label – Values (= the codes of the answers) – Measure (= Level of Measurement)
  • 119.
    SPSS Menu’s 3/27/2018 AshokPandey dia 119 • Analyze – Frequencies – Cross tabs – Tables
  • 120.
    SPSS Menu’s 3/27/2018 AshokPandey dia 120 • Graphs – Bar – Pie – Histogram – Line – Boxplot
  • 121.
    SPSS Output 3/27/2018 AshokPandey dia 121 • Separate file in Output Viewer • Inline Editing of Tables • Chart Editor for Graphs Don’t forget to save – Data file – Output file
  • 122.
    File formats • Basicformat is .SAV • Supports other common formats such as .XLSX, .CSV, .DAT etc • SPSS syntax file (.SPS) can be used to convert other formats to SPSS format Ashok Pandey 3/27/2018 122
  • 123.
  • 124.
  • 125.
    The Four Windows:Data Editor ● Data Editor Spreadsheet-like system for defining, entering, editing, and displaying data. Extension of the saved file will be “sav.” Ashok Pandey 3/27/2018 125
  • 126.
    The Four Windows:Output Viewer ● Output Viewer Displays output and errors. Extension of the saved file will be “spv.” Ashok Pandey 3/27/2018 126
  • 127.
    The Four Windows:Syntax editor ● Syntax Editor Text editor for syntax composition. Extension of the saved file will be “sps.” Ashok Pandey 3/27/2018 127
  • 128.
    The Four Windows:Script Window ● Script Window Provides the opportunity to write full-blown programs, in a BASIC-like language. Text editor for syntax composition. Extension of the saved file will be “sbs.” Ashok Pandey 3/27/2018 128
  • 129.
  • 130.
    Opening SPSS ● Start→ All Programs → SPSS Inc→ SPSS 16.0 → SPSS 16.0 Ashok Pandey 3/27/2018 130
  • 131.
    Opening SPSS ● Thedefault window will have the data editor ● There are two sheets in the window: 1. Data view 2. Variable view Ashok Pandey 3/27/2018 131
  • 132.
    Data View window ●The Data View window This sheet is visible when you first open the Data Editor and this sheet contains the data ● Click on the tab labeled Variable View Click Ashok Pandey 3/27/2018 132
  • 133.
    Variable View window ●This sheet contains information about the data set that is stored with the dataset ● Name ● The first character of the variable name must be alphabetic ● Variable names must be unique, and have to be less than 64 characters. ● Spaces are NOT allowed. Ashok Pandey 3/27/2018 133
  • 134.
    Variable View window:Type ● Type ● Click on the ‘type’ box. The two basic types of variables that you will use are numeric and string. This column enables you to specify the type of variable. Ashok Pandey 3/27/2018 134
  • 135.
    Variable View window:Width ● Width ● Width allows you to determine the number of characters SPSS will allow to be entered for the variable Ashok Pandey 3/27/2018 135
  • 136.
    Variable View window:Decimals ● Decimals ● Number of decimals ● It has to be less than or equal to 16 3.14159265 Ashok Pandey 3/27/2018 136
  • 137.
    Variable View window:Label ● Label ● You can specify the details of the variable ● You can write characters with spaces up to 256 characters Ashok Pandey 3/27/2018 137
  • 138.
    Variable View window:Values ● Values ● This is used and to suggest which numbers represent which categories when the variable represents a category Ashok Pandey 3/27/2018 138
  • 139.
    Defining the valuelabels ● Click the cell in the values column as shown below ● For the value, and the label, you can put up to 60 characters. ● After defining the values click add and then click OK. Click Ashok Pandey 3/27/2018 139
  • 140.
    Practice 1 ● Howwould you put the following information into SPSS? Value = 1 represents Male and Value = 2 represents Female N a m e G e n d e r H e i g h t J A U N I TA 2 5 . 4 S A L LY 2 5 . 3 D O N N A 2 5 . 6 S A B R I N A 2 5 . 7 J O H N 1 5 . 7 M A R K 1 6 E R I C 1 6 . 4 B R U C E 1 5 . 9 Ashok Pandey 3/27/2018 140
  • 141.
    Practice 1 (SolutionSample) Click Ashok Pandey 3/27/2018 141
  • 142.
  • 143.
    Saving the data ●To save the data file you created simply click ‘file’ and click ‘save as.’ You can save the file in different forms by clicking “Save as type.” Click Ashok Pandey 3/27/2018 143
  • 144.
    Sorting the data ●Click ‘Data’ and then click Sort Cases Ashok Pandey 3/27/2018 144
  • 145.
    Sorting the data(cont’d) ● Double Click ‘Name of the students.’ Then click ok. Click Click Ashok Pandey 3/27/2018 145
  • 146.
    Practice 2 ● Howwould you sort the data by the ‘Height’ of students in descending order? ● Answer ● Click data, sort cases, double click ‘height of students,’ click ‘descending,’ and finally click ok. Ashok Pandey 3/27/2018 146
  • 147.
    Transforming data ● Click‘Transform’ and then click ‘Compute Variable…’ Ashok Pandey 3/27/2018 147
  • 148.
    Transforming data (cont’d) ●Example: Adding a new variable named ‘lnheight’ which is the natural log of height ● Type in lnheight in the ‘Target Variable’ box. Then type in ‘ln(height)’ in the ‘Numeric Expression’ box. Click OK Click Ashok Pandey 3/27/2018 148
  • 149.
    Transforming data (cont’d) ●A new variable ‘lnheight’ is added to the table Ashok Pandey 3/27/2018 149
  • 150.
    Practice 3 ● Createa new variable named “sqrtheight” which is the square root of height. ● Answer Ashok Pandey 3/27/2018 150
  • 151.
  • 152.
    The basic analysisof SPSS that will be introduced in this class ● Frequencies ● This analysis produces frequency tables showing frequency counts and percentages of the values of individual variables. ● Descriptives ● This analysis shows the maximum, minimum, mean, and standard deviation of the variables ● Linear regression analysis ● Linear Regression estimates the coefficients of the linear equation Ashok Pandey 3/27/2018 152
  • 153.
    Opening the sampledata ● Open ‘Employee data.sav’ from the SPSS ● Go to “File,” “Open,” and Click Data Ashok Pandey 3/27/2018 153
  • 154.
    Opening the sampledata ● Go to Program Files,” “SPSSInc,” “SPSS16,” and “Samples” folder. ● Open “Employee Data.sav” file Ashok Pandey 3/27/2018 154
  • 155.
    Frequencies ● Click ‘Analyze,’‘Descriptive statistics,’ then click ‘Frequencies’ Ashok Pandey 3/27/2018 155
  • 156.
    Frequencies ● Click genderand put it into the variable box. ● Click ‘Charts.’ ● Then click ‘Bar charts’ and click ‘Continue.’ Click Click Ashok Pandey 3/27/2018 156
  • 157.
    Frequencies ● Finally ClickOK in the Frequencies box. Click Ashok Pandey 3/27/2018 157
  • 158.
  • 159.
    Using the Syntaxeditor ● Click ‘Analyze,’ ‘Descriptive statistics,’ then click ‘Frequencies.’ ● Put ‘Gender’ in the Variable(s) box. ● Then click ‘Charts,’ ‘Bar charts,’ and click ‘Continue.’ ● Click ‘Paste.’ Click Ashok Pandey 3/27/2018 159
  • 160.
    Using the Syntaxeditor ● Highlight the commands in the Syntax editor and then click the run icon. ● You can do the same thing by right clicking the highlighted area and then by clicking ‘Run Current’ Click Right Click! Ashok Pandey 3/27/2018 160
  • 161.
    Practice 4 ●Do afrequency analysis on the variable “minority” ● Create pie charts for it ●Do the same analysis using the syntax editor Ashok Pandey 3/27/2018 161
  • 162.
  • 163.
  • 164.
    Descriptives ● Click ‘Analyze,’‘Descriptive statistics,’ then click ‘Descriptives…’ ● Click ‘Educational level’ and ‘Beginning Salary,’ and put it into the variable box. ● Click Options Click Ashok Pandey 3/27/2018 164
  • 165.
    Descriptives ● The optionsallows you to analyze other descriptive statistics besides the mean and Std. ● Click ‘variance’ and ‘kurtosis’ ● Finally click ‘Continue’ Click Click Ashok Pandey 3/27/2018 165
  • 166.
    Descriptives ● Finally ClickOK in the Descriptives box. You will be able to see the result of the analysis. Ashok Pandey 3/27/2018 166
  • 167.
    Regression Analysis ● Click‘Analyze,’ ‘Regression,’ then click ‘Linear’ from the main menu. Ashok Pandey 3/27/2018 167
  • 168.
    Regression Analysis ● Forexample let’s analyze the model ● Put ‘Beginning Salary’ as Dependent and ‘Educational Level’ as Independent. salbegin  0  1edu  Click Click Ashok Pandey 3/27/2018 168
  • 169.
    Regression Analysis ● ClickingOK gives the result Ashok Pandey 3/27/2018 169
  • 170.
    Plotting the regressionline ● Click ‘Graphs,’ ‘Legacy Dialogs,’ ‘Interactive,’ and ‘Scatterplot’ from the main menu. Ashok Pandey 3/27/2018 170
  • 171.
    Plotting the regressionline ● Drag ‘Current Salary’ into the vertical axis box and ‘Beginning Salary’ in the horizontal axis box. ● Click ‘Fit’ bar. Make sure the Method is regression in the Fit box. Then click ‘OK’. Click Set this to Regression! Ashok Pandey 3/27/2018 171
  • 172.
  • 173.
    Pra ● c Fit nidc oe ut w 5 hetheror not the previous experience of workers has any affect on their beginning salary? ● Take the variable “salbegin,” and “prevexp” as dependent and independent variables respectively. ● Plot the regression line for the above analysis using the “scatter plot” menu. Ashok Pandey 3/27/2018 173
  • 174.
  • 175.
  • 176.
    Click on the“fit” tab to make sure the method is regression Ashok Pandey 3/27/2018 176
  • 177.
  • 178.
    Thank You. .. Ashok Pandey 3/27/2018 178
  • 179.
    HOW TO CREATE “QES,REC AND CHECK” FILE IN EPI-DATA Ashok Pandey 3/27/2018 179
  • 180.
    Step 1. CREATE“QES” file A. Create new folder in your computer so that all epi-data documents you are going to create are put together. B. Open EPI-DATA software C. Click on “Define data” from epi-data window 3/27/2018 Ashok Pandey 1 8 0 180
  • 181.
    QES…CON’T… 3/27/2018 Ashok Pandey1 8 1 D. Select “New .QES file” from Define data options E.Start by writing your project name in “New. QES file” window F.Type “ variable name” first , followed by “Field label” then “Define type of variable” 181
  • 182.
    Variable name andfield label The first word you type are considered as “variable name” Then the list of full meaning of your variable name are “field label” Eg. IDNo ----- (variable name) Ashok Pandey 3/27/2018 182
  • 183.
    Define type ofvariable Using “field pick list” menu from epi-data we can decide weather our variable are 1. Numeric 2. Text 3. Date 5 Ashok Pandey 3/27/2018 183
  • 184.
    To make “IDnumber” to be assigned automatically 3/27/2018 Ashok Pandey 18 4 • From “Field pick list” menu select “Other” then select “Auto ID number”, put the number of field length (1,2,3…) then click “Insert”
  • 185.
    To insert datetype of variable 3/27/2018 Ashok Pandey 18 5 From “Field pick list menu” click on “Date” , select the date formats you want to use then click “Insert”. 1. DD/MM/YYYY--- 12/03/2018 ---Standard date format 2. MM/DD/YYYY---03/12/2018 3. YYYY/MM/DD ---2018/03/12
  • 186.
    Numeric type ofvariable 3/27/2018 Ashok Pandey 18 6 and Date • We use it for variables {other than ID ,Text variables} which we insert our data using NUMBER . • Eg 1 = Yes (for “Yes” response we insert “1”) 2 = No (For “No” type response we insert “2”)
  • 187.
    Create numeric typeof variable using two ways 3/27/2018 Ashok Pandey 18 7 1. Using “FIELD PICK LIST” MENU from epi data window  From “Field pick list menu” click on “Numeric” then decide the number of digits before and after decimal points. Eg. If we want no digits after decimal points we make digits after decimal points as= “0”
  • 188.
    CON’T… 3/27/2018 Ashok Pandey18 8 And we make before decimal points based on our interest, (that is based on our sample size). For example----- if our sample size is 100, we make it 3. i.e field length is 3 (# # #), for 50 sample, we make it as “2”, i.e the field length is 2 (# #).
  • 189.
    Second method todefine Numeric type of variables 3/27/2018 Ashok Pandey 18 9 2. Using short cuts Click shift+# on your computer E.g for 200 we type as (shift 3x i.e ###)
  • 190.
    After finish “QES”file“align fields” 3/27/2018 Ashok Pandey 19 0 • To make our data entry form more attractive need to align fields • Select “EDIT” Menu from epi-data, click “Align fields” N.B. first click on the variable with long variable label.
  • 191.
    Step 2. CREATE“REC” FILE 3/27/2018 Ashok Pandey 19 1 First save our “QES file” on the folder we create before and label it. Second click “Make data file” at epi-data menu, then select “Make data file”
  • 192.
    Step 3. Create“CHECK FILE” In this part we Set rules and commands for our data 1. Define range and legal values for continuous type of variables (e.g. age, income…). message. 14 Ashok Pandey 3/27/2018 192
  • 193.
    CHECK…CON’T… 3/27/2018 Ashok Pandey19 3 2. Set “MUST ENTER & REPEAT” commands We will not pass any fields without entering data if we set “Must enter commands” 193
  • 194.
    CHECK…CON’T… 3/27/2018 Ashok Pandey19 4 3. “SHOW” & “TYPE COMMENT” COMMANDS This commands help us during data entry by showing us list of responses to chose among the lists and type entered response for each respondents. 194
  • 195.
    CHECK…CON’T… 4. Define variablelabels for “categorical type of variables” (1=male, 2= Female). N.B. IF the categorical variable is made of two words it must put under double quotation. e.g. marital status---1. “never married”--- Two words Ashok Pandey 3/27/2018 195
  • 196.
    Cont’d… • 5. Set“SKIP” Commands (IF the answer for question “A” is “No” then skip question number “B” and go to question number “C”). Select the question where this commands setted, then Click on “edit” in check file, then click enter and type the followings :- AFTER ENTRY •IF A <> 1 THEN GOTO C • ENDIF Ashok Pandey 3/27/2018 196
  • 197.
    Step 4. EXPORT“EPI-DATA” FILE TO SPSS 3/27/2018 Ashok Pandey 19 7  Open your epi-data file, select “Export data” from epi-data window, select SPSS, click ok  Second select and open spss data file from folder where your epidata qes ,rec and check files found together under the same folder.  Third from opened spss window click on “RUN” and select “run all”  Fourth save the new exported spss data. 197
  • 198.
    THANK YOU ALL 3/27/2018Ashok Pandey 19 8 198
  • 199.
  • 200.
    What is Endnote? Createand manages reference lists. Enables searching of reference "libraries" by author, keyword, date, etc. In Word documents, automatically formats the references in APA format for you. Many online databases allow references to be sent directly into Endnote. Can also store and organise images, graphs, tables, etc.
  • 201.
    Entering References: Three ways: (a)Manually type them in. (b) Save files from online search facilities. (c) Search online databases through Endnote and retrieve the references directly to your Endnote library
  • 202.
    Manually Entering References(1) (a) To start a new Endnote library, click on "file", then "new" (b) This box appears - enter a filename for your new library
  • 203.
    Manually Entering References(2) Your new reference library (empty at the moment...)
  • 204.
    Manually Entering References(3) To enter a reference, go to "New Reference"
  • 205.
    Manually Entering References(4) Enter details of the reference in the relevant "fields" (Optional how many you use). Select which type of reference you want (journal, book, comic, etc.)
  • 206.
  • 207.
    Manually Entering References(6) Click on "Close Reference" to finish entering this particular reference. Click on "New Reference" to add another reference.
  • 208.
  • 209.
  • 210.
    Information about References: EachReference: Stores all the information needed to cite it in a reference list (e.g. in a lab report or essay). Within a library, each reference has a unique record number which cannot be changed. The fields (author, year etc) can be modified, deleted or new ones added. There are many reference types (book, journal article, newpaper article, chart, equation, etc...)
  • 211.
    Downloading references fromthe Web of Knowledge: 1. Go to library website and select "online resources":
  • 212.
    2. Scroll downto "Web of Knowledge":
  • 213.
    3. Click on"Web of Knowledge":
  • 214.
    4. Click on"Web of Science":
  • 215.
  • 216.
    5. Tick thereferences you want to retain.
  • 217.
    6. Click on"Save to Endnote...".
  • 218.
    References are exportedto your chosen Endnote library: NB: shows only the new references (click on "Show all references" to see earlier entries).
  • 219.
    Downloading citations fromScienceDirect: 1. Go to library website, click on ScienceDirect:
  • 220.
    2. Perform yoursearch, then click on "export citations":
  • 221.
    3. Pick "citationsonly" or "citations and abstracts":
  • 222.
    5. Entries areadded to the chosen Endnote library (this time, with abstracts as well):
  • 223.
  • 224.
    Endnote adds anextra menu within Microsoft Word:
  • 225.
    Referencing conventions: In essaysand lab-reports, all cited work must be properly referenced, by a reference in the text (author surname and date of publication), and an entry in a reference list that contains complete details of each reference: In the text: "Field and Hole (2003) give lots of useful advice". Or "Learning statistics has been shown to be easier than people think (Field and Hole, 2003)". In the reference list: Field, A. and Hole, G. (2003). How to design and report experiments. London: Sage. Problem is that the conventions for this differ slightly between journals (although most use "A.P.A. format").
  • 226.
    Start Word andopen the document you are writing. To cite a source, position the cursor where you want the reference to appear, then click on "Insert Selected Citation": Inserting references in the text:
  • 227.
    Endnote (a) adds thereference in the text; (b) adds the full reference to a reference list at the end of the document - correctly-formated and in alphabetical order! This is a load of rubbish I'm writing in order to show you how to use "Endnote" (Duck and Mouse 2007). Here's some more tosh that I've just typed (Sooty and Sweep 2007), and yet more (Lala, Tinky-winky et al. 2007). Duck, D. and M. Mouse (2007). "Our living hell: life as prisoners in Disneyland." Animal Behaviour 29(5): 179-199. Lala, Tinky-winky, et al. (2007). "Effects of the media on body-image in telly- tubbies." Journal of banal research 99: 201-203. Sooty and Sweep (2007). Hands up: we don't have a leg to stand on. Congleton, Garbage Books Inc.
  • 228.
    Formatting the Bibliography: Youcan format the references in different styles by choosing ‘Format Bibliography’ from the Endnote menu. Use "APA 5th" as your output style
  • 229.
    More Information, andhow to get Endnote: Endnote is installed on all campus PC's. For your own computer, you need to purchase a copy. See the Sussex University IT centre's website:
  • 230.
    wants to helpresearchers organize, share, and discover research papers. Mendeley
  • 231.
     What isMendeley?  Creating your library  Managing your documents & references  Citing and sharing references
  • 232.
    Based in London,Mendeley are 15 researchers, graduates and software developers from... ...backed by co-founders and former executives of:
  • 233.
    research libraries researchers papers disciplines musiclibraries artists songs genres Last.fm Mendeley
  • 234.
    What is Mendeley? Mendeleyis free academic software (Win, Mac & Linux) to manage, share, read, annotate and cite your research papers... ...and a research network to manage your papers online, discover research trends and statistics, and to connect to like-minded researchers.
  • 235.
    What is Mendeley? Setup and manage your collections Add tags & notes and edit document details Library showing all your documents (citation or table view) Filter your papers by authors, keywords, tags, or publications
  • 236.
  • 237.
    Adding your papers Youhave different options to set up your library: • Add single files or an entire folder • “Watch a folder” to automatically import PDF files • Add existing EndNote/BibTeX/RIS databases, or… …drag & drop PDF files into the library pane… … and Mendeley will try to extract the document details automatically
  • 238.
    Document details lookup Youcan also try to complete the document details by querying various databases (Crossref, PubMed, ArXiv or Google Scholar) Enter the DOI, PubMed, or ArXiv ID and click on the magnifier glass to start lookup And remember – made a mistake? Press CTRL+Z (or Edit > Undo) to undo the last step
  • 239.
    Web Importer To installthe Web Importer, drag & drop the bookmarklet to your Favorites/Bookmarks in your internet browser Supported sites www.mendeley.com/import The Web Importer helps you to grab citations off the web
  • 240.
    Using the WebImporter On the web page with the reference(s) you want to capture: click on the bookmarklet… …then click on “Import” to import the reference/paper to your Mendeley library. If possible/available, also the associated PDF will be imported.
  • 241.
    Synchronize and manageyour library online Synchronize your library You can also add references and edit & manage your library online In addition, you will get statistics about your library, your impact and your research field (see later)
  • 242.
    Manage your library Staryour favorite papers Documents can be marked read/unread Filter by authors, tags, publications or keywords Open attached PDF files in integrated viewer
  • 243.
  • 244.
    Full text searchin Mendeley’s PDF viewer
  • 245.
  • 246.
    Mendeley‘s File Organizer Mendeleycan also organize your PDF files in a consistent folder structure on your hard disk and rename them according to their document details You can find the File Organizer in Tools > Options > File Organizer
  • 247.
  • 248.
    Citing in Word& Open Office Click on “Insert Citation” in Word Highlight the paper you want to cite
  • 249.
    Citing in Word& Open Office “Send citation” to Word Citation will show up based on selected style Cite into Google documents or other editors by copy & paste
  • 250.
    Creating bibliographies Insert abibliography based on the citations
  • 251.
    Public Collections (“ReadingLists”) You can make a collection public in “Edit Settings” View the collection online – other users can subscribe via clicking on “Subscribe” on the collection page. A Public Collection acts like a “Reading List” – you can add references to the collection, and users who have subscribed to this collection will get the references pushed into their Mendeley account. PDFs are not attached.
  • 252.
    Shared Collections A sharedcollection allows a research group to create a private, shared library and to collaboratively edit and annotate documents and references. Only the members of this collection can see it online
  • 253.
    Create your professionalresearch profile
  • 254.
  • 255.
  • 256.
    Leave feedback andsee what’s coming next Visit http://feedback.mendeley.com to see what others are saying, leave feedback, request features or report bugs