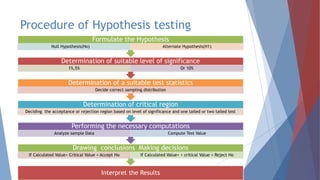
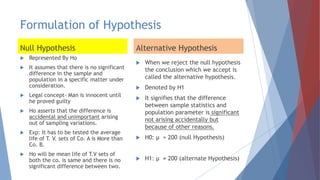
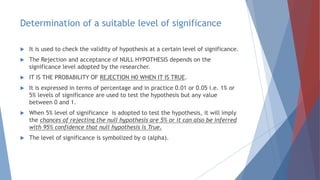
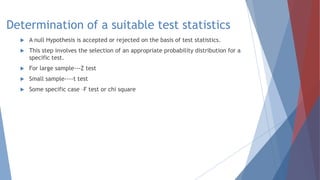
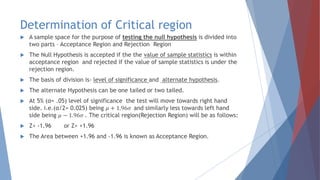
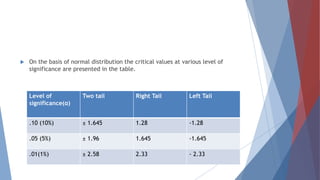
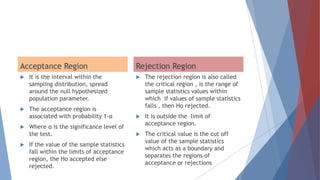
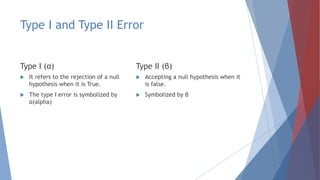
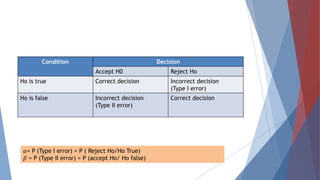
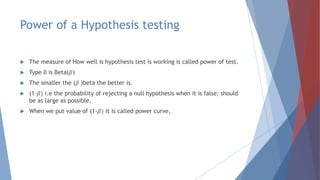
VIP Call Girls Service Charbagh { Lucknow Call Girls Service 9548273370 } Boo...
Testing of hypothesis
1. Testing of Hypothesis
Dr. Ruchi jain
Associate professor
Department of Commerce-Financial Studies
Iis (deemed to be university) Jaipur
2. Meaning
Hypothesis is a formal statement of the tentative or
expected prediction or explanation of the relationship
between two or more variables in a specific population.
Hypothesis is a pre-assumption about a problem and
facts are collected to test the significance thereof.
If the facts verifies the assumption it becomes a
principle.
3. Characteristics of good hypothesis
Based on sound reasoning
Precise and clearly states the relationship between the defined variables.
Capable of being tested
Defines variable in easy in measurable terms
Consistent with most known facts
Test within a reasonable amount of time.
Selection of research design
Providing the framework in which the results have to be given
4. Test of Significance or Hypothesis testing
Standard error is a significant part of test of significance or hypothesis
testing.
The test of hypothesis regarding the mean of population(μ) can be carried by
testing the difference of mean of sample and mean of population.
The standard deviation (variation)of the sampling distribution(mean of
sample) is called sample error.i
5. Procedure of Hypothesis testing
Interpret the Results
Drawing conclusions Making decisions
If Calculated Value< Critical Value = Accept Ho If Calculated Value< > critical Value = Reject Ho
Performing the necessary computations
Analyze sample Data Compute Test Value
Determination of critical region
Deciding the acceptance or rejection region based on level of significance and one tailed or two tailed test
Determination of a suitable test statistics
Decide correct sampling distribution
Determination of suitable level of significance
1%,5% Or 10%
Formulate the Hypothesis
Null Hypothesis(Ho) Alternate Hypothesis(H1)
6. Formulation of Hypothesis
Null Hypothesis
Represented By Ho
It assumes that there is no significant
difference in the sample and
population in a specific matter under
consideration.
Legal concept- Man is innocent until
he proved guilty
Ho asserts that the difference is
accidental and unimportant arising
out of sampling variations.
Exp: It has to be tested the average
life of T. V. sets of Co. A is More than
Co. B.
Ho will be mean life of T.V sets of
both the co. is same and there is no
significant difference between two.
Alternative Hypothesis
When we reject the null hypothesis
the conclusion which we accept is
called the alternative hypothesis.
Denoted by H1
It signifies that the difference
between sample statistics and
population parameter is significant
not arising accidentally but
because of other reasons.
H0: μ = 200 (null Hypothesis)
H1: μ ≠ 200 (alternate Hypothesis)
7. Determination of a suitable level of significance
It is used to check the validity of hypothesis at a certain level of significance.
The Rejection and acceptance of NULL HYPOTHESIS depends on the
significance level adopted by the researcher.
IT IS THE PROBABILITY OF REJECTION H0 WHEN IT IS TRUE.
It is expressed in terms of percentage and in practice 0.01 or 0.05 i.e. 1% or
5% levels of significance are used to test the hypothesis but any value
between 0 and 1.
When 5% level of significance is adopted to test the hypothesis, it will imply
the chances of rejecting the null hypothesis are 5% or it can also be inferred
with 95% confidence that null hypothesis is True.
The level of significance is symbolized by α (alpha).
8. Determination of a suitable test statistics
A null Hypothesis is accepted or rejected on the basis of test statistics.
This step involves the selection of an appropriate probability distribution for a
specific test.
For large sample---Z test
Small sample----t test
Some specific case –F test or chi square
9. Determination of Critical region
A sample space for the purpose of testing the null hypothesis is divided into
two parts – Acceptance Region and Rejection Region
The Null Hypothesis is accepted if the the value of sample statistics is within
acceptance region and rejected if the value of sample statistics is under the
rejection region.
The basis of division is- level of significance and alternate hypothesis.
The alternate Hypothesis can be one tailed or two tailed.
At 5% (α= .05) level of significance the test will move towards right hand
side. i.e.(α/2= 0.025) being 𝜇 + 1.96𝜎 and similarly less towards left hand
side being 𝜇 − 1.96𝜎 . The critical region(Rejection Region) will be as follows:
Z< -1.96 or Z> +1.96
The Area between +1.96 and -1.96 is known as Acceptance Region.
10. On the basis of normal distribution the critical values at various level of
significance are presented in the table.
Level of
significance(α)
Two tail Right Tail Left Tail
.10 (10%) ± 1.645 1.28 -1.28
.05 (5%) ± 1.96 1.645 -1.645
.01(1%) ± 2.58 2.33 - 2.33
11. Acceptance Region
It is the interval within the
sampling distribution, spread
around the null hypothesized
population parameter.
The acceptance region is
associated with probability 1-α
Where α is the significance level of
the test.
If the value of the sample statistics
fall within the limits of acceptance
region, the Ho accepted else
rejected.
Rejection Region
The rejection region is also called
the critical region , is the range of
sample statistics values within
which if values of sample statistics
falls , then Ho rejected.
It is outside the limit of
acceptance region.
The critical value is the cut off
value of the sample statistics
which acts as a boundary and
separates the regions of
acceptance or rejections
12. Type I and Type II Error
Type I (α)
It refers to the rejection of a null
hypothesis when it is True.
The type I error is symbolized by
α(alpha)
Type II (β)
Accepting a null hypothesis when it
is false.
Symbolized by β
13. Condition Decision
Accept H0 Reject Ho
Ho is true Correct decision Incorrect decision
(Type I error)
Ho is false Incorrect decision
(Type II error)
Correct decision
𝛼= P (Type I error) = P ( Reject Ho/Ho True)
𝛽 = P (Type II error) = P (accept Ho/ Ho false)
14. Power of a Hypothesis testing
The measure of How well is hypothesis test is working is called power of test.
Type II is Beta(𝛽)
The smaller the (𝛽 )beta the better is.
(1-𝛽) i.e the probability of rejecting a null hypothesis when it is false; should
be as large as possible.
When we put value of (1-𝛽) it is called power curve,