Download to read offline
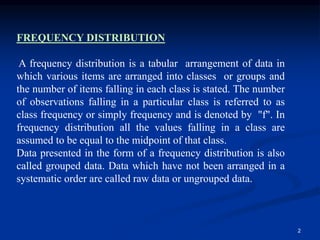
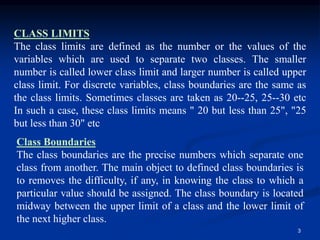
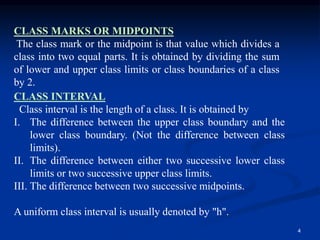
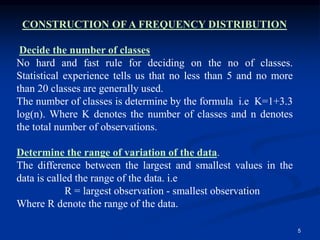
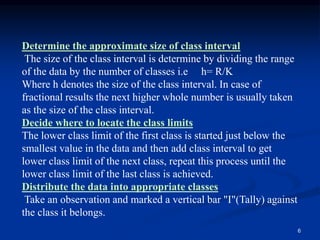
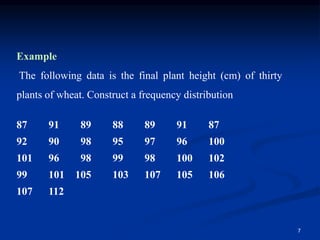
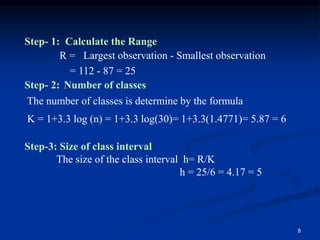
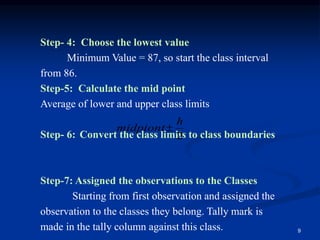
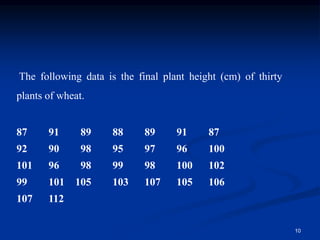
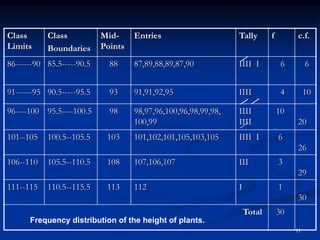
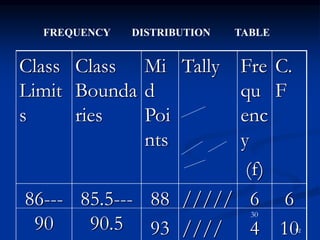
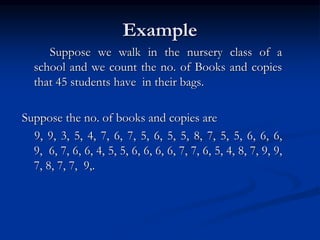
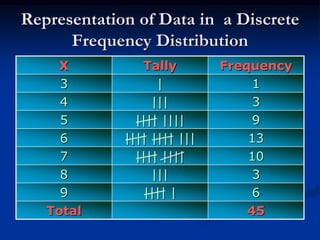
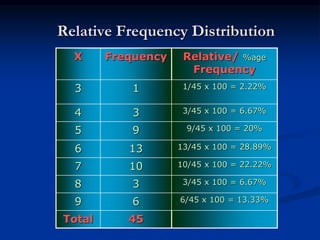
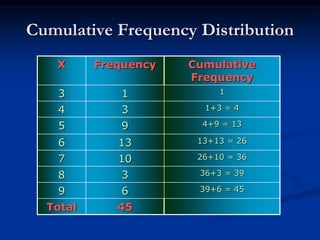

This document discusses key concepts in constructing a frequency distribution from raw data. It defines a frequency distribution as a tabular arrangement of data grouped into classes with the number of observations in each class stated. It describes how to determine the number of classes, class intervals, class limits, boundaries and midpoints to properly group the data. An example is provided to demonstrate how to construct a frequency distribution table from a set of raw plant height data by distributing the observations into the appropriate classes.


