Download to read offline

![Stem and Leaf display
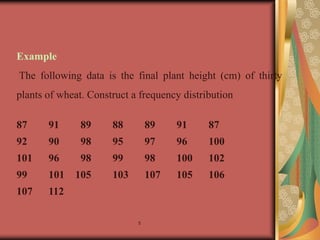
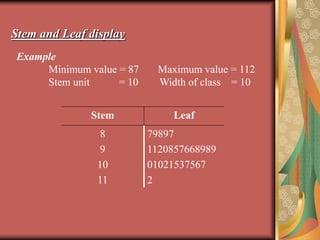
Example
Width of class = 5
Stem Leaf
8*
8.
9*
9.
10*
10.
11*
11.
-
79897
1120
857668989
010213
57567
2
-
* Indicates 0-4 . Indicates 5-9 [(*, .) are called place holder]](https://image.slidesharecdn.com/lec-6stemleaf-200526095914/85/Stem-and-Leaf-Display-in-Biostatic-8-320.jpg)
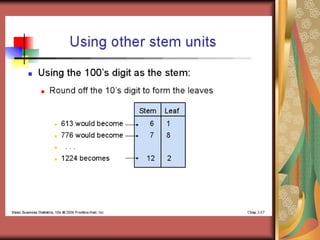
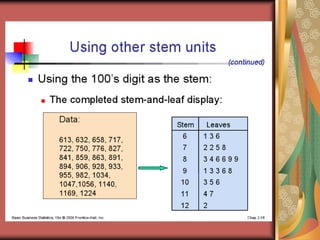
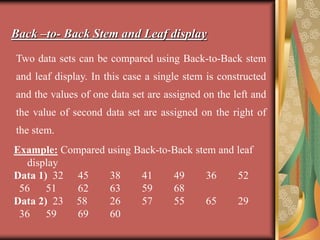
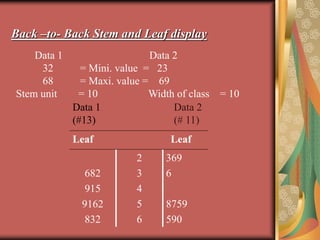

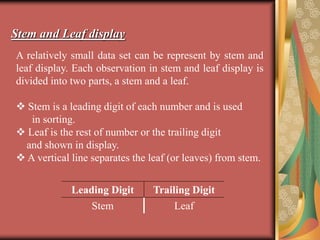
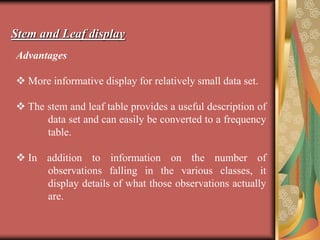
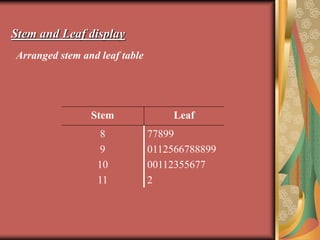
Stem and leaf displays provide a way to visually represent relatively small data sets. Each data point is divided into a stem, which is a leading digit used for sorting, and a leaf, which is the trailing digit displayed after a vertical line. Stem and leaf displays show the actual data values, can be easily converted to frequency tables, and provide a useful overview of a data set's distribution. To create one, the data is sorted by stem, with leaves arranged to the right of each stem. Back-to-back stem and leaf displays allow two data sets to be compared side by side.


![Chi square[1]](https://cdn.slidesharecdn.com/ss_thumbnails/chisquare1-130205125535-phpapp01-thumbnail.jpg?width=640&height=640&fit=bounds)