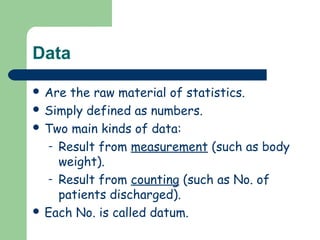
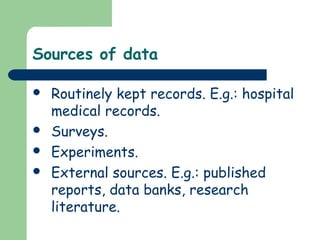
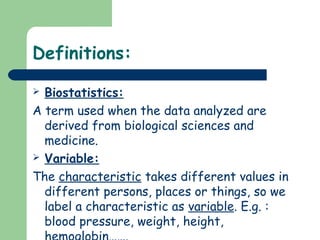
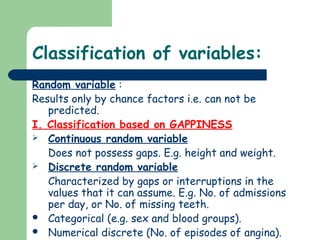
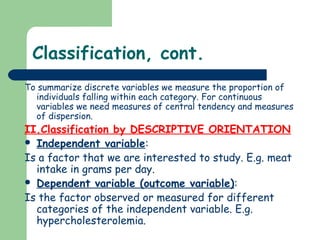
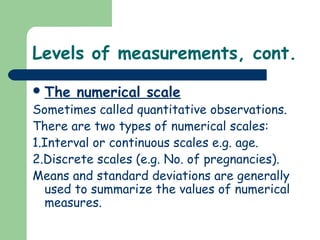
Bio-Statistics


      Prepared by:
      Assistant Prof.
      Namir Al-Tawil
Definition of statistics

It is the science that is concerned
 with collection, organization,
 summarization, and analysis of
 data; then drawing of inferences
 about a body of data when only a
 part of data is observed.
Data

 Are  the raw material of statistics.
 Simply defined as numbers.
 Two main kinds of data:

   – Result from measurement (such as body
     weight).
   – Result from counting (such as No. of
     patients discharged).
 Each No. is called datum.
Sources of data

   Routinely kept records. E.g.: hospital
    medical records.
   Surveys.
   Experiments.
   External sources. E.g.: published
    reports, data banks, research
    literature.
Definitions:

 Biostatistics:
A term used when the data analyzed are
  derived from biological sciences and
  medicine.
 Variable:

The characteristic takes different values in
  different persons, places or things, so we
  label a characteristic as variable. E.g. :
  blood pressure, weight, height,
Definitions:
 Quantitative variable
A variable that can be measured in the usual
  sense. E.g.: Weight of pre-school children,
  age of patients ……
 Qualitative variable

Can not be measured as the quantitative
  variable, e.g. ethnic group, possessing a
  characteristic or not such as smokers and
  non-smokers. Here we use frequencies
  falling in each category of the variable.
Classification of variables:
Random variable :
Results only by chance factors i.e. can not be
   predicted.
I. Classification based on GAPPINESS
 Continuous random variable

   Does not possess gaps. E.g. height and weight.
 Discrete random variable

   Characterized by gaps or interruptions in the
   values that it can assume. E.g. No. of admissions
   per day, or No. of missing teeth.
 Categorical (e.g. sex and blood groups).
 Numerical discrete (No. of episodes of angina).
Classification, cont.
Note:
To summarize discrete variables we measure the proportion of
  individuals falling within each category. For continuous
  variables we need measures of central tendency and measures
  of dispersion.
II.Classification by DESCRIPTIVE ORIENTATION
 Independent variable:

Is a factor that we are interested to study. E.g. meat
  intake in grams per day.
 Dependent variable (outcome variable):

Is the factor observed or measured for different
  categories of the independent variable. E.g.
  hypercholesterolemia.
III. Classification by levels of

        measurement

 The   nominal scale: Consists of
  classifying the observations into
  various mutually exclusive categories.
  E.g. males & females.
 The ordinal scale: Observations are
  ranked according to some criterion,
  e.g. patients status on discharge
  from hospital (unimproved, improved,
  much improved).
Levels of measurements, cont.
 The   numerical scale
Sometimes called quantitative observations.
There are two types of numerical scales:
1.Interval or continuous scales e.g. age.
2.Discrete scales (e.g. No. of pregnancies).
Means and standard deviations are generally
  used to summarize the values of numerical
  measures.
Definitions

Population:

The largest collection of entities
 for which we have an interest at
 a particular time.
Sample:

Part of a population.
Random (probability) Sampling
          methods

1.Simple random sampling:
Use random number table.
(see next slide).
Random (probability) Sampling
             methods

2. Systematic sampling: Include individuals
   at regular intervals. E.g. individuals No. 4,
   7, 10, 13, …. Will be included.
The interval in this example is (3), measured
   by dividing the No. of the population by
   the required sample. E.g. 60/20.
The starting point must be chosen randomly.
Random (probability) Sampling
            methods

3. Stratified sampling: Divide into
   subgroups according to age and sex for
   example, then take random sample.
4. Cluster sampling:
      It results from 2 stage process. The
   population is divided into clusters, and a
   subset of the clusters is randomly
   selected.
Clusters are commonly based on geographic
   areas or districts.
Convenience sampling

Note: It is not always possible to
 take a random sample, e.g. a busy
 physician who wants to make a
 study on 50 patients attending
 the out-patient clinic. This is
 called a convenience sampling
 (non random).

Stat 1 variables & sampling

  • 1.
    Bio-Statistics Prepared by: Assistant Prof. Namir Al-Tawil
  • 2.
    Definition of statistics Itis the science that is concerned with collection, organization, summarization, and analysis of data; then drawing of inferences about a body of data when only a part of data is observed.
  • 3.
    Data  Are the raw material of statistics.  Simply defined as numbers.  Two main kinds of data: – Result from measurement (such as body weight). – Result from counting (such as No. of patients discharged).  Each No. is called datum.
  • 4.
    Sources of data  Routinely kept records. E.g.: hospital medical records.  Surveys.  Experiments.  External sources. E.g.: published reports, data banks, research literature.
  • 5.
    Definitions:  Biostatistics: A termused when the data analyzed are derived from biological sciences and medicine.  Variable: The characteristic takes different values in different persons, places or things, so we label a characteristic as variable. E.g. : blood pressure, weight, height,
  • 6.
    Definitions:  Quantitative variable Avariable that can be measured in the usual sense. E.g.: Weight of pre-school children, age of patients ……  Qualitative variable Can not be measured as the quantitative variable, e.g. ethnic group, possessing a characteristic or not such as smokers and non-smokers. Here we use frequencies falling in each category of the variable.
  • 7.
    Classification of variables: Randomvariable : Results only by chance factors i.e. can not be predicted. I. Classification based on GAPPINESS  Continuous random variable Does not possess gaps. E.g. height and weight.  Discrete random variable Characterized by gaps or interruptions in the values that it can assume. E.g. No. of admissions per day, or No. of missing teeth.  Categorical (e.g. sex and blood groups).  Numerical discrete (No. of episodes of angina).
  • 8.
    Classification, cont. Note: To summarizediscrete variables we measure the proportion of individuals falling within each category. For continuous variables we need measures of central tendency and measures of dispersion. II.Classification by DESCRIPTIVE ORIENTATION  Independent variable: Is a factor that we are interested to study. E.g. meat intake in grams per day.  Dependent variable (outcome variable): Is the factor observed or measured for different categories of the independent variable. E.g. hypercholesterolemia.
  • 9.
    III. Classification bylevels of measurement  The nominal scale: Consists of classifying the observations into various mutually exclusive categories. E.g. males & females.  The ordinal scale: Observations are ranked according to some criterion, e.g. patients status on discharge from hospital (unimproved, improved, much improved).
  • 10.
    Levels of measurements,cont.  The numerical scale Sometimes called quantitative observations. There are two types of numerical scales: 1.Interval or continuous scales e.g. age. 2.Discrete scales (e.g. No. of pregnancies). Means and standard deviations are generally used to summarize the values of numerical measures.
  • 11.
    Definitions Population: The largest collectionof entities for which we have an interest at a particular time. Sample: Part of a population.
  • 12.
    Random (probability) Sampling methods 1.Simple random sampling: Use random number table. (see next slide).
  • 14.
    Random (probability) Sampling methods 2. Systematic sampling: Include individuals at regular intervals. E.g. individuals No. 4, 7, 10, 13, …. Will be included. The interval in this example is (3), measured by dividing the No. of the population by the required sample. E.g. 60/20. The starting point must be chosen randomly.
  • 15.
    Random (probability) Sampling methods 3. Stratified sampling: Divide into subgroups according to age and sex for example, then take random sample. 4. Cluster sampling: It results from 2 stage process. The population is divided into clusters, and a subset of the clusters is randomly selected. Clusters are commonly based on geographic areas or districts.
  • 16.
    Convenience sampling Note: Itis not always possible to take a random sample, e.g. a busy physician who wants to make a study on 50 patients attending the out-patient clinic. This is called a convenience sampling (non random).