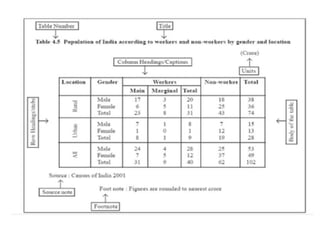
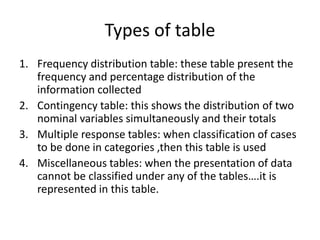
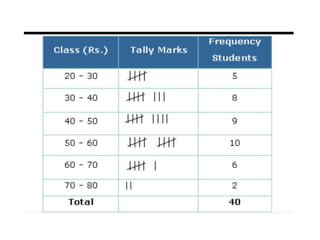
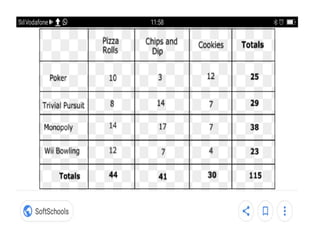
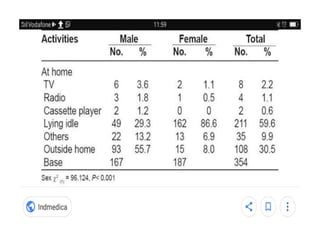
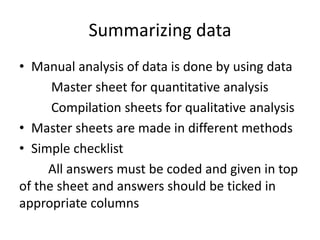
Data processing and analysis
Introduction
• Data analysis and processing are two different
process
• DA is a process of inspecting, cleansing,
transforming and modelling data with the goal
of discovering useful information and
conclusion
• DP refers to the process of regrouping or
rearranging the sorted data which was
analysed previously.
Steps in data processing
• Identifying data
• Editing
• Coding and classification
• Data transcription
• Tabulation
• Summarization
Steps in data processing
1. Identifying data structures
- data format can be identified and
arranged by using different software or
manually
Eg. SAS (statistical analysis system) or
SPSS(statistical package for social science)
Microsoft Excel
Minitab
• 2. Editing of data: it is done at two levels
- at the time of recording (Field editing)
- at the time of data analysis(Central editing)
• Data editing ensure the following things
• Completeness
• Accuracy
• uniformity
3. Coding
Coding refers to the process of translating
answers into a form of numbers
Coding may be numeric , alphabetic and zero
coding
Classification :
• Data having common characteristics are
placed in one class. In this way the entire data
is classified into different groups
• Different types of classification:
• 1. according to attributes. i.e. age, sex, area,
education etc
• 2. According to class intervals
4. Data transcription
• The collected data are easily transferred into
data sheets
• Two types of transcriptions used
• 1. Manual transcription
• 2. Computerized transcription
5. Tabulation
• Tabulation implies tabular representation of data
• Parts of table:
• Table number
• Subheads
• Caption and stubs
• Body of table
• Foot notes
• Source note
Types of table
1. Frequency distribution table: these table present the
frequency and percentage distribution of the
information collected
2. Contingency table: this shows the distribution of two
nominal variables simultaneously and their totals
3. Multiple response tables: when classification of cases
to be done in categories ,then this table is used
4. Miscellaneous tables: when the presentation of data
cannot be classified under any of the tables….it is
represented in this table.
6. Summarization
• Manual data sheets
• Computerized data sheets
• Compilation sheets
• Matrices
• Figures
• Tables
• Graphs
Summarizing data
• Manual analysis of data is done by using data
Master sheet for quantitative analysis
Compilation sheets for qualitative analysis
• Master sheets are made in different methods
• Simple checklist
All answers must be coded and given in top
of the sheet and answers should be ticked in
appropriate columns
• Compilation sheets
• In this the topics are categorised under
different categories and sub headings
• Other
Data processing and analysis

Data processing and analysis

  • 1.
  • 2.
    Introduction • Data analysisand processing are two different process • DA is a process of inspecting, cleansing, transforming and modelling data with the goal of discovering useful information and conclusion • DP refers to the process of regrouping or rearranging the sorted data which was analysed previously.
  • 3.
    Steps in dataprocessing • Identifying data • Editing • Coding and classification • Data transcription • Tabulation • Summarization
  • 4.
    Steps in dataprocessing 1. Identifying data structures - data format can be identified and arranged by using different software or manually Eg. SAS (statistical analysis system) or SPSS(statistical package for social science) Microsoft Excel Minitab
  • 5.
    • 2. Editingof data: it is done at two levels - at the time of recording (Field editing) - at the time of data analysis(Central editing) • Data editing ensure the following things • Completeness • Accuracy • uniformity
  • 6.
    3. Coding Coding refersto the process of translating answers into a form of numbers Coding may be numeric , alphabetic and zero coding
  • 7.
    Classification : • Datahaving common characteristics are placed in one class. In this way the entire data is classified into different groups • Different types of classification: • 1. according to attributes. i.e. age, sex, area, education etc • 2. According to class intervals
  • 8.
    4. Data transcription •The collected data are easily transferred into data sheets • Two types of transcriptions used • 1. Manual transcription • 2. Computerized transcription
  • 9.
    5. Tabulation • Tabulationimplies tabular representation of data • Parts of table: • Table number • Subheads • Caption and stubs • Body of table • Foot notes • Source note
  • 11.
    Types of table 1.Frequency distribution table: these table present the frequency and percentage distribution of the information collected 2. Contingency table: this shows the distribution of two nominal variables simultaneously and their totals 3. Multiple response tables: when classification of cases to be done in categories ,then this table is used 4. Miscellaneous tables: when the presentation of data cannot be classified under any of the tables….it is represented in this table.
  • 15.
    6. Summarization • Manualdata sheets • Computerized data sheets • Compilation sheets • Matrices • Figures • Tables • Graphs
  • 16.
    Summarizing data • Manualanalysis of data is done by using data Master sheet for quantitative analysis Compilation sheets for qualitative analysis • Master sheets are made in different methods • Simple checklist All answers must be coded and given in top of the sheet and answers should be ticked in appropriate columns
  • 17.
    • Compilation sheets •In this the topics are categorised under different categories and sub headings • Other