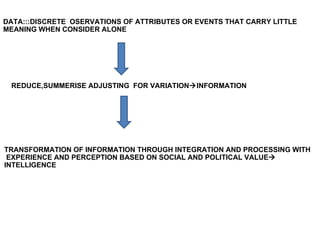
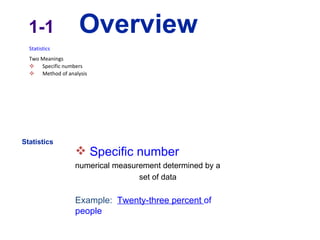
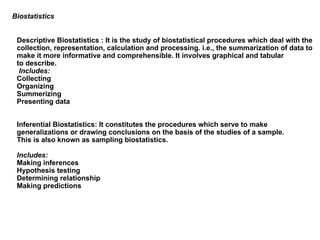
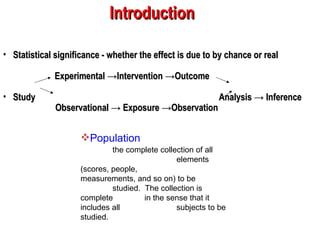
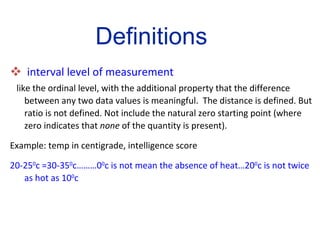
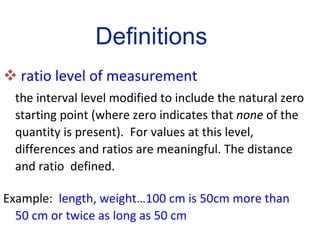
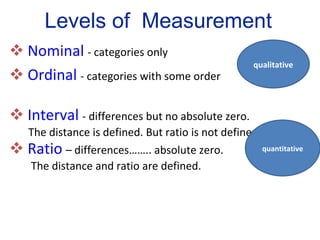
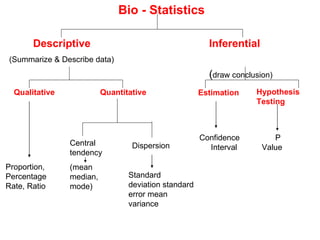
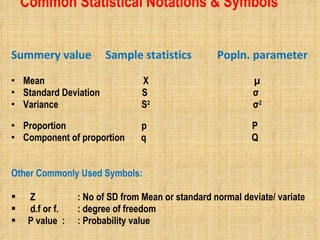
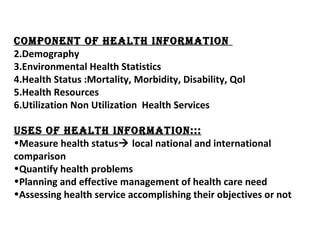
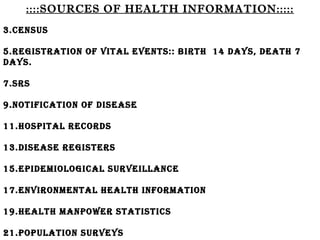
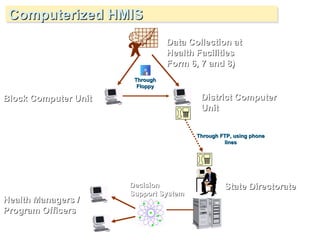
E LEMENTARY Chapter 1  Introduction to Bio-Statistics Chapter 1  Introduction to Statistics
 
DATA:::DISCRETE  OSERVATIONS OF ATTRIBUTES OR EVENTS THAT CARRY LITTLE MEANING WHEN CONSIDER ALONE REDUCE,SUMMERISE ADJUSTING  FOR VARIATION  INFORMATION TRANSFORMATION OF INFORMATION THROUGH INTEGRATION AND PROCESSING WITH EXPERIENCE AND PERCEPTION BASED ON SOCIAL AND POLITICAL VALUE  INTELLIGENCE
STATISTICS S - Scientific  method  for  T - tabulation A - analysis T -  testing  of  hypothesis  and I - inference S - study of  T - time trend I - in C - community S - set up
Statistics  Two Meanings Specific numbers Method of analysis Statistics 1-1  Overview Specific number numerical measurement determined by a  set of data Example:  Twenty-three percent  of people
Specific number numerical measurement determined by a  set of data Example:  Twenty-three percent  of people    Statistics
Method of analysis a collection of methods for planning  experiments, obtaining data, and then  then organizing, summarizing, presenting,  analyzing, interpreting, and drawing  conclusions based on the data Statistics
Biostatistics  is the application of statistical methods to the problems ofbiology, including human biology, medicine and public health  Descriptive Biostatistics : It is the study of biostatistical procedures which deal with the  collection, representation, calculation and processing. i.e., the summarization of data to  make it more informative and comprehensible. It involves graphical and tabular  to describe. Includes:  Collecting  Organizing  Summerizing  Presenting data  Inferential Biostatistics: It constitutes the procedures which serve to make  generalizations or drawing conclusions on the basis of the studies of a sample.  This is also known as sampling biostatistics.   Includes:  Making inferences  Hypothesis testing  Determining relationship  Making predictions
Statistical significance - whether the effect is due to by chance or real Experimental ->Intervention ->Outcome  Study  Analysis -> Inference   Observational -> Exposure ->Observation   Introduction Population   the complete collection of all  elements (scores, people,  measurements, and so on) to be  studied.  The collection is complete  in the sense that it includes all  subjects to be studied.
Definitions Population   the complete collection of all  elements (scores, people,  measurements, and so on) to be  studied.  The collection is complete  in the sense that it includes all  subjects to be studied.
Definitions Census the collection of data from  every   element in a population Sample   a subcollection of elements drawn  from a population
Parameter   a numerical measurement describing  some characteristic of a  population Definitions
Parameter   a numerical measurement describing  some characteristic of a  population population parameter Definitions
Definitions Statistic   a numerical measurement describing  some characteristic of a  sample
Definitions Statistic   a numerical measurement describing  some characteristic of a  sample sample statistic
Definitions Quantitative data  numbers representing counts or  measurements
Definitions Quantitative data  numbers representing counts or  measurements Qualitative  (or categorical or  attribute)  data can be separated into different categories  that are distinguished by some nonnumeric  characteristics
Definitions Quantitative data  the incomes of college graduates
Definitions Quantitative data  the incomes of college graduates Qualitative  (or categorical or  attribute)  data the genders (male/female) of college  graduates
Discrete   data result when the number of possible values is either a finite number or a ‘countable’ number of possible values 0, 1, 2, 3, . . . Definitions
Discrete   data result when the number of possible values is either a finite number or a ‘countable’ number of  possible values 0, 1, 2, 3, . . . Continuous (numerical) data result from infinitely many possible  values that correspond to some continuous scale  that covers a range of values without gaps. Definitions 2 3
Discrete   The number of eggs that hens lay; for  example, 3 eggs a day.  Definitions
Discrete   The number of eggs that hens lay; for example, 3 eggs a day.  Continuous The amounts of milk that cows produce; for example, 2.343115 gallons a day. Definitions
nominal level of measurement   characterized by data that consist of names, labels, or categories only.  The data  cannot  be  arranged in an ordering scheme (such as low to high) Example:  survey responses yes, no, undecided Definitions
ordinal level of measurement   involves data that may be arranged in some order, but differences between data values either cannot be determined or are meaningless Example:  Course grades A, B, C, D, or F Definitions
interval level of measurement   like the ordinal level, with the additional property that the difference between any two data values is meaningful.  The distance is defined. But ratio is not defined. Not include the natural zero starting point (where zero indicates that  none  of the quantity is present).  Example: temp in centigrade, intelligence score 20-25 0 c =30-35 0 c………0 0 c is not mean the absence of heat…20 0 c is not twice as hot as 10 0 c Definitions
ratio level of measurement the interval level modified to include the natural zero starting point (where zero indicates that  none  of the quantity is present).  For values at this level, differences and ratios are meaningful. The distance and ratio  defined.  Example:  length, weight…100 cm is 50cm more than 50 cm or twice as long as 50 cm Definitions
Nominal   - categories only Ordinal   - categories with some order Interval   - differences but no absolute zero. The distance is defined. But ratio is not defined. Ratio   – differences…….. absolute zero. The distance and ratio are defined. Levels of  Measurement qualitative quantitative
Bio - Statistics Descriptive (Summarize & Describe data) Inferential  ( draw conclusion) Qualitative  Quantitative Estimation Hypothesis Testing Confidence  Interval P  Value Proportion, Percentage Rate, Ratio Central tendency  (mean median, mode) Dispersion Standard deviation standard error mean variance
Common Statistical Notations & Symbols  Summery value  Sample statistics  Popln. parameter  Mean  X  µ Standard Deviation  S  σ Variance   S 2   σ 2   Proportion   p  P Component of proportion  q  Q Other Commonly Used Symbols:  Z   : No of SD from Mean or standard normal deviate/ variate d.f or f.   : degree of freedom P value  :   : Probability value
DATA  REDUCE,SUMMERISE ADJUSTING  FOR VARIATION  INFORMATION COMPONENT OF HEALTH INFORMATION  Demography Environmental Health Statistics Health Status :Mortality, Morbidity, Disability, Qol Health Resources Utilization Non Utilization  Health Services USES OF HEALTH INFORMATION::: Measure health status   local national and international comparison Quantify health problems Planning and effective management of health care need Assessing health service accomplishing their objectives or not
::::SOURCES OF HEALTH INFORMATION::::: Census Registration Of Vital Events:: Birth  14 Days, Death 7 Days. Srs Notification Of Disease Hospital Records Disease Registers Epidemiological Surveillance Environmental Health Information Health Manpower Statistics Population Surveys
Health Management Information System (HMIS) A computerised information system (HMIS) has been installed in nearly all districts in India . Data from SC, PHC, CHC and Hospitals is available for reporting, supervision, planning  and analysis  BEFORE Summary of data was calculated by hand and therefore prone to errors Long delay to produce reports
Computerized HMIS Data Collection at Health Facilities Form 6, 7 and 8) District Computer Unit Block Computer Unit Decision Support System State Directorate Health Managers / Program Officers Through Floppy Through FTP, using phone lines

Bio stat

  • 1.
    E LEMENTARY Chapter1 Introduction to Bio-Statistics Chapter 1 Introduction to Statistics
  • 2.
  • 3.
    DATA:::DISCRETE OSERVATIONSOF ATTRIBUTES OR EVENTS THAT CARRY LITTLE MEANING WHEN CONSIDER ALONE REDUCE,SUMMERISE ADJUSTING FOR VARIATION  INFORMATION TRANSFORMATION OF INFORMATION THROUGH INTEGRATION AND PROCESSING WITH EXPERIENCE AND PERCEPTION BASED ON SOCIAL AND POLITICAL VALUE  INTELLIGENCE
  • 4.
    STATISTICS S -Scientific method for T - tabulation A - analysis T - testing of hypothesis and I - inference S - study of T - time trend I - in C - community S - set up
  • 5.
    Statistics TwoMeanings Specific numbers Method of analysis Statistics 1-1 Overview Specific number numerical measurement determined by a set of data Example: Twenty-three percent of people
  • 6.
    Specific number numericalmeasurement determined by a set of data Example: Twenty-three percent of people Statistics
  • 7.
    Method of analysisa collection of methods for planning experiments, obtaining data, and then then organizing, summarizing, presenting, analyzing, interpreting, and drawing conclusions based on the data Statistics
  • 8.
    Biostatistics isthe application of statistical methods to the problems ofbiology, including human biology, medicine and public health Descriptive Biostatistics : It is the study of biostatistical procedures which deal with the collection, representation, calculation and processing. i.e., the summarization of data to make it more informative and comprehensible. It involves graphical and tabular to describe. Includes: Collecting Organizing Summerizing Presenting data Inferential Biostatistics: It constitutes the procedures which serve to make generalizations or drawing conclusions on the basis of the studies of a sample. This is also known as sampling biostatistics.   Includes: Making inferences Hypothesis testing Determining relationship Making predictions
  • 9.
    Statistical significance -whether the effect is due to by chance or real Experimental ->Intervention ->Outcome Study Analysis -> Inference Observational -> Exposure ->Observation Introduction Population the complete collection of all elements (scores, people, measurements, and so on) to be studied. The collection is complete in the sense that it includes all subjects to be studied.
  • 10.
    Definitions Population the complete collection of all elements (scores, people, measurements, and so on) to be studied. The collection is complete in the sense that it includes all subjects to be studied.
  • 11.
    Definitions Census thecollection of data from every element in a population Sample a subcollection of elements drawn from a population
  • 12.
    Parameter a numerical measurement describing some characteristic of a population Definitions
  • 13.
    Parameter a numerical measurement describing some characteristic of a population population parameter Definitions
  • 14.
    Definitions Statistic a numerical measurement describing some characteristic of a sample
  • 15.
    Definitions Statistic a numerical measurement describing some characteristic of a sample sample statistic
  • 16.
    Definitions Quantitative data numbers representing counts or measurements
  • 17.
    Definitions Quantitative data numbers representing counts or measurements Qualitative (or categorical or attribute) data can be separated into different categories that are distinguished by some nonnumeric characteristics
  • 18.
    Definitions Quantitative data the incomes of college graduates
  • 19.
    Definitions Quantitative data the incomes of college graduates Qualitative (or categorical or attribute) data the genders (male/female) of college graduates
  • 20.
    Discrete data result when the number of possible values is either a finite number or a ‘countable’ number of possible values 0, 1, 2, 3, . . . Definitions
  • 21.
    Discrete data result when the number of possible values is either a finite number or a ‘countable’ number of possible values 0, 1, 2, 3, . . . Continuous (numerical) data result from infinitely many possible values that correspond to some continuous scale that covers a range of values without gaps. Definitions 2 3
  • 22.
    Discrete The number of eggs that hens lay; for example, 3 eggs a day. Definitions
  • 23.
    Discrete The number of eggs that hens lay; for example, 3 eggs a day. Continuous The amounts of milk that cows produce; for example, 2.343115 gallons a day. Definitions
  • 24.
    nominal level ofmeasurement characterized by data that consist of names, labels, or categories only. The data cannot be arranged in an ordering scheme (such as low to high) Example: survey responses yes, no, undecided Definitions
  • 25.
    ordinal level ofmeasurement involves data that may be arranged in some order, but differences between data values either cannot be determined or are meaningless Example: Course grades A, B, C, D, or F Definitions
  • 26.
    interval level ofmeasurement like the ordinal level, with the additional property that the difference between any two data values is meaningful. The distance is defined. But ratio is not defined. Not include the natural zero starting point (where zero indicates that none of the quantity is present). Example: temp in centigrade, intelligence score 20-25 0 c =30-35 0 c………0 0 c is not mean the absence of heat…20 0 c is not twice as hot as 10 0 c Definitions
  • 27.
    ratio level ofmeasurement the interval level modified to include the natural zero starting point (where zero indicates that none of the quantity is present). For values at this level, differences and ratios are meaningful. The distance and ratio defined. Example: length, weight…100 cm is 50cm more than 50 cm or twice as long as 50 cm Definitions
  • 28.
    Nominal - categories only Ordinal - categories with some order Interval - differences but no absolute zero. The distance is defined. But ratio is not defined. Ratio – differences…….. absolute zero. The distance and ratio are defined. Levels of Measurement qualitative quantitative
  • 29.
    Bio - StatisticsDescriptive (Summarize & Describe data) Inferential ( draw conclusion) Qualitative Quantitative Estimation Hypothesis Testing Confidence Interval P Value Proportion, Percentage Rate, Ratio Central tendency (mean median, mode) Dispersion Standard deviation standard error mean variance
  • 30.
    Common Statistical Notations& Symbols Summery value Sample statistics Popln. parameter Mean X µ Standard Deviation S σ Variance S 2 σ 2 Proportion p P Component of proportion q Q Other Commonly Used Symbols: Z : No of SD from Mean or standard normal deviate/ variate d.f or f. : degree of freedom P value : : Probability value
  • 31.
    DATA  REDUCE,SUMMERISEADJUSTING FOR VARIATION  INFORMATION COMPONENT OF HEALTH INFORMATION Demography Environmental Health Statistics Health Status :Mortality, Morbidity, Disability, Qol Health Resources Utilization Non Utilization Health Services USES OF HEALTH INFORMATION::: Measure health status  local national and international comparison Quantify health problems Planning and effective management of health care need Assessing health service accomplishing their objectives or not
  • 32.
    ::::SOURCES OF HEALTHINFORMATION::::: Census Registration Of Vital Events:: Birth 14 Days, Death 7 Days. Srs Notification Of Disease Hospital Records Disease Registers Epidemiological Surveillance Environmental Health Information Health Manpower Statistics Population Surveys
  • 33.
    Health Management InformationSystem (HMIS) A computerised information system (HMIS) has been installed in nearly all districts in India . Data from SC, PHC, CHC and Hospitals is available for reporting, supervision, planning and analysis BEFORE Summary of data was calculated by hand and therefore prone to errors Long delay to produce reports
  • 34.
    Computerized HMIS DataCollection at Health Facilities Form 6, 7 and 8) District Computer Unit Block Computer Unit Decision Support System State Directorate Health Managers / Program Officers Through Floppy Through FTP, using phone lines

Editor's Notes

  • #8 page 4 of text
  • #12 Emphasize that a population is determined by the researcher, and a sample is a subcollection of that pre-determined group. For example, if I collect the ages from a section of elementary statistics students, that data would be a sample if I am interested in studying ages of all elementary statistics students. However, if I am studying only the ages of the specific section of elementary statistics, the data would be a population.
  • #13 page 5 of text
  • #17 page 6 of text
  • #22 Understanding the difference between discrete versus continuous data will be important in Chapters 4 and 5. When measuring data that is continuous, the result will be only as precise as the measuring device being used to measure.
  • #25 page 7 of text
  • #26 Understanding the differences between the levels of data will help students later in determining what type of statistical tests to use. Nominal and ordinal data should not be used for calculations (even when assigned ‘numbers’ for computerization) as differences and magnitudes of differences are meaningless.
  • #27 Students usually have some difficulty understanding the difference between interval and ratio data. Fortunately, interval data occurs in very few instances.
  • #29 review of four levels of measurement