Downloaded 1,225 times


![Company Board and CEO Business continuity management board BCM project team (and leader) direct project ensure appropriate resources ensure quality [Departmental] working group [Departmental] working group Risk register](https://image.slidesharecdn.com/cfakepathriskassessmentandreduction-090908064542-phpapp02/75/Risk-Assessment-and-Reduction-74-2048.jpg)

![emergency-planning.blogspot.com [email_address] Thank you for your attention! www.terrapublishing.net](https://image.slidesharecdn.com/cfakepathriskassessmentandreduction-090908064542-phpapp02/75/Risk-Assessment-and-Reduction-103-2048.jpg)

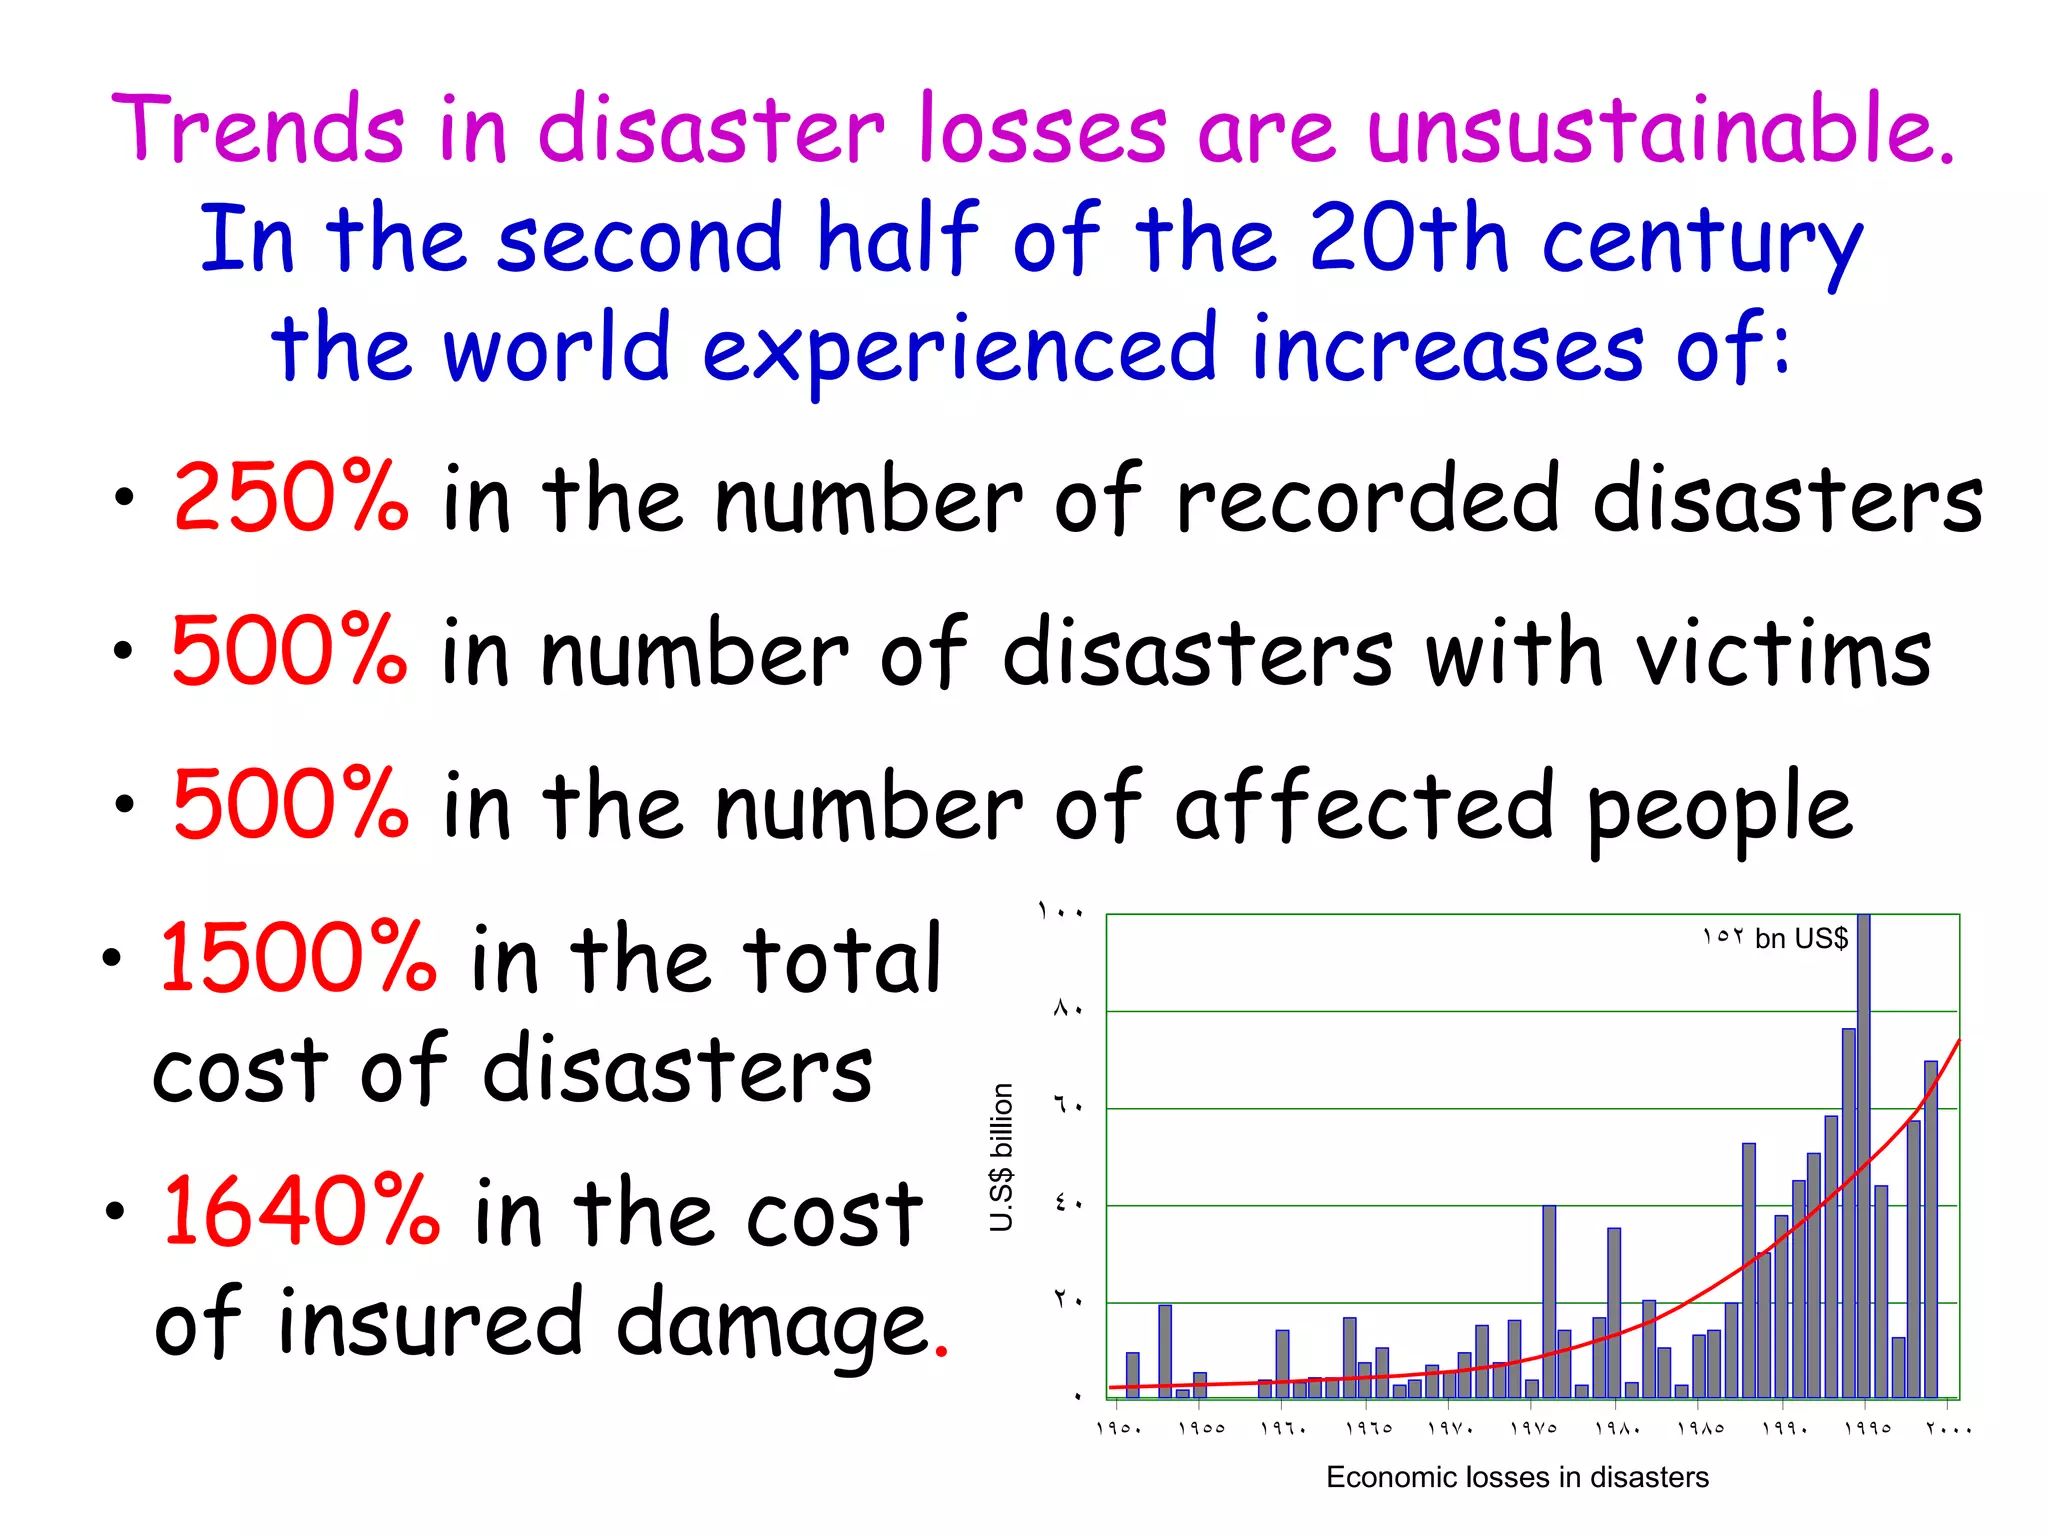
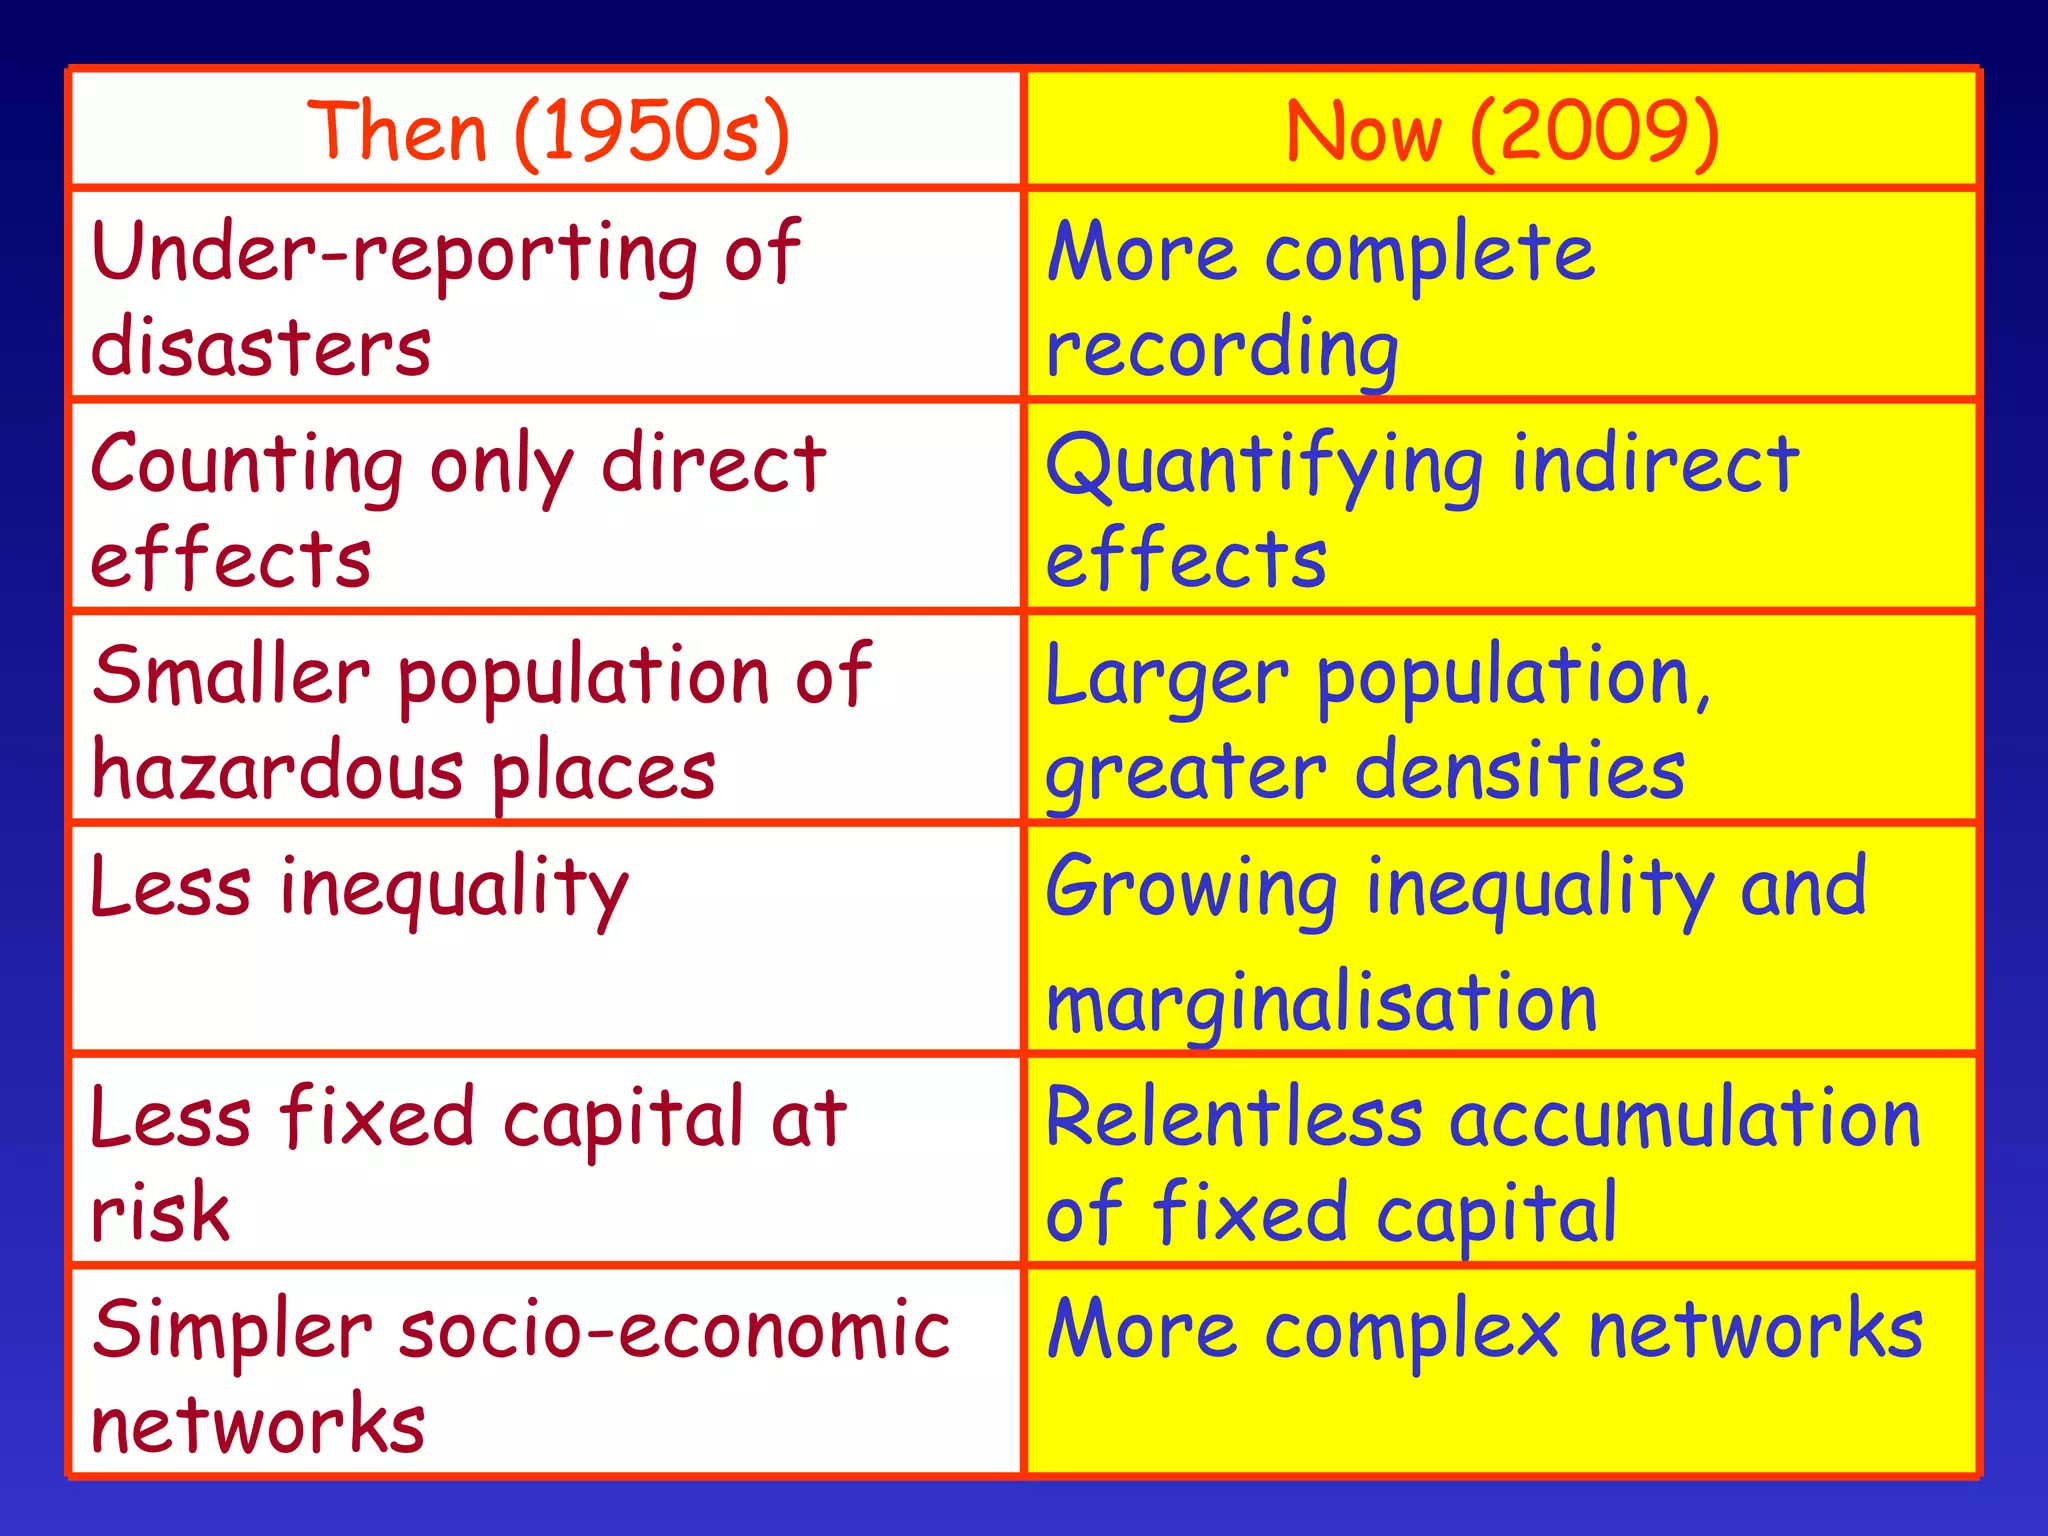
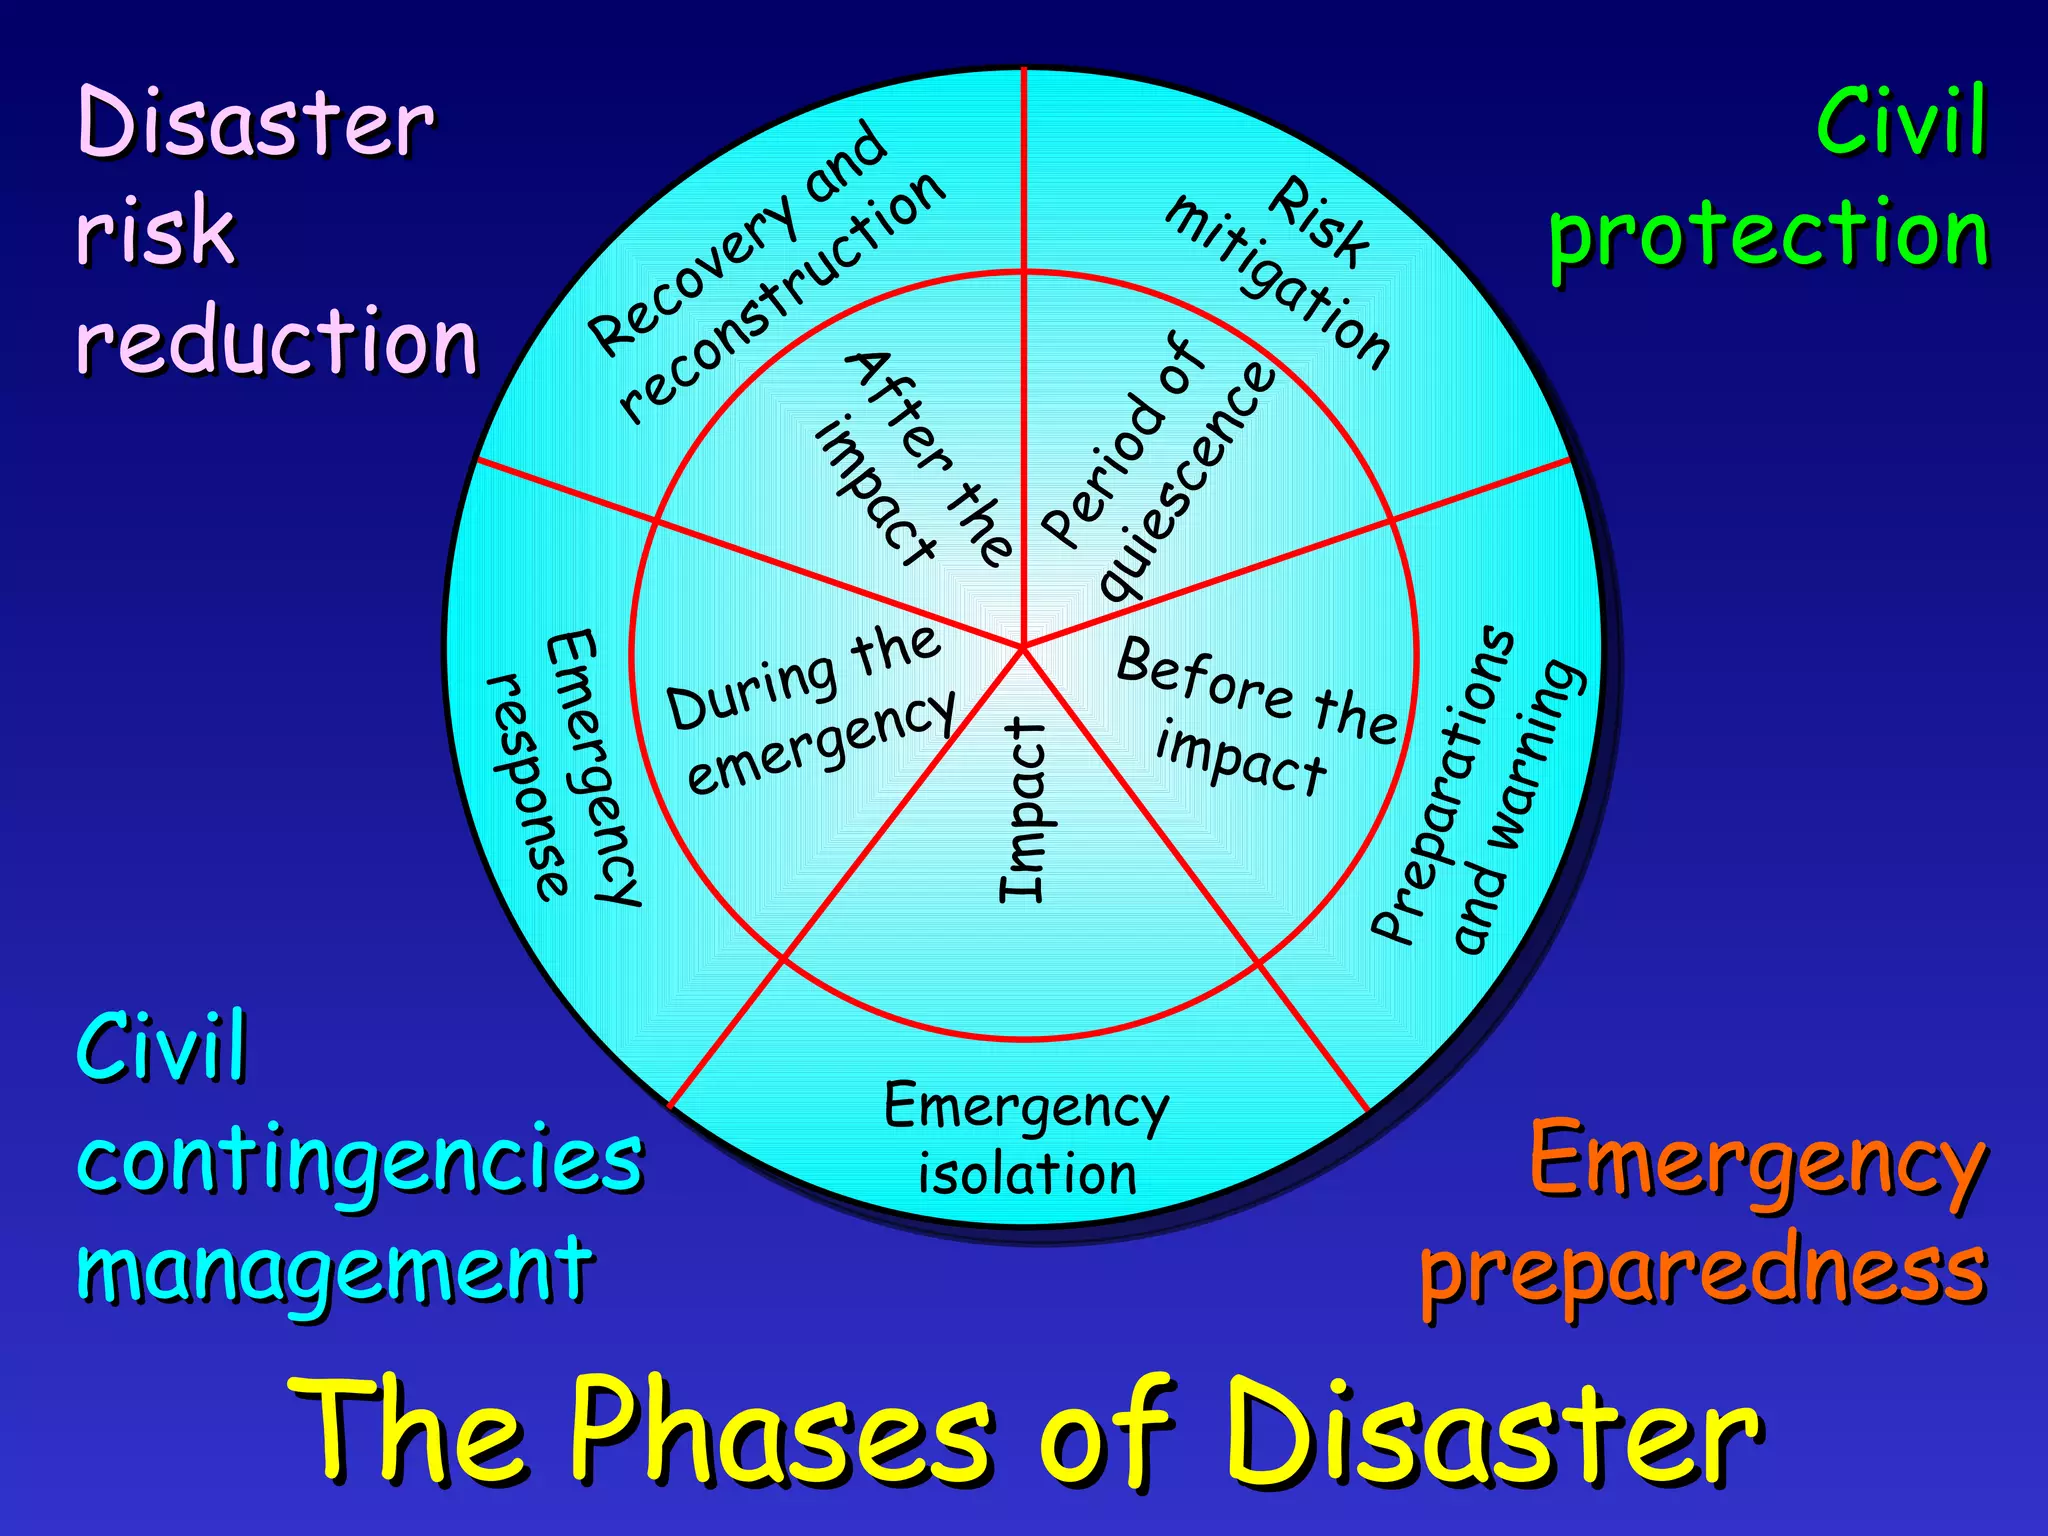
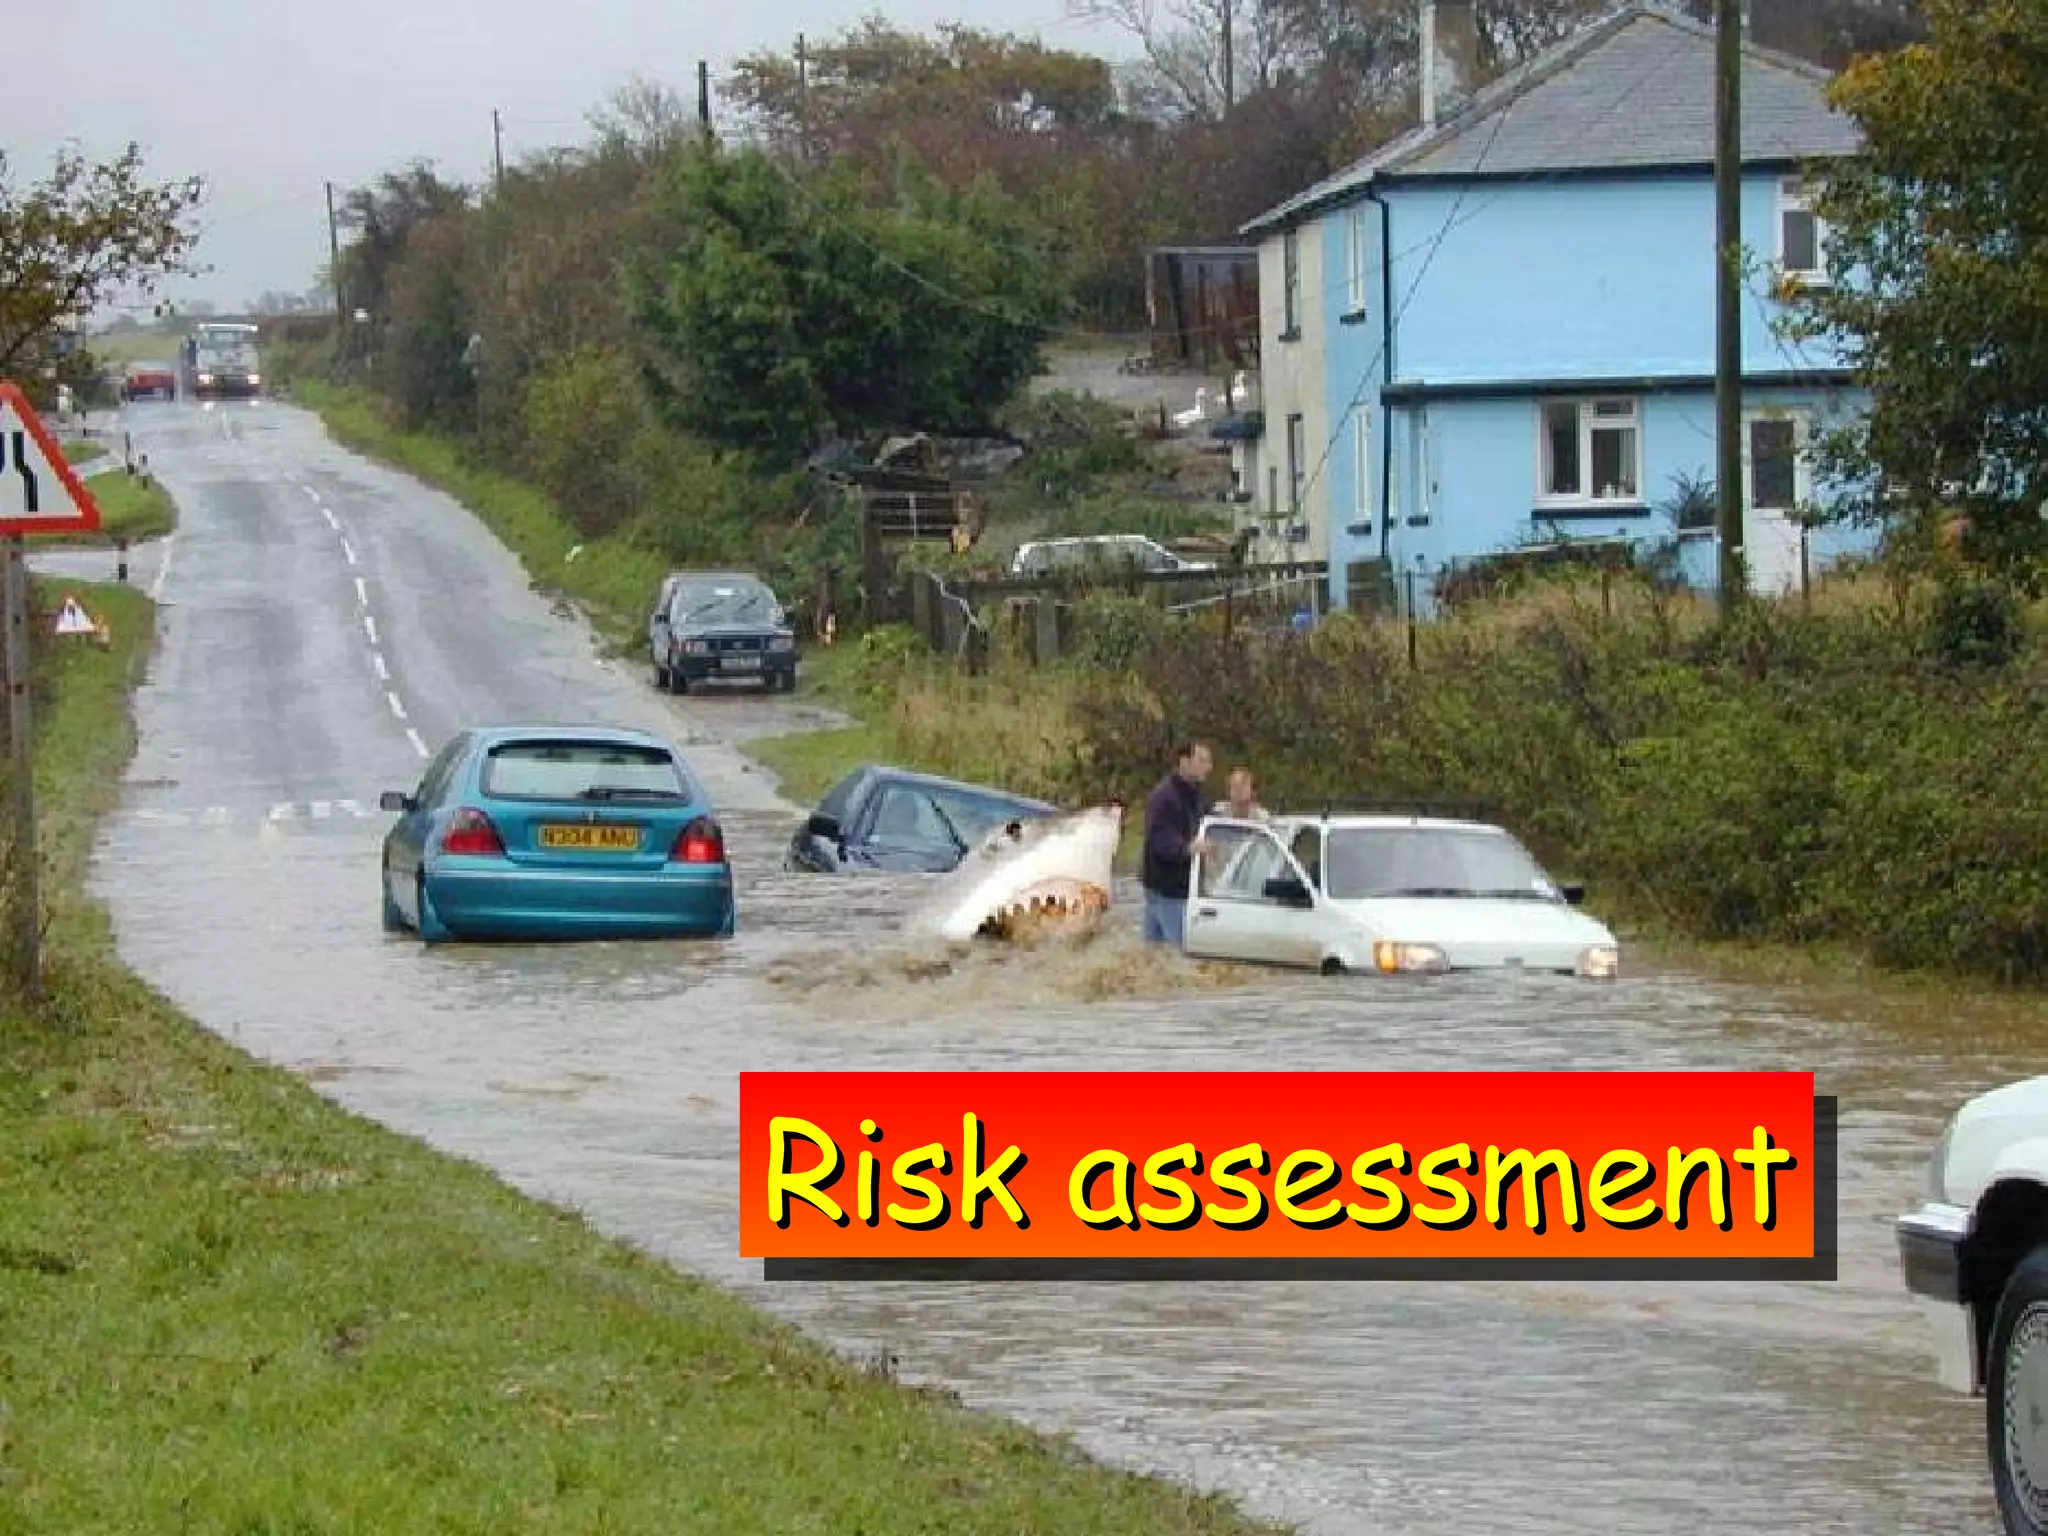
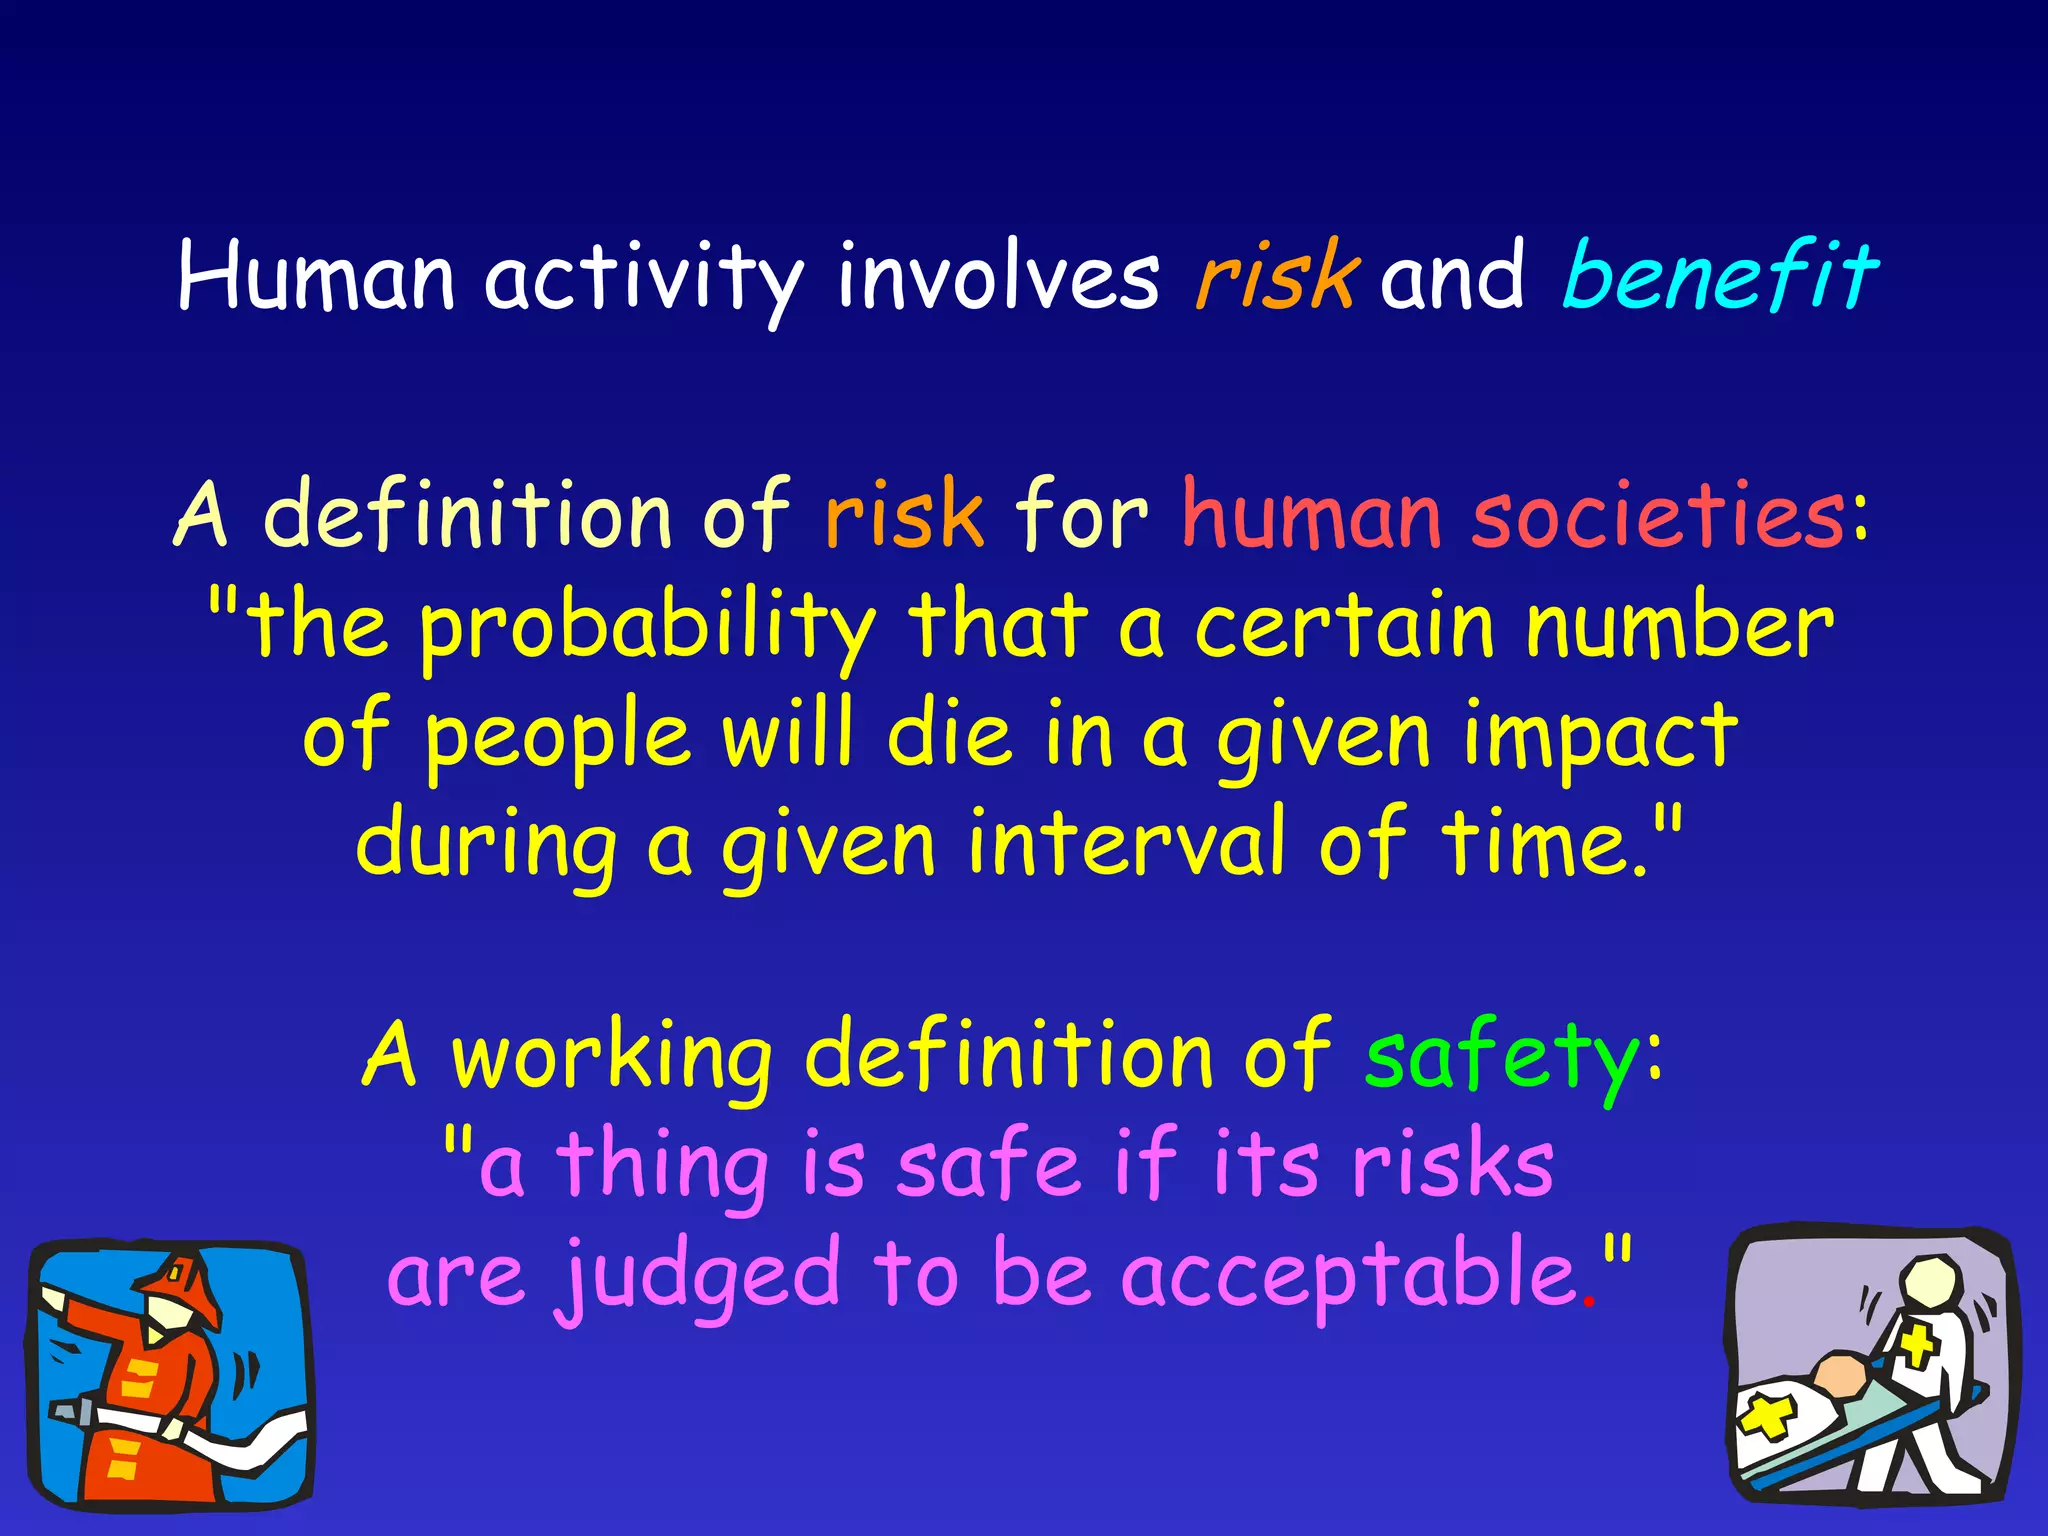
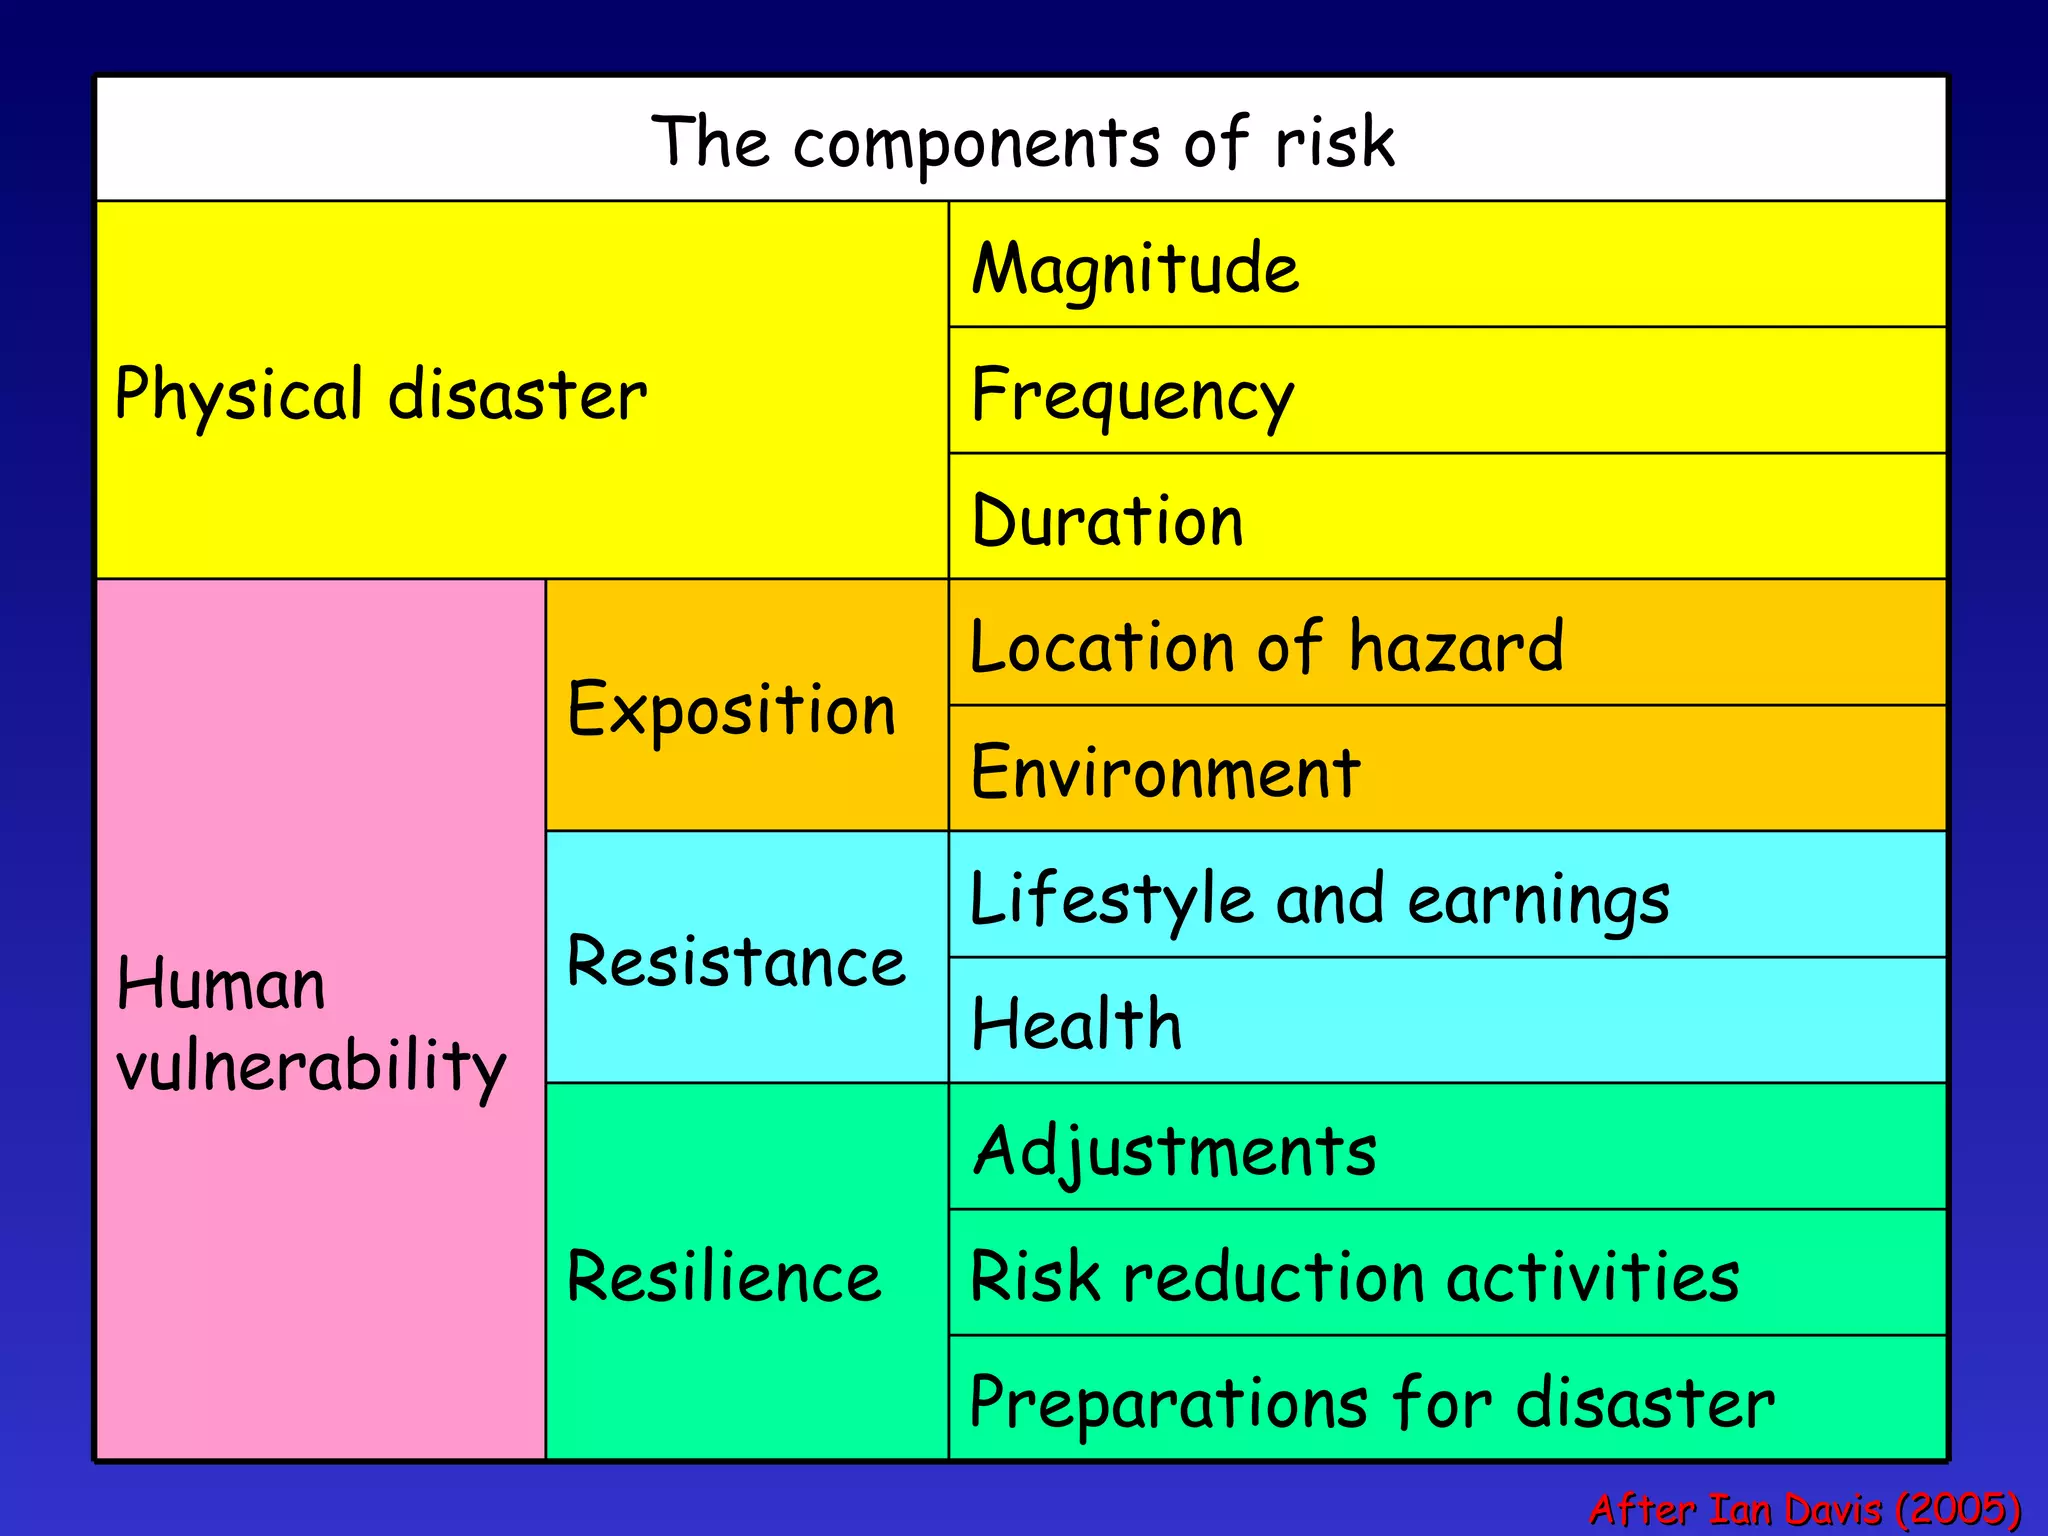
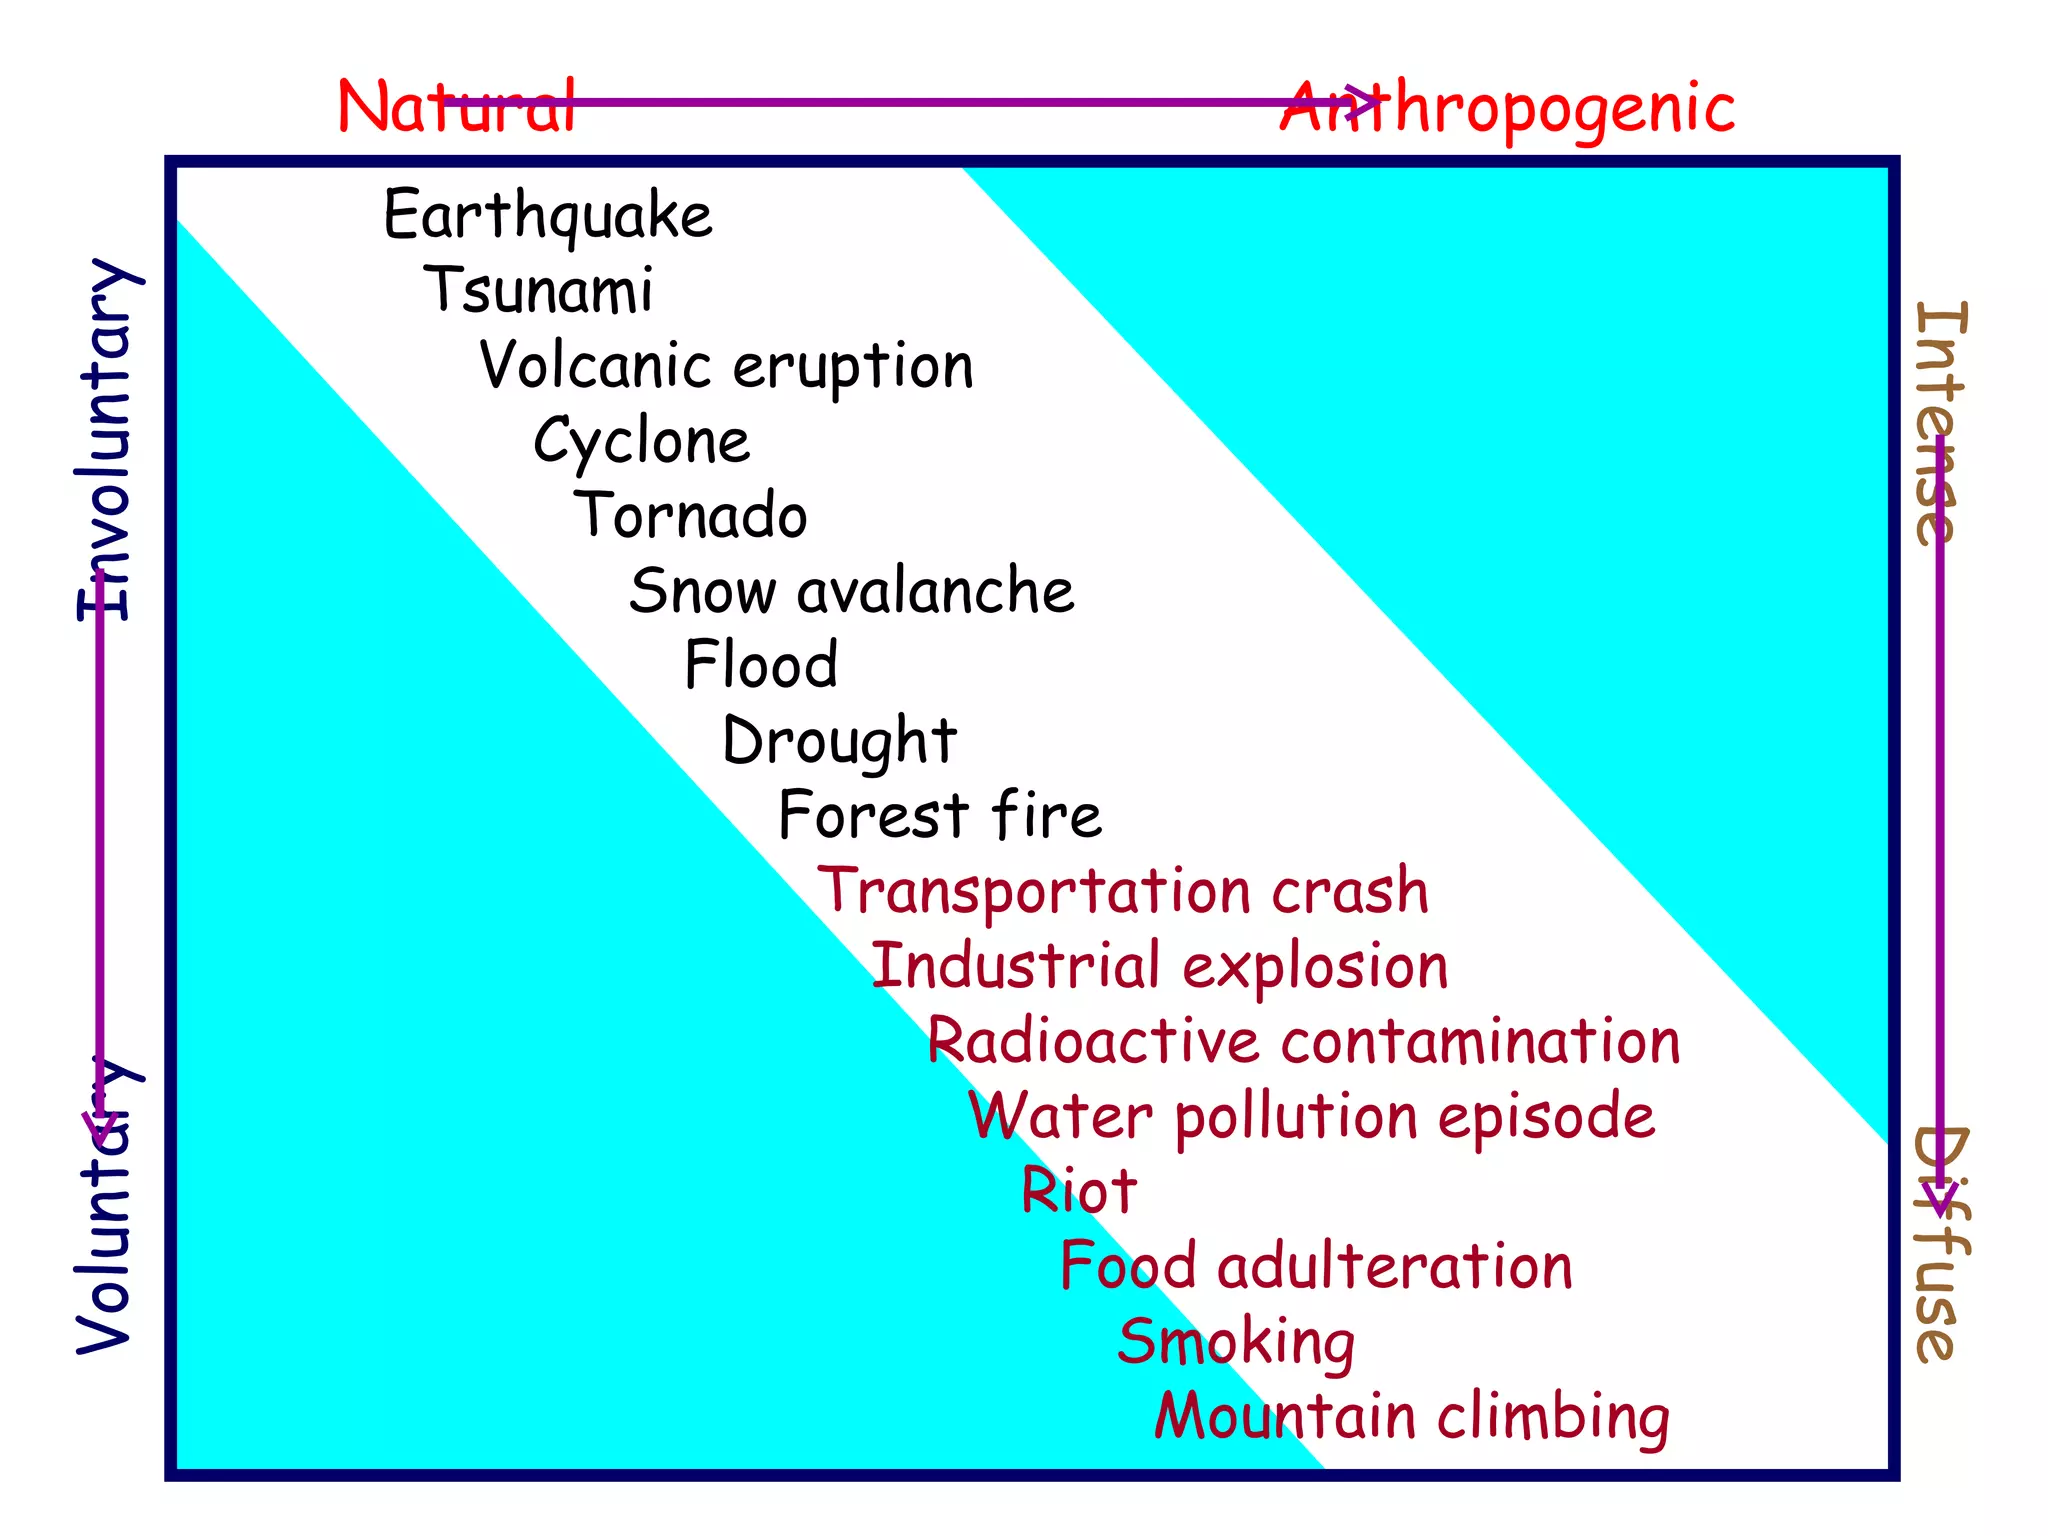
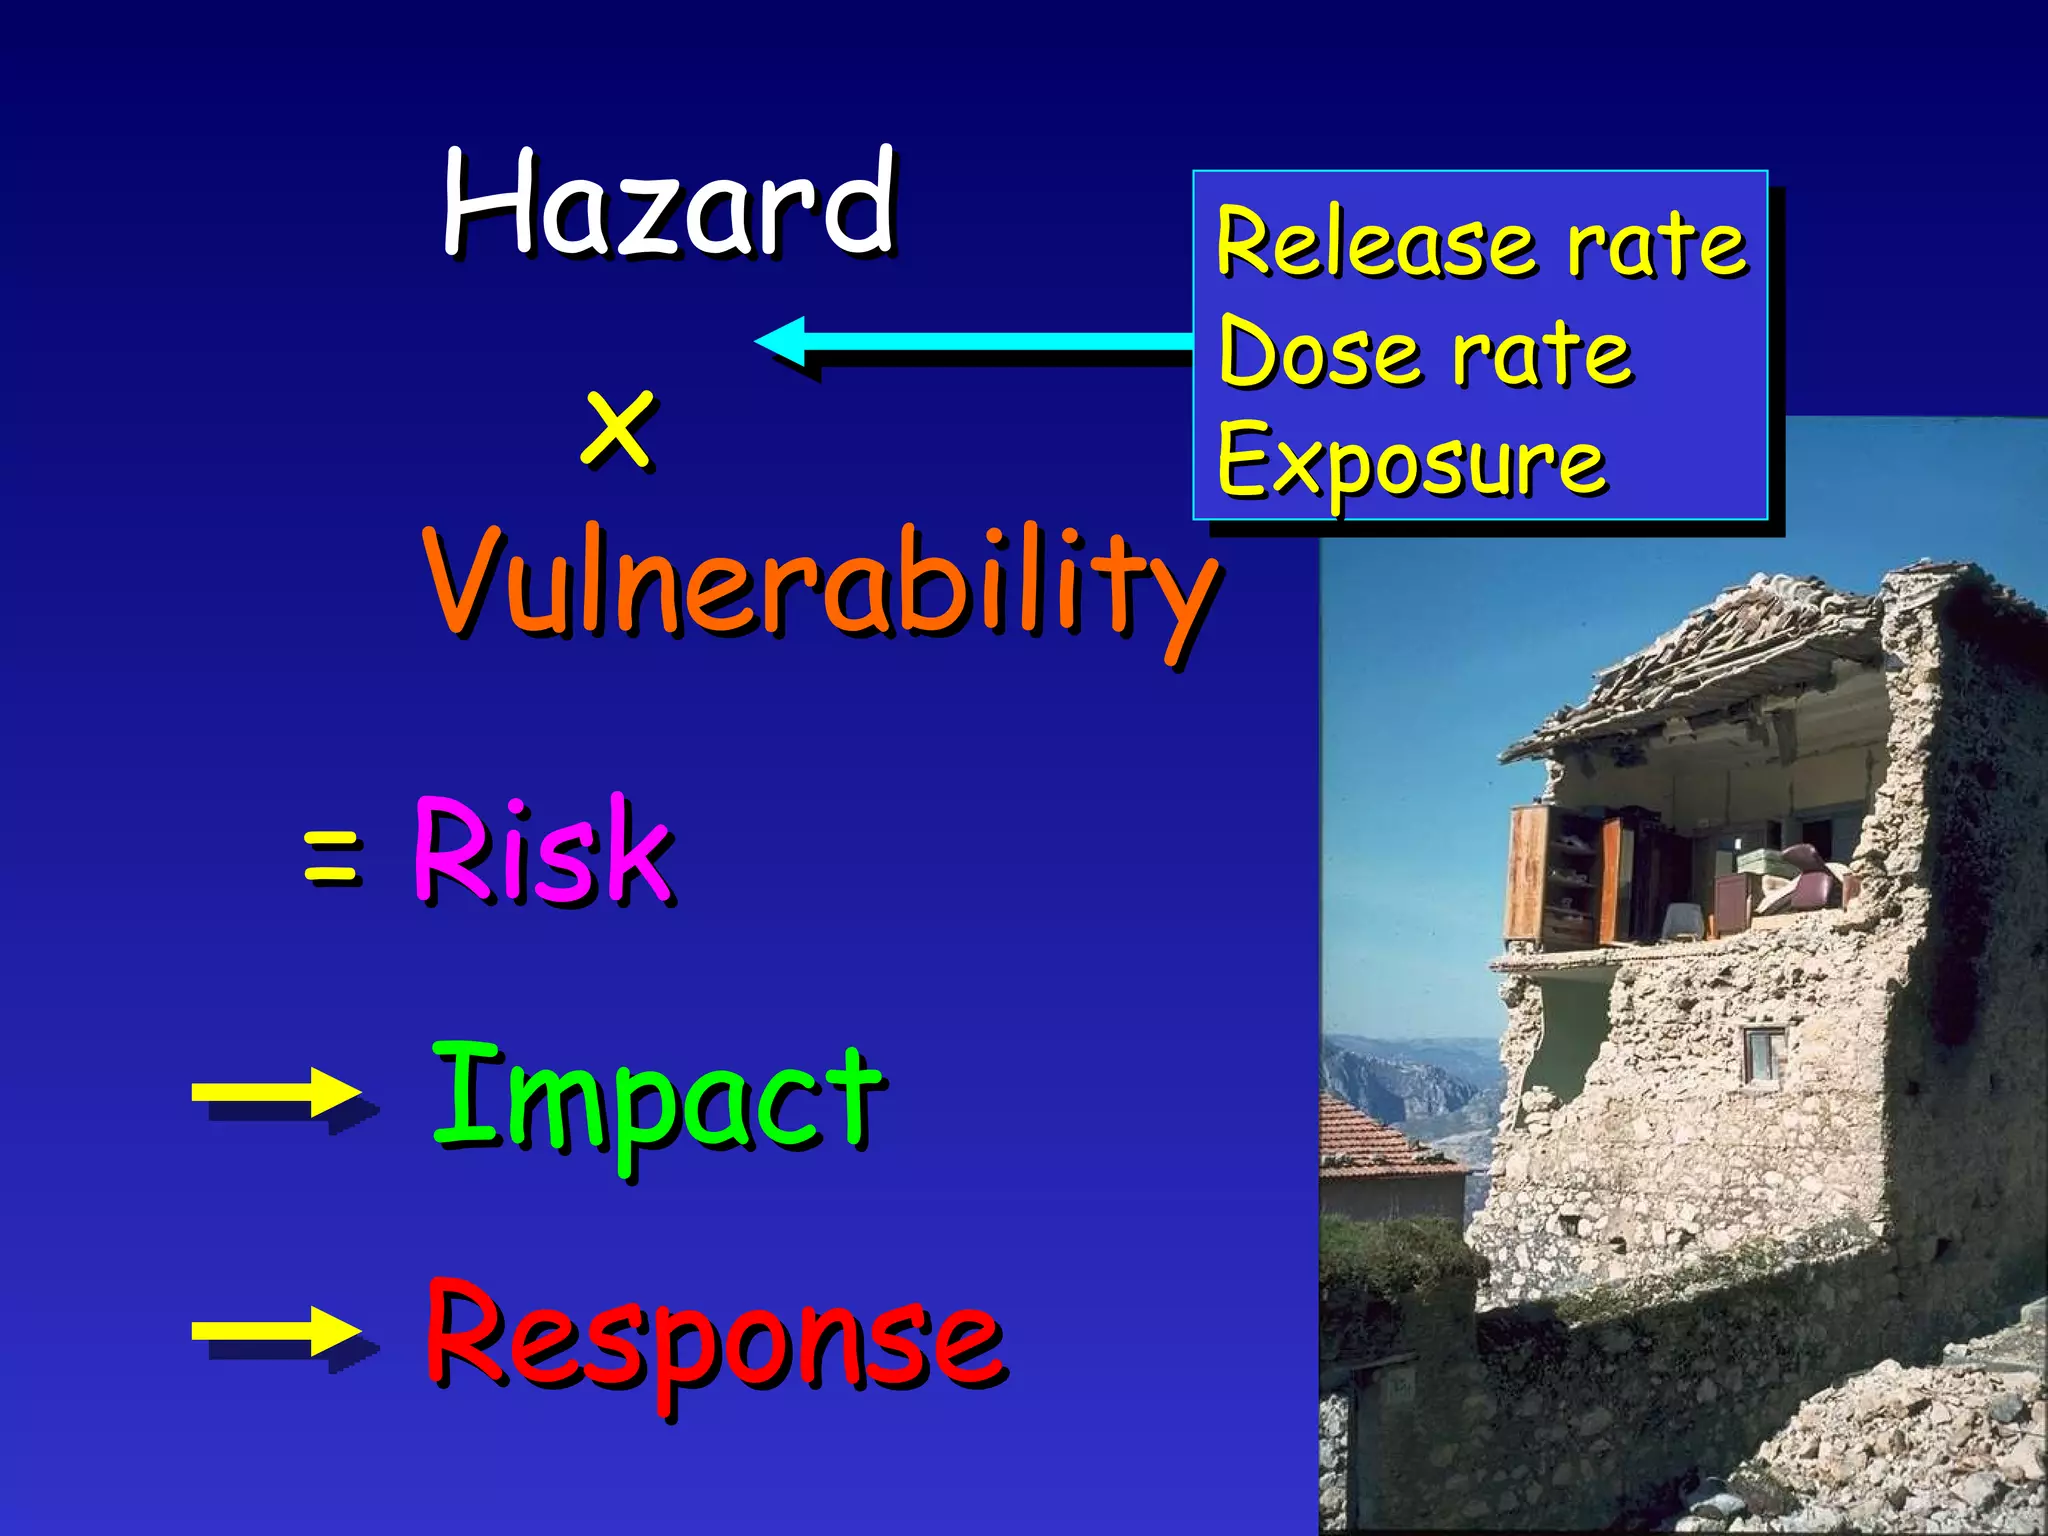
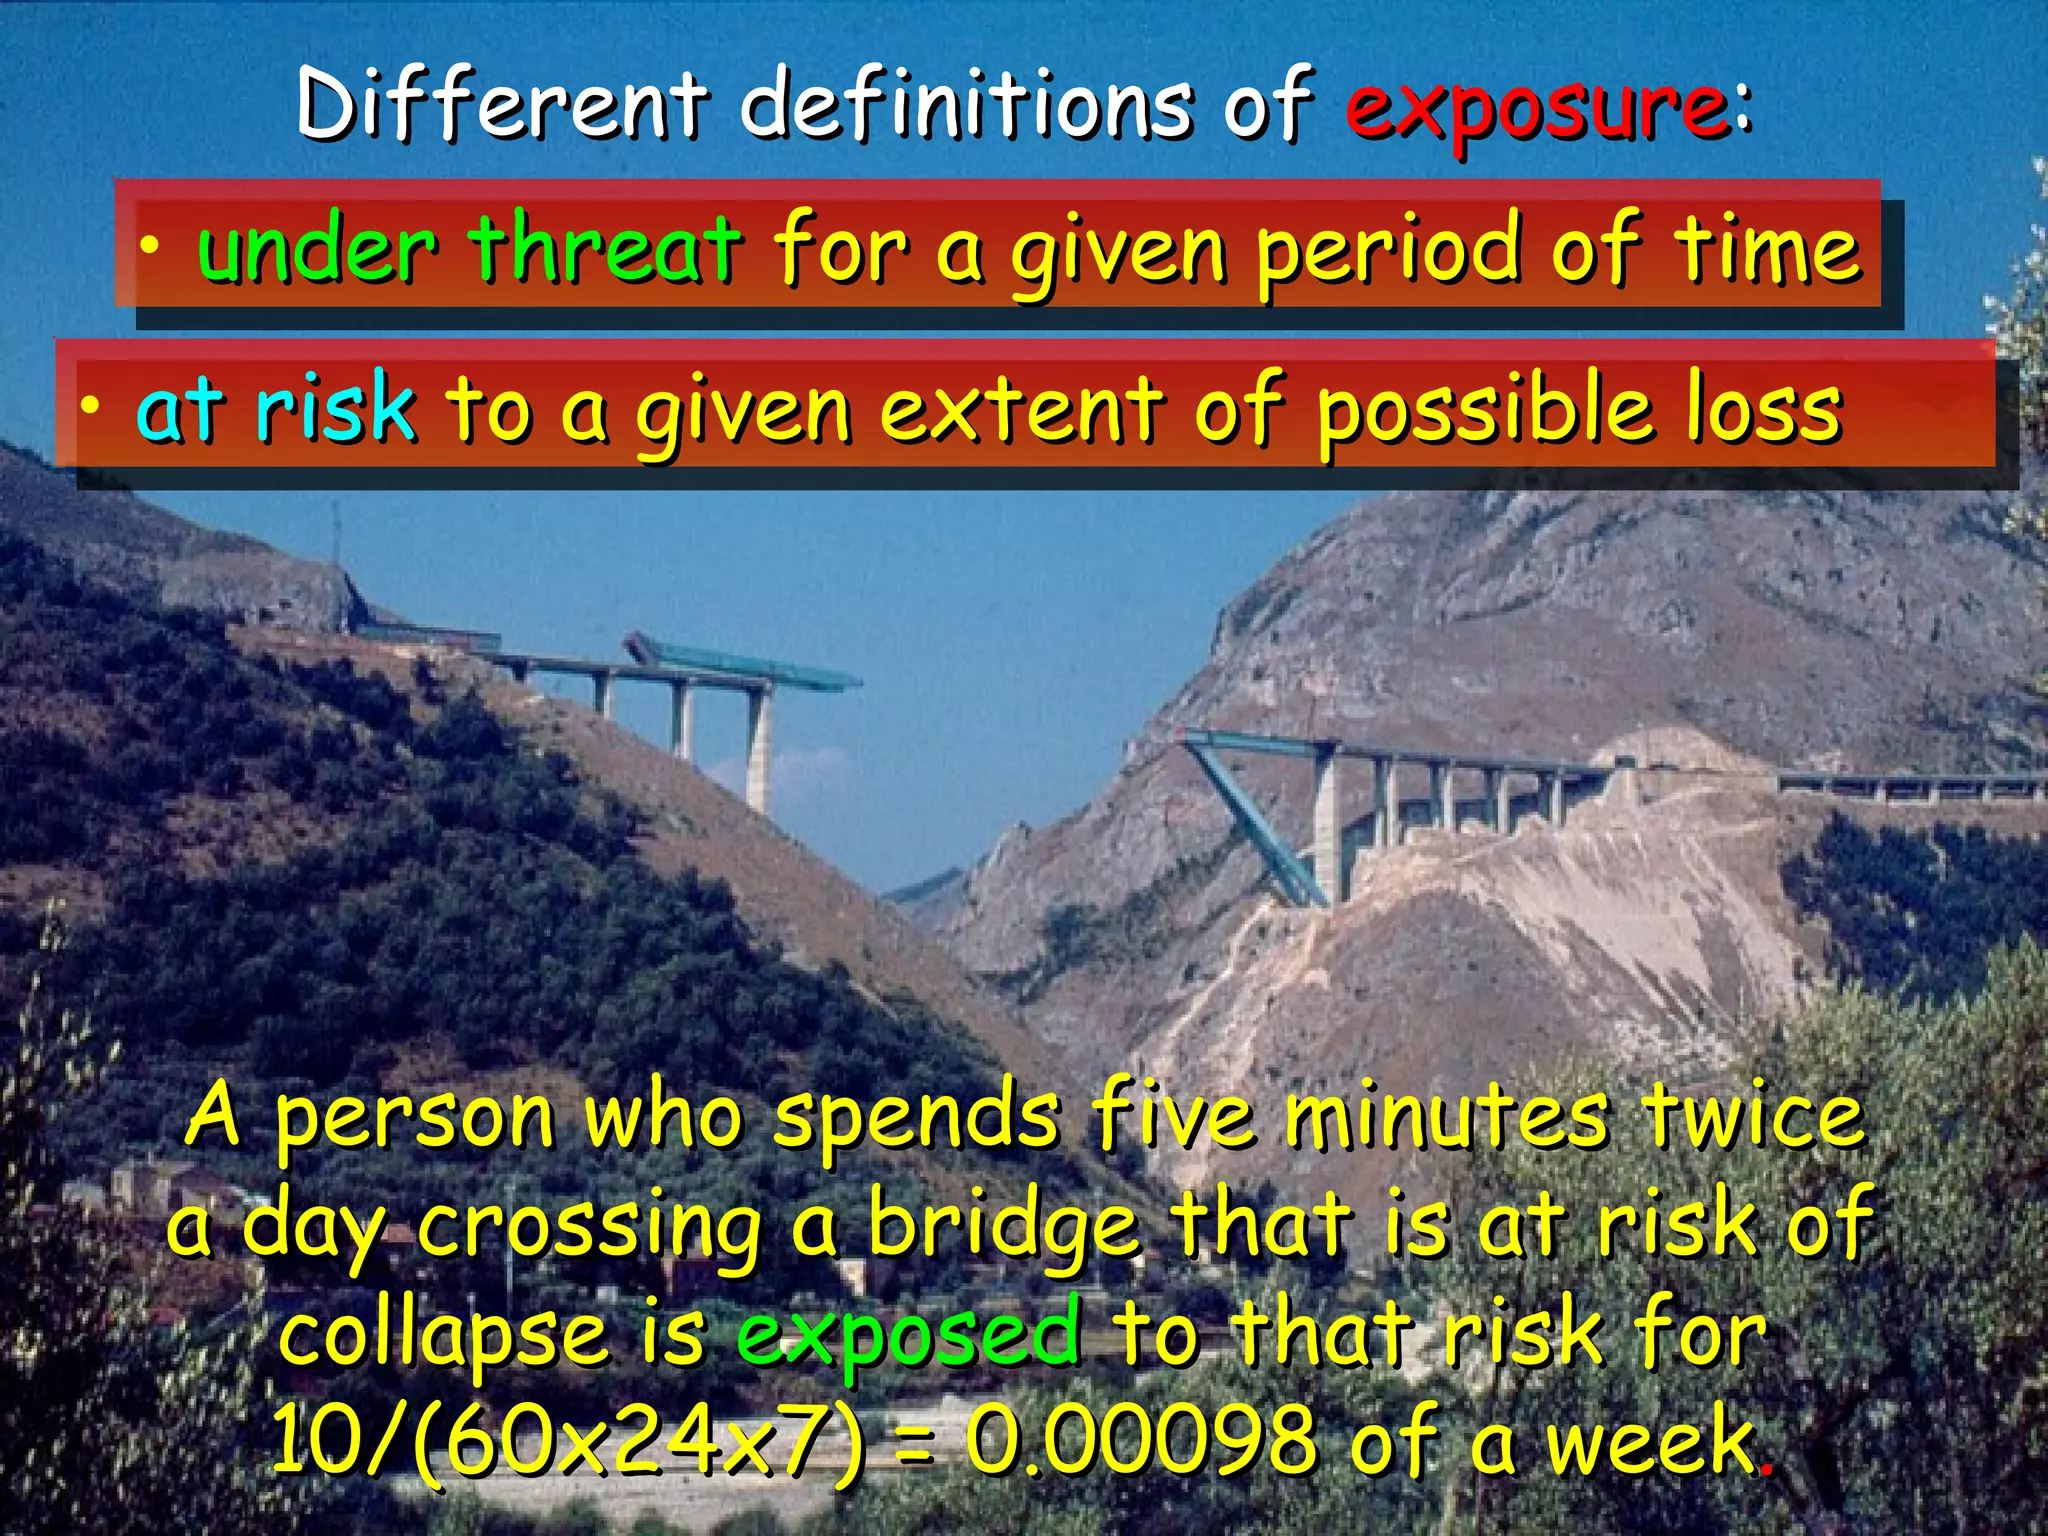
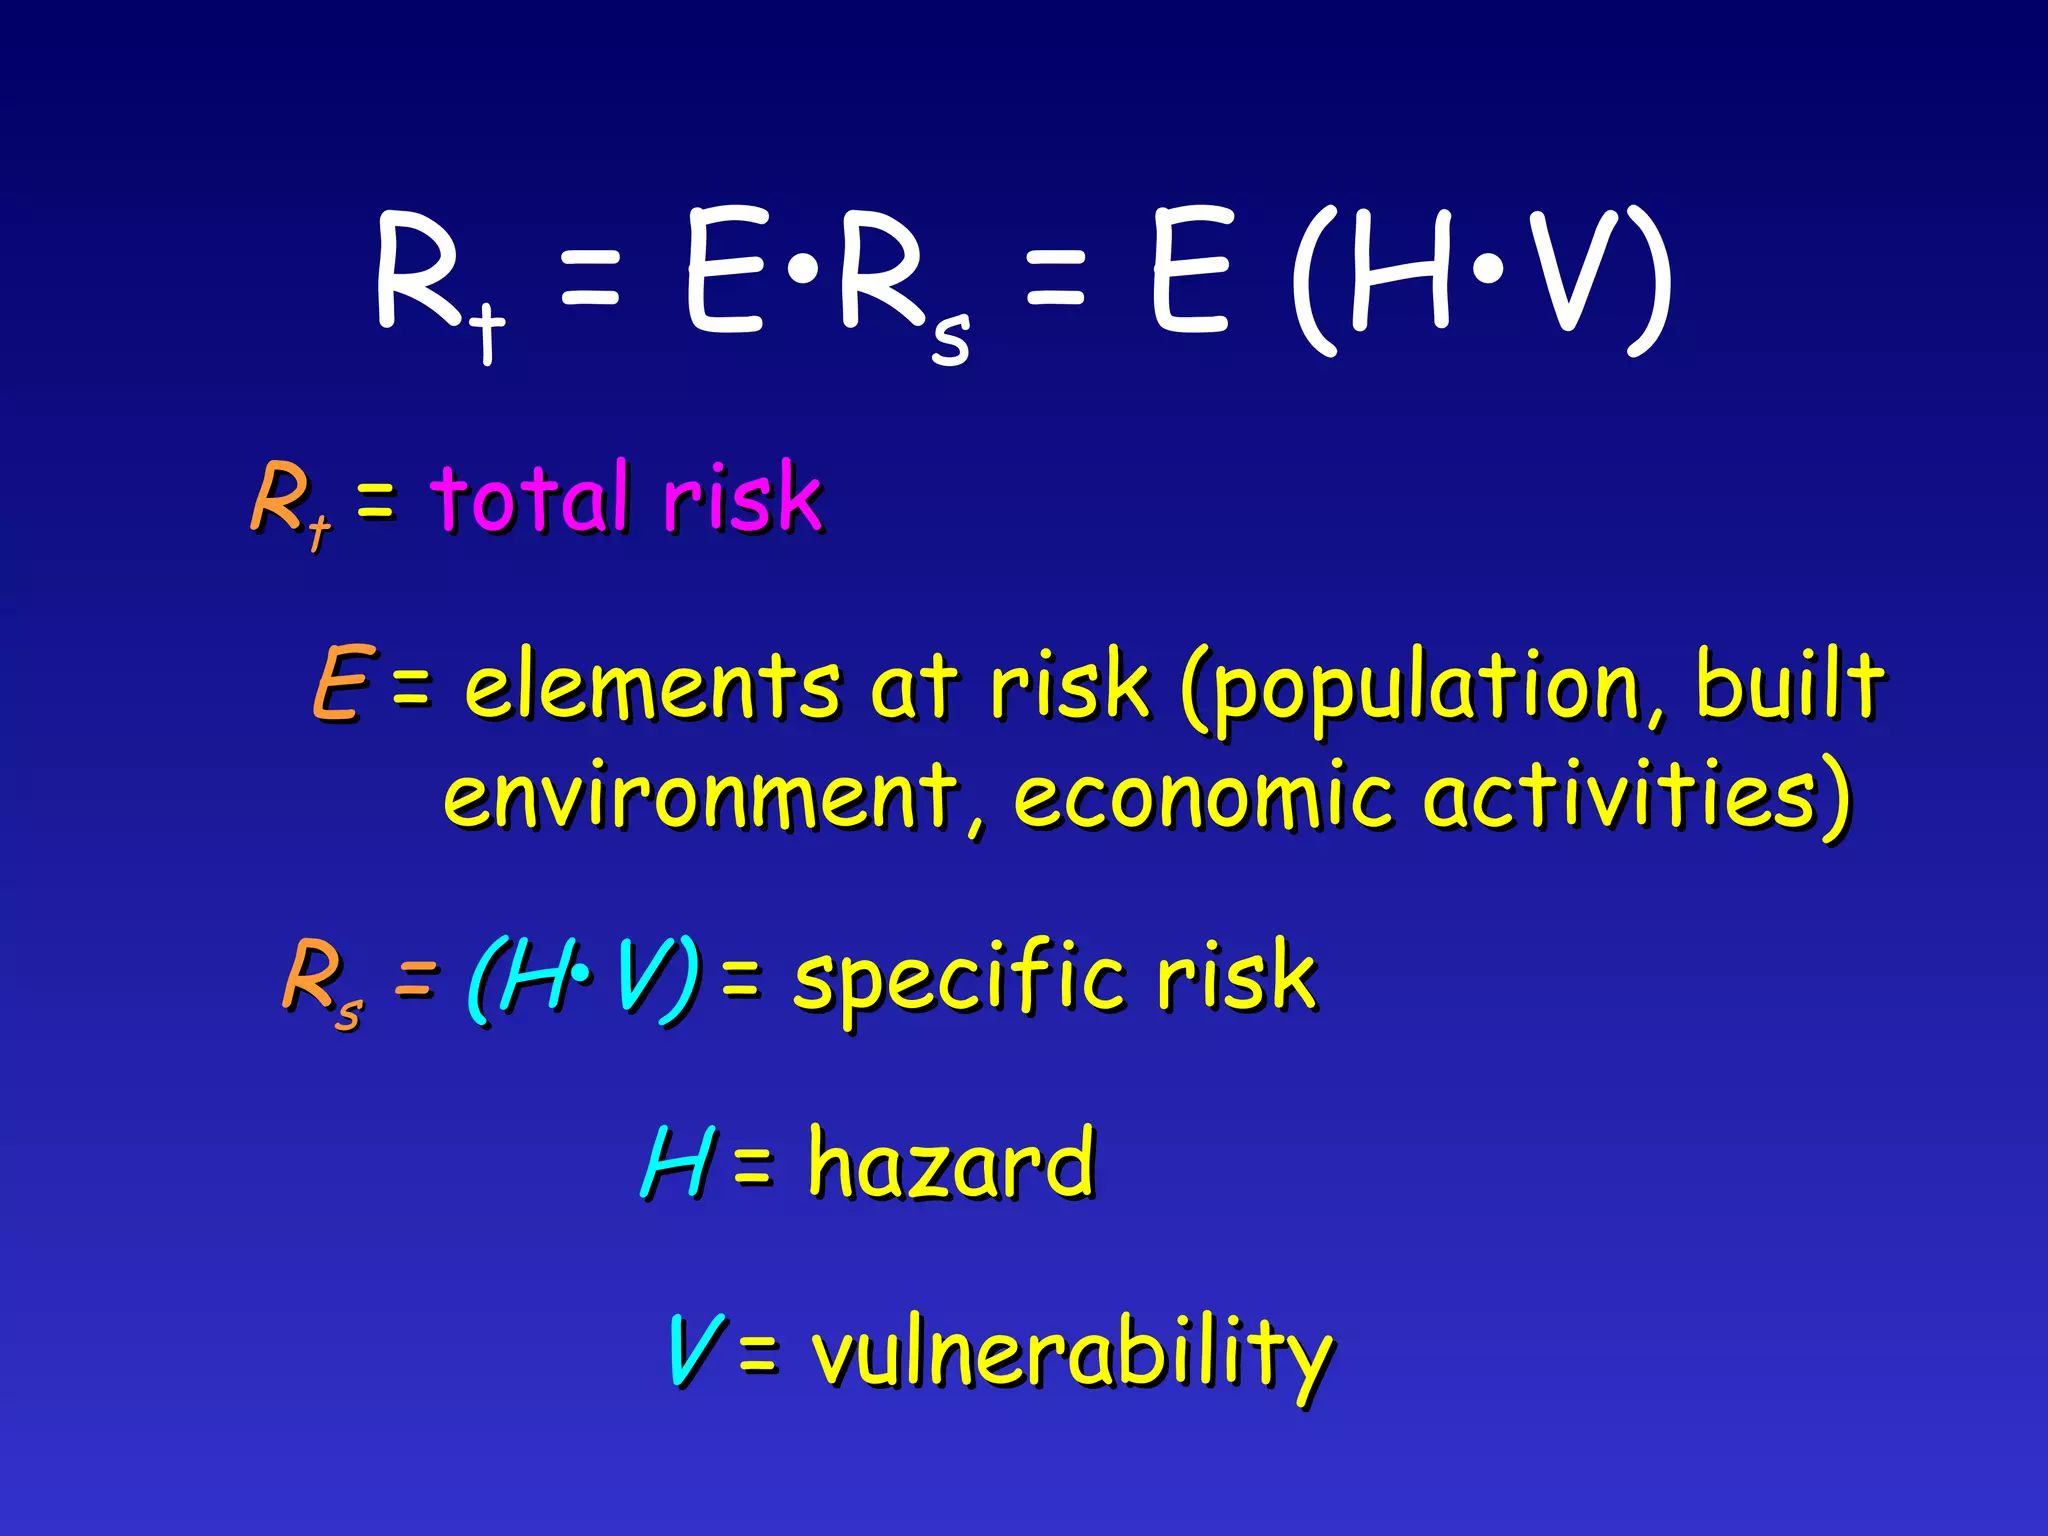
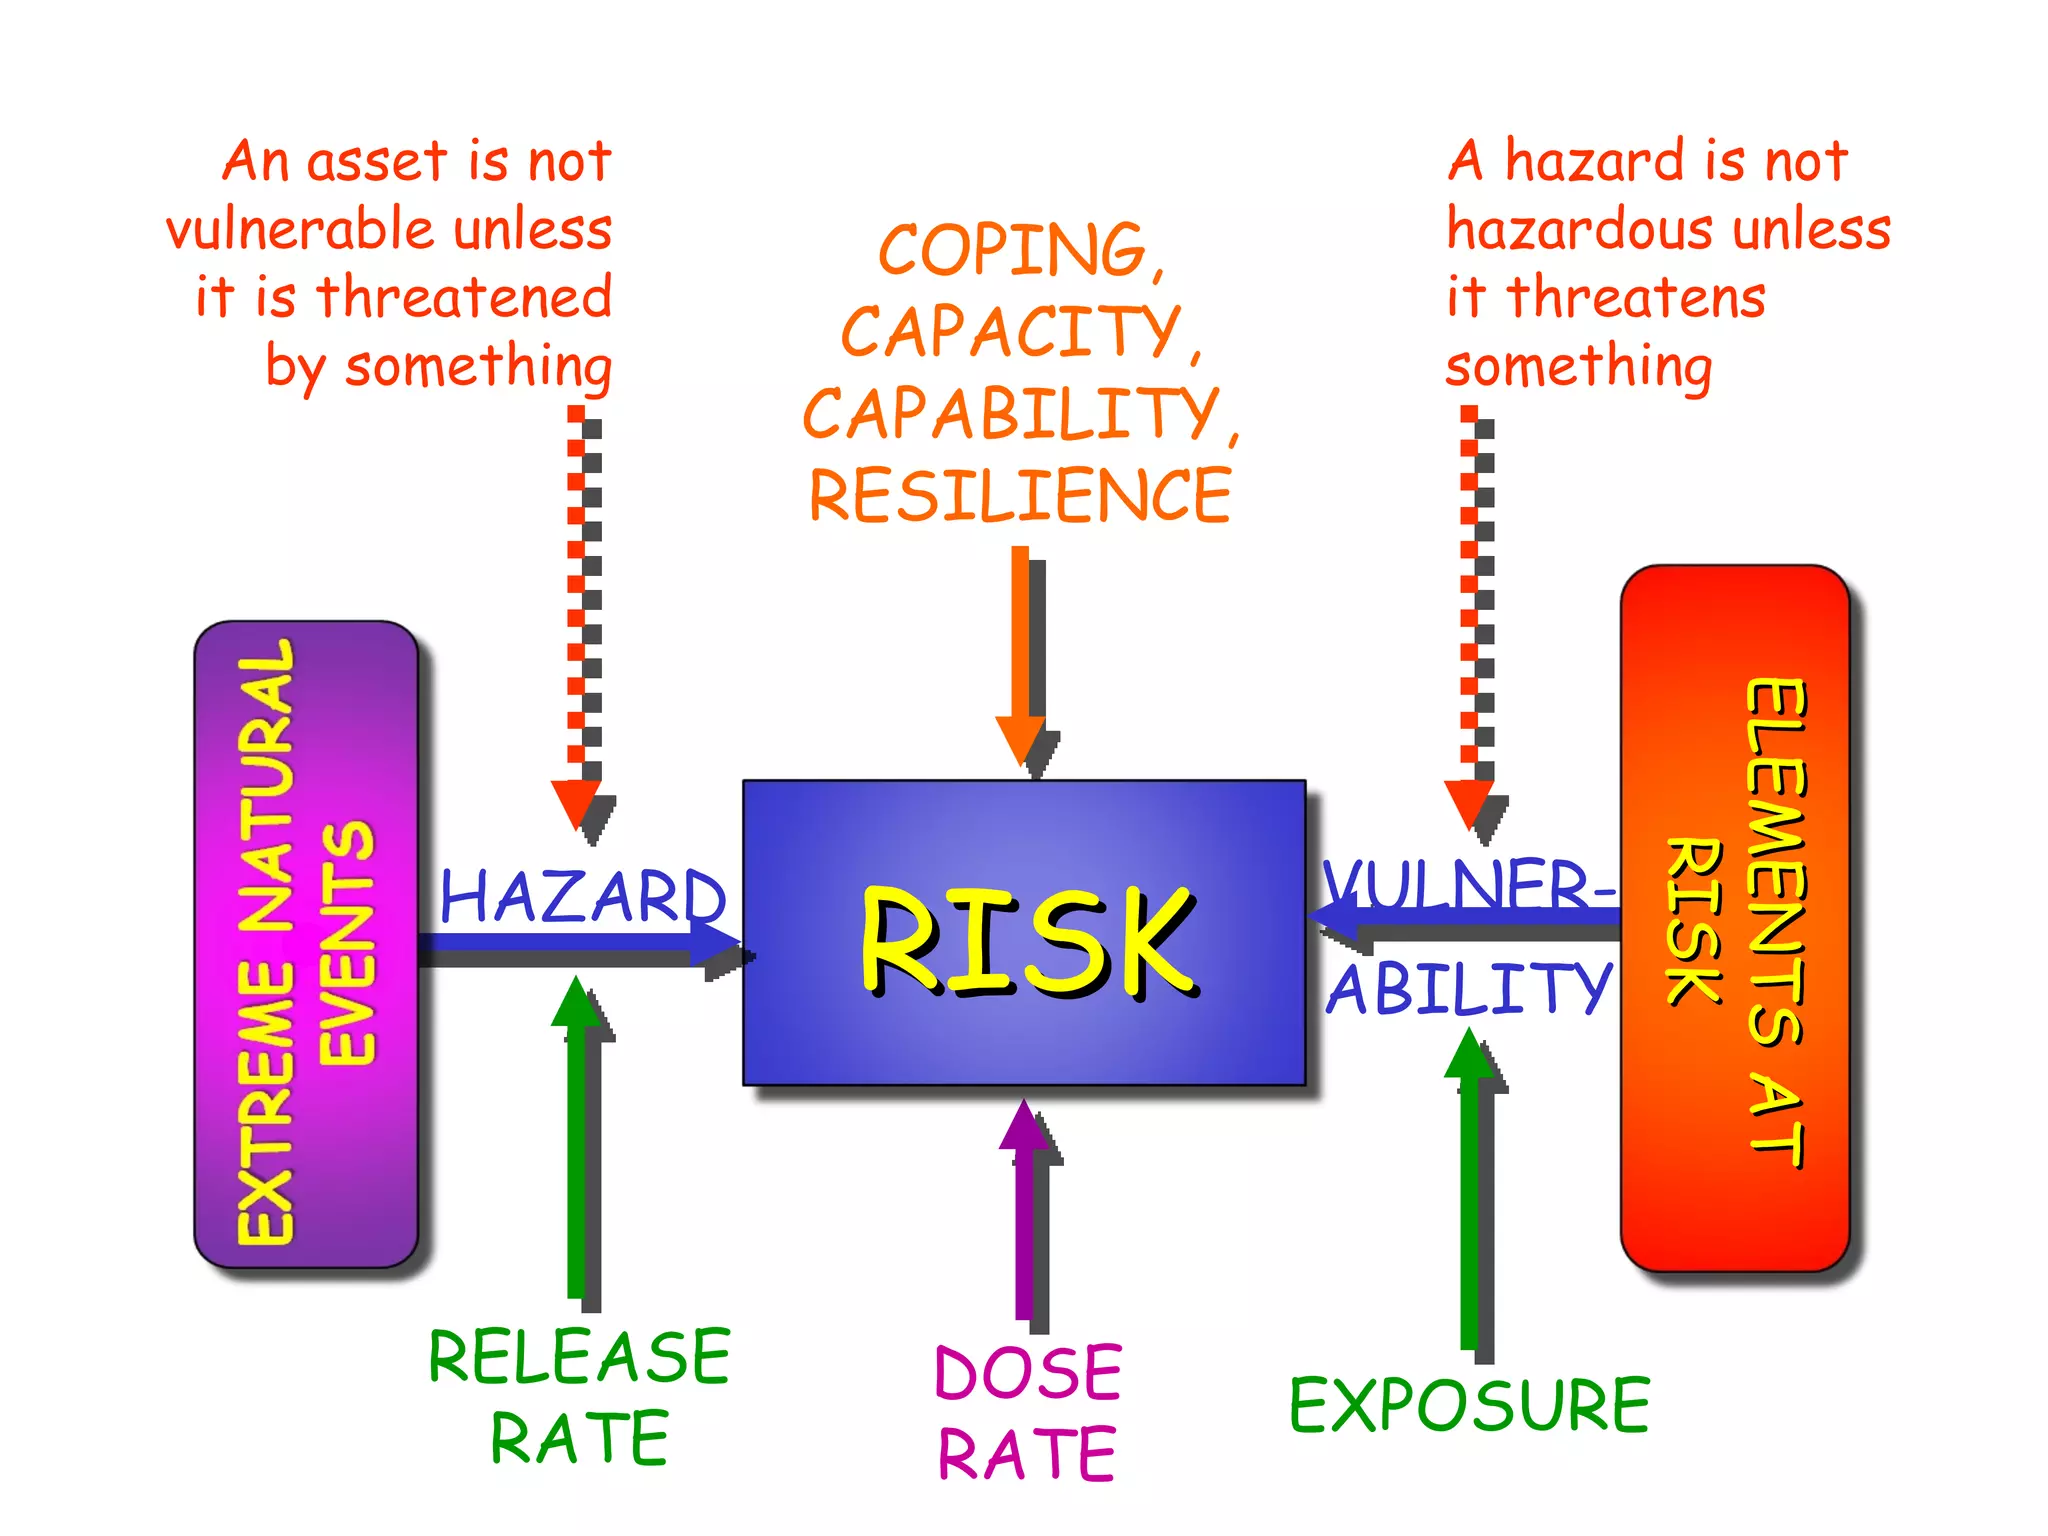
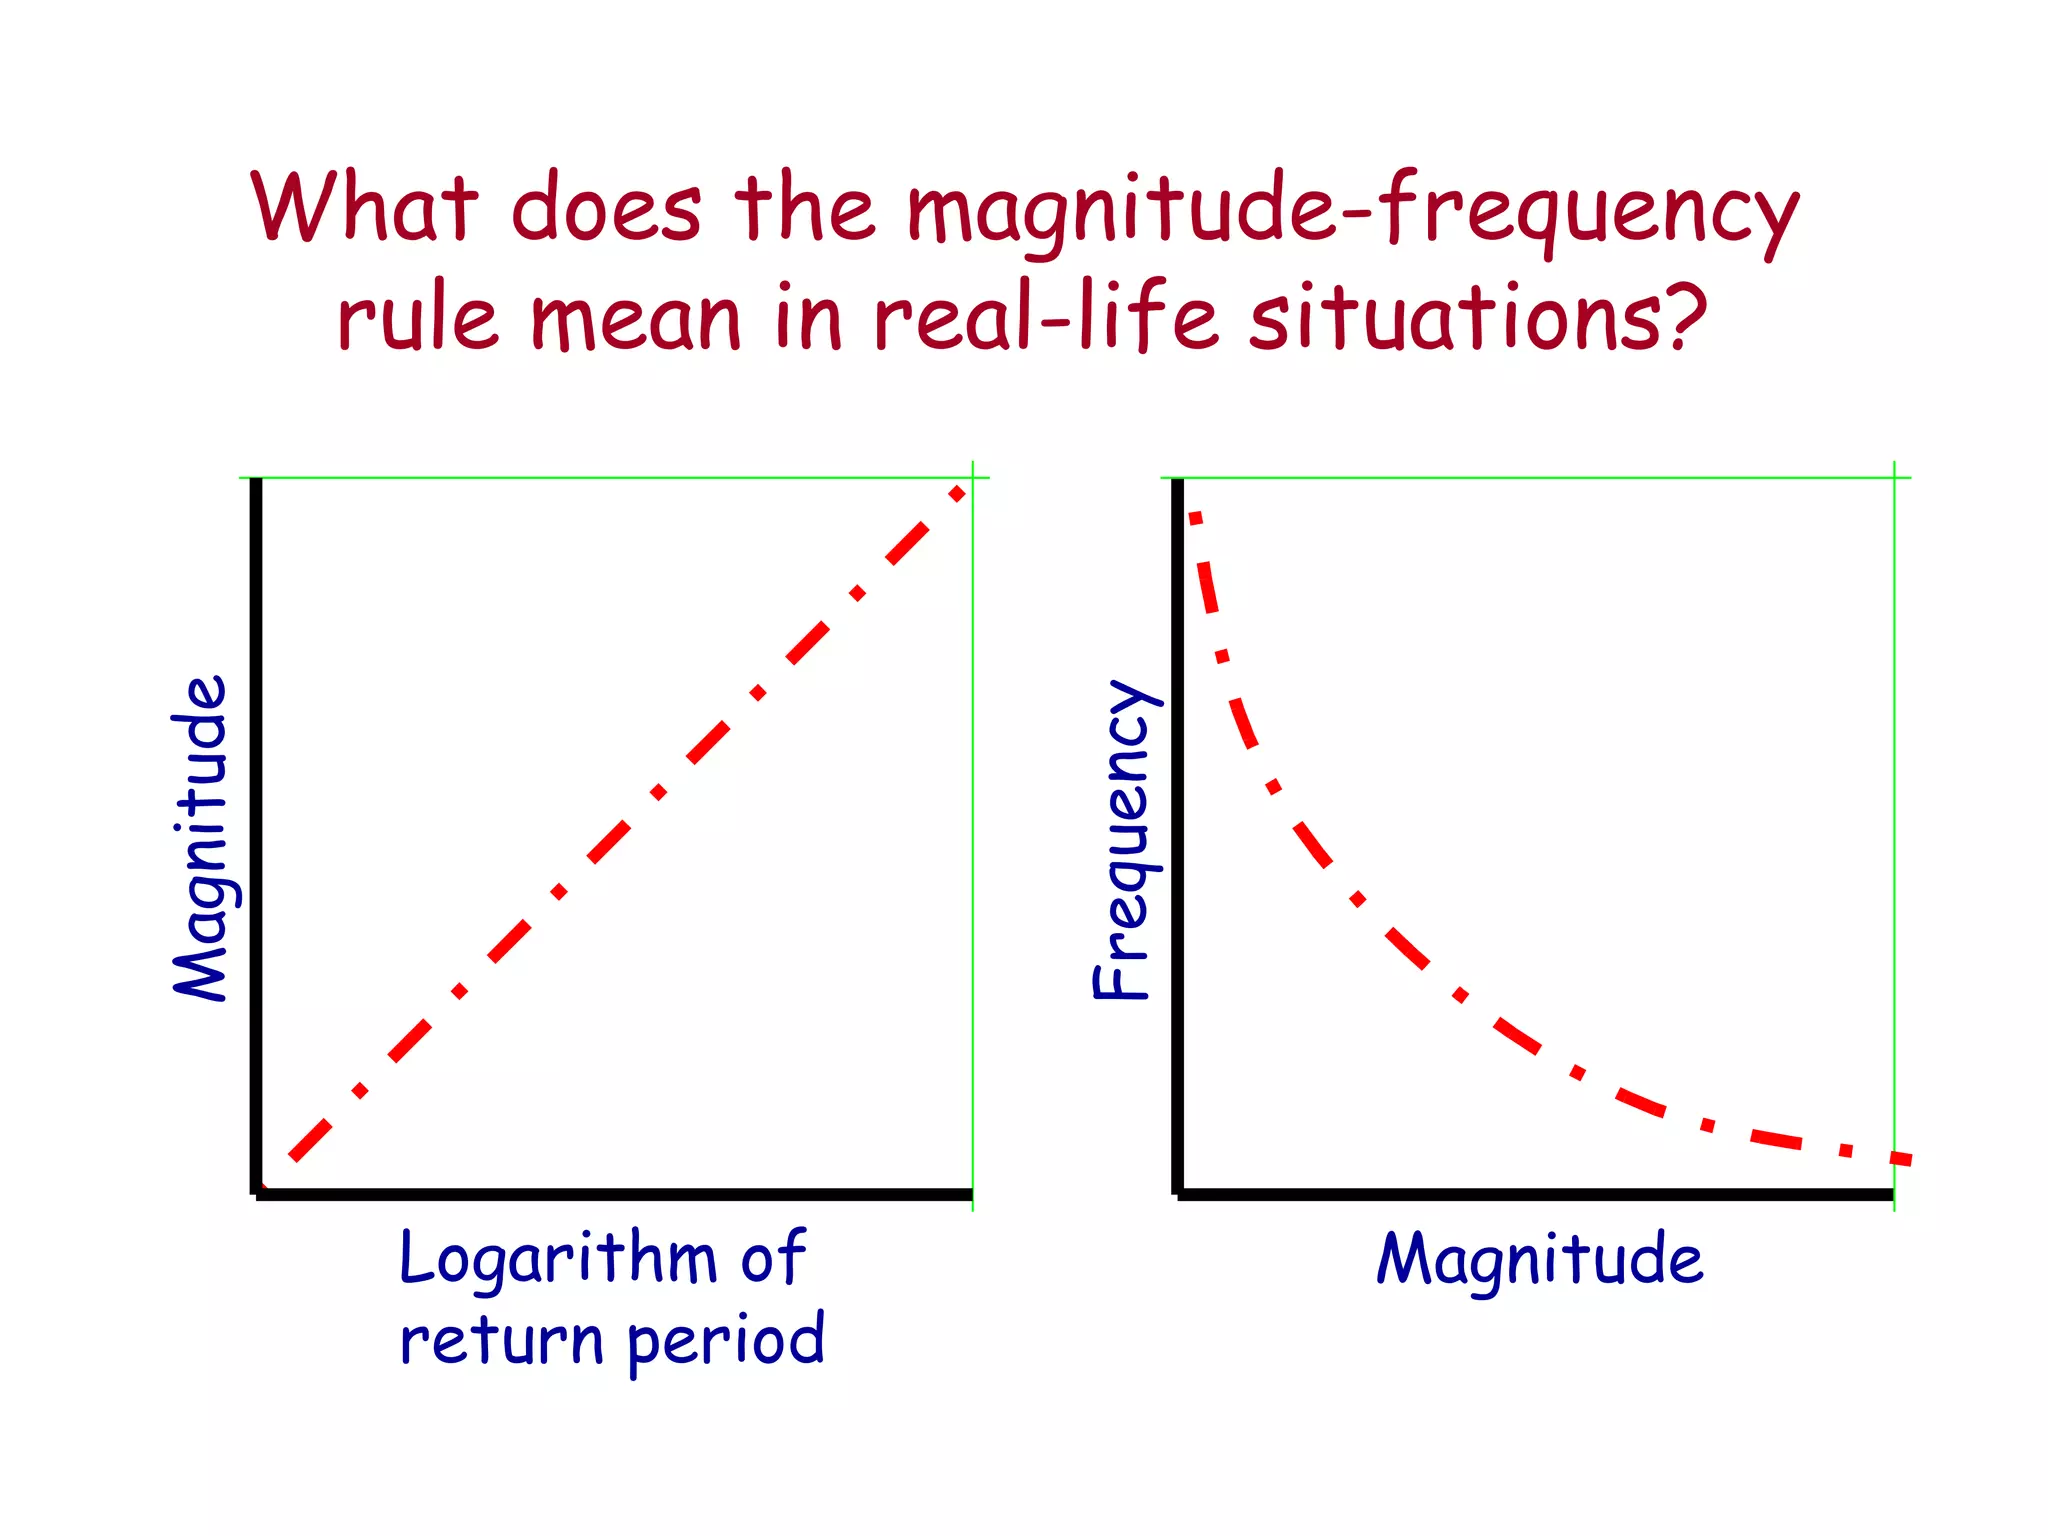
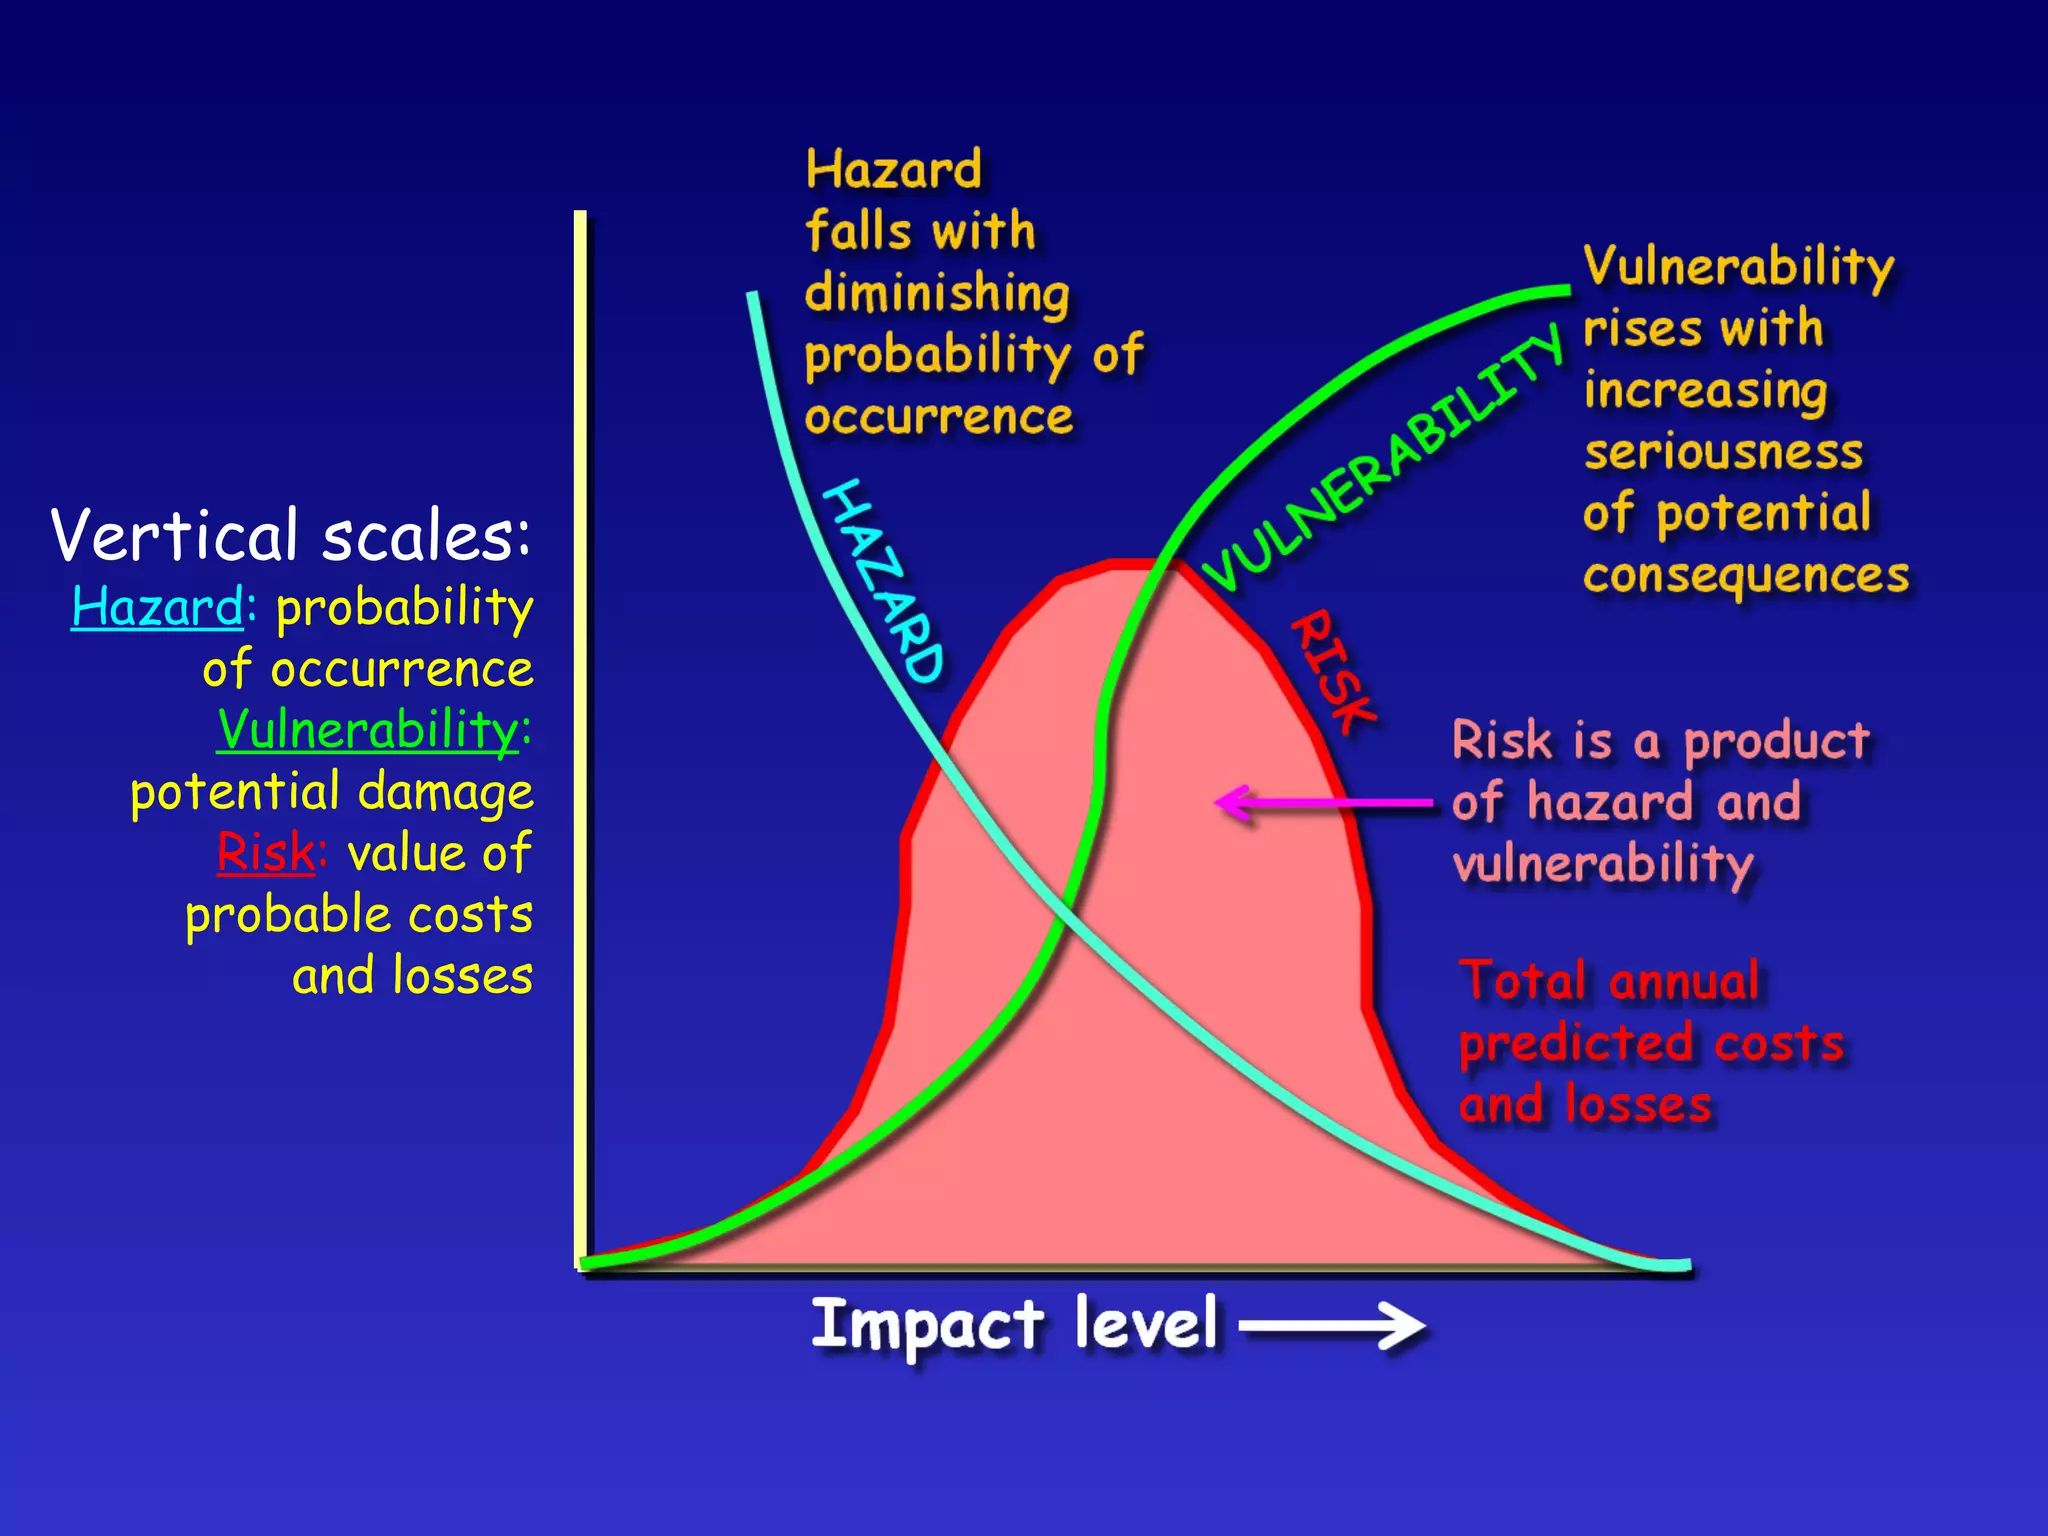
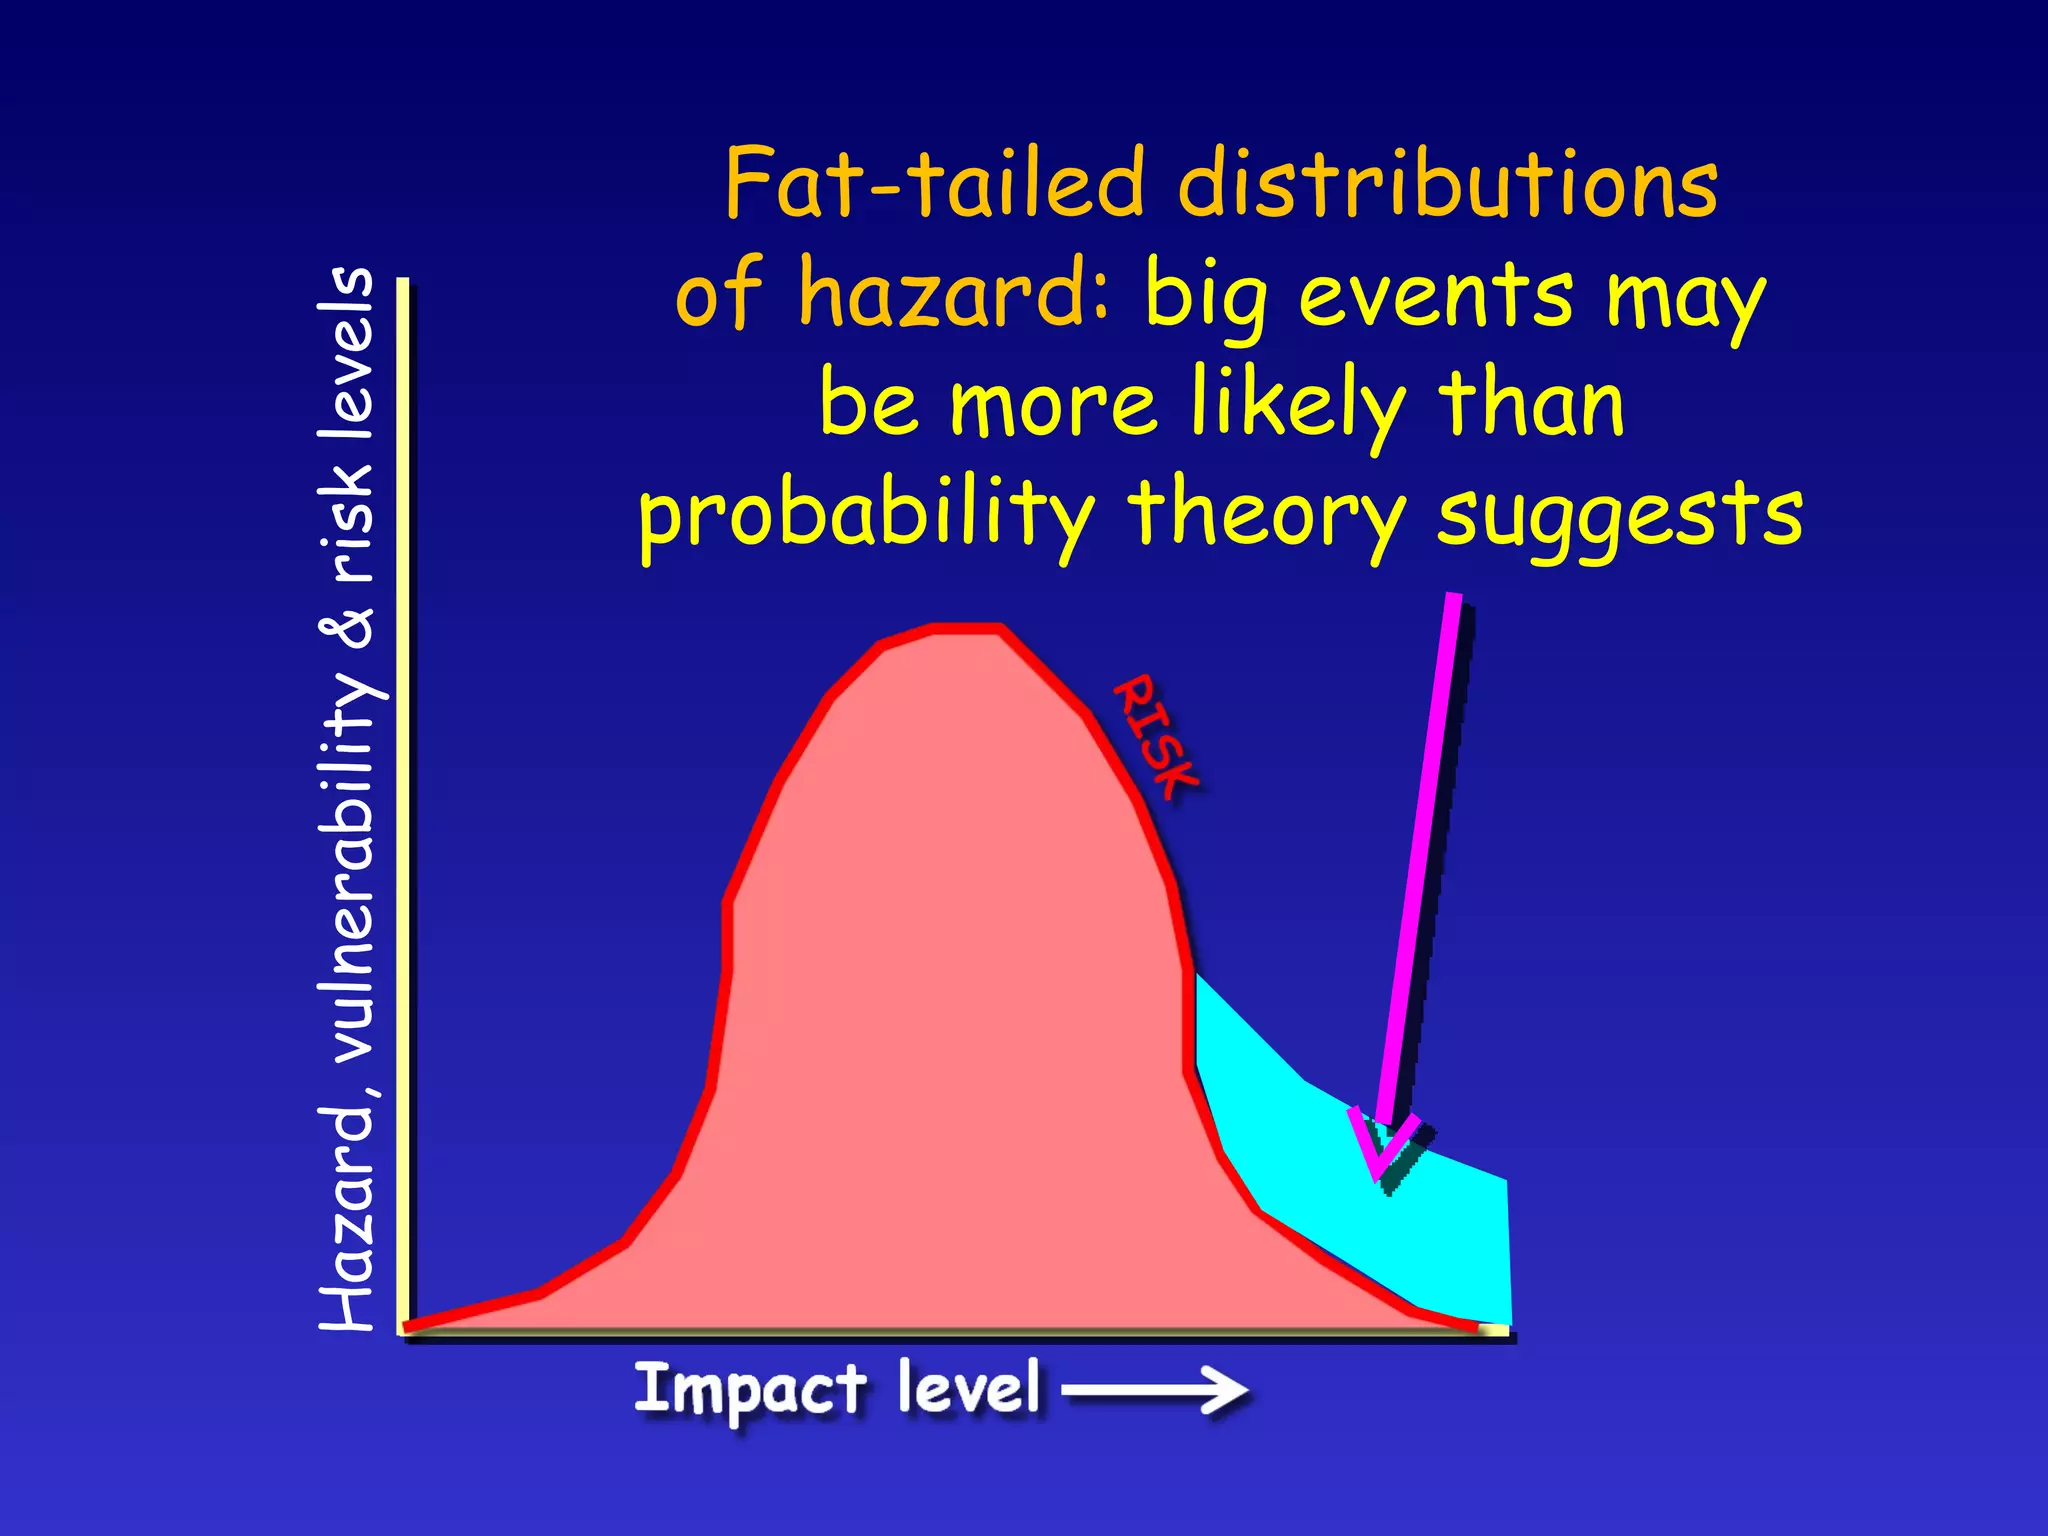
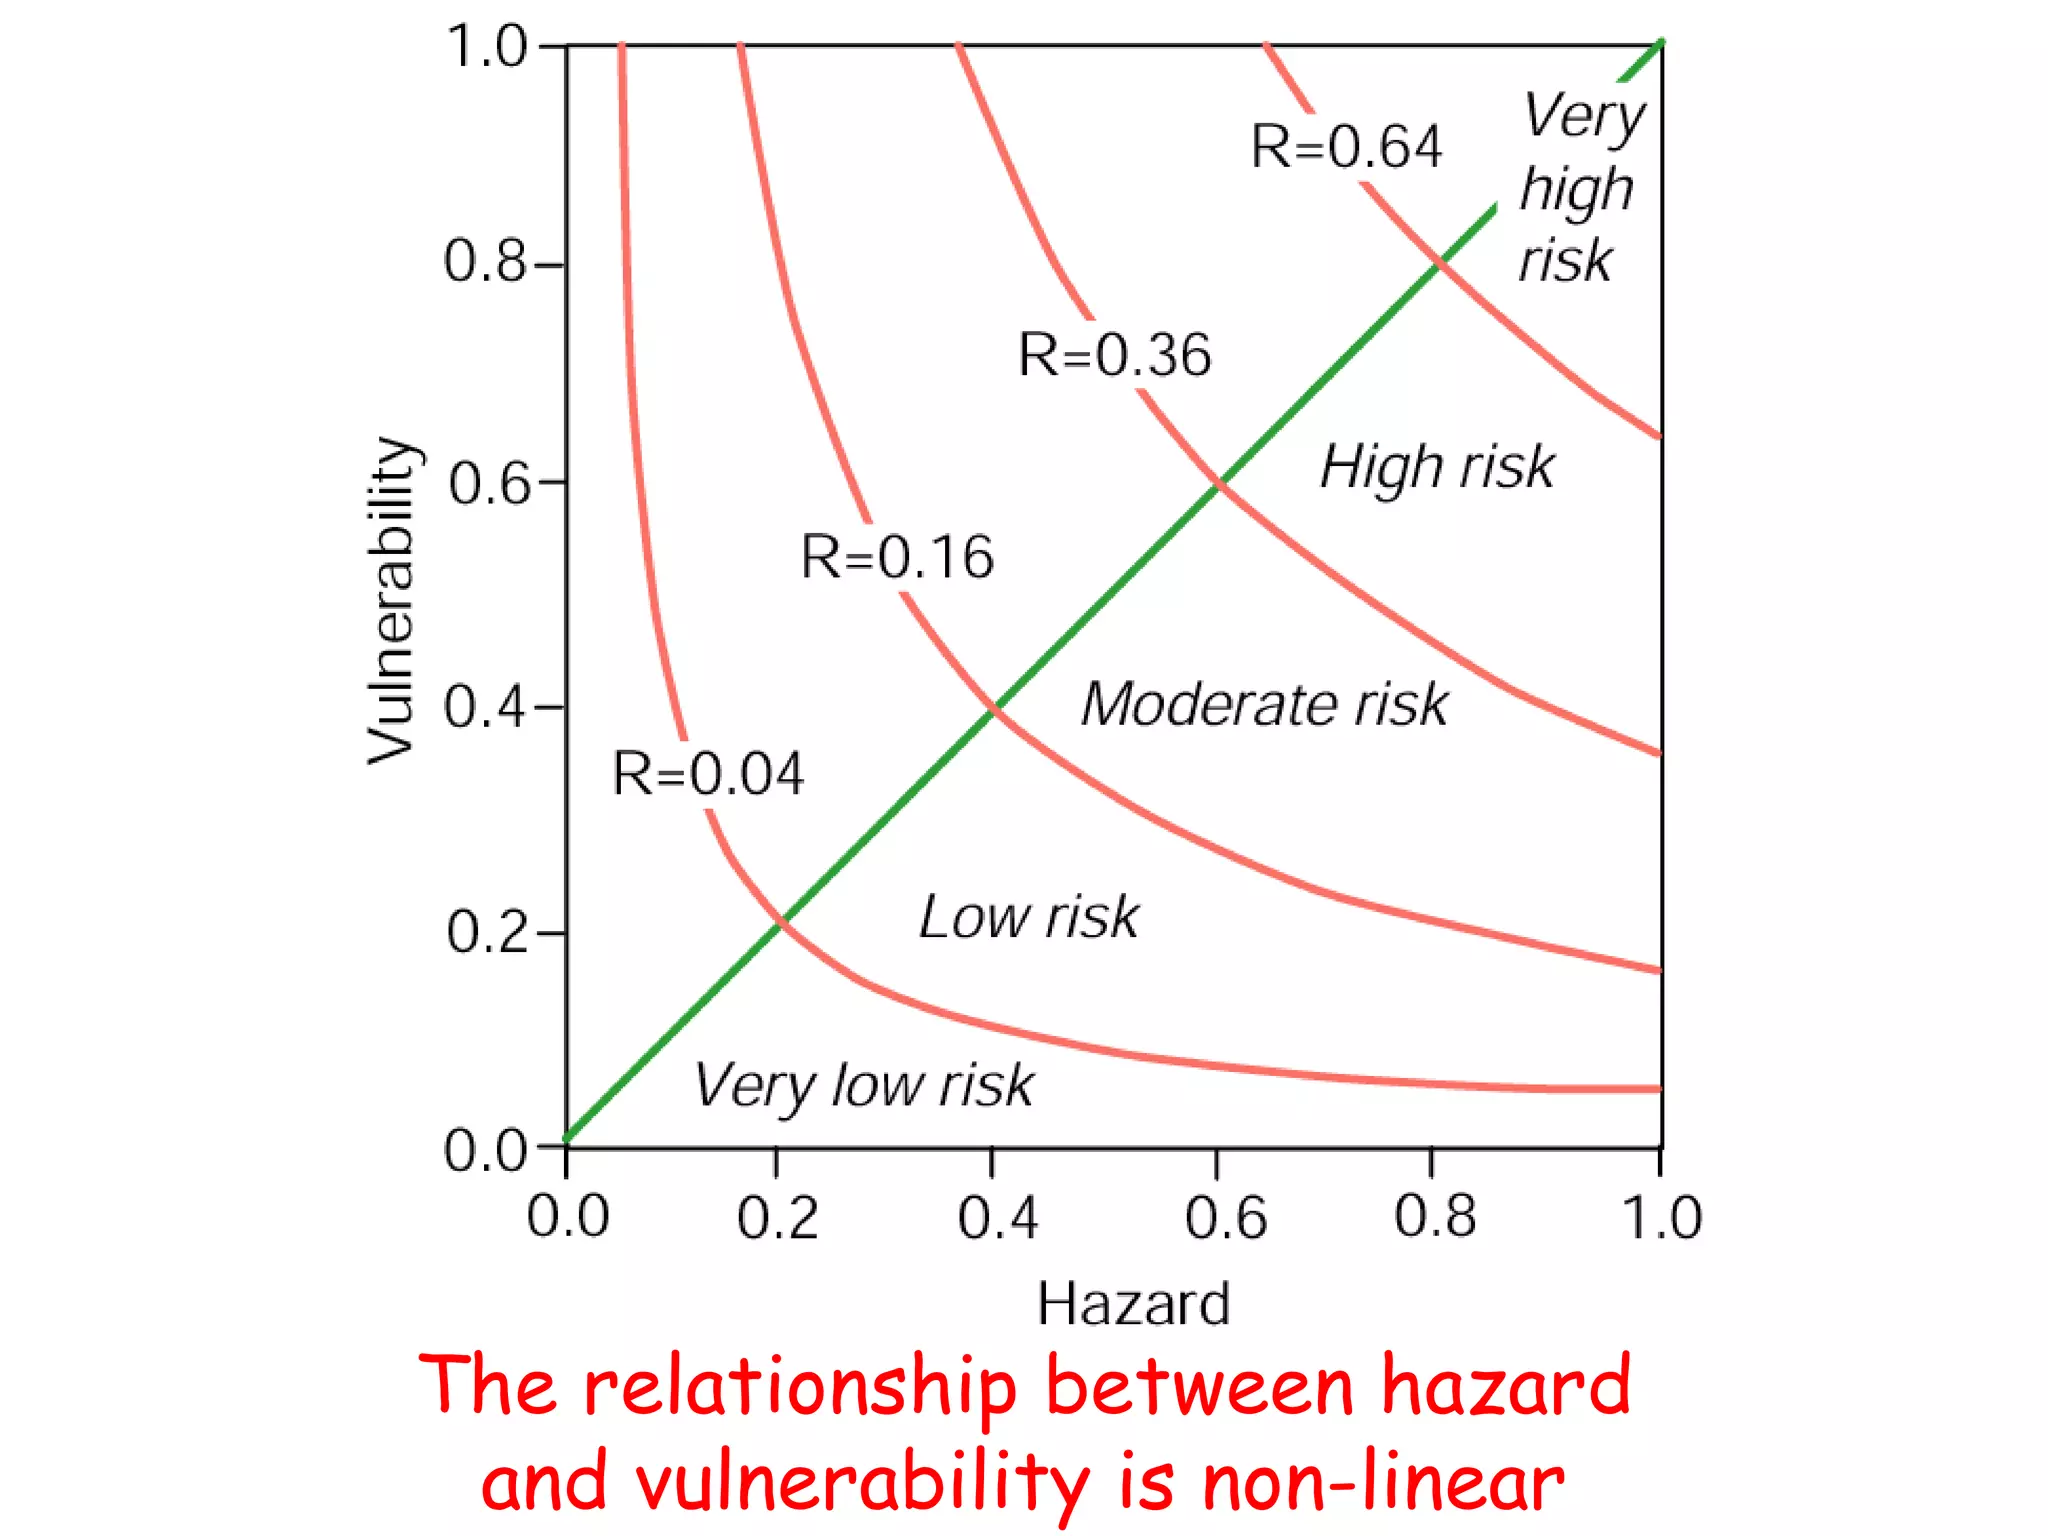
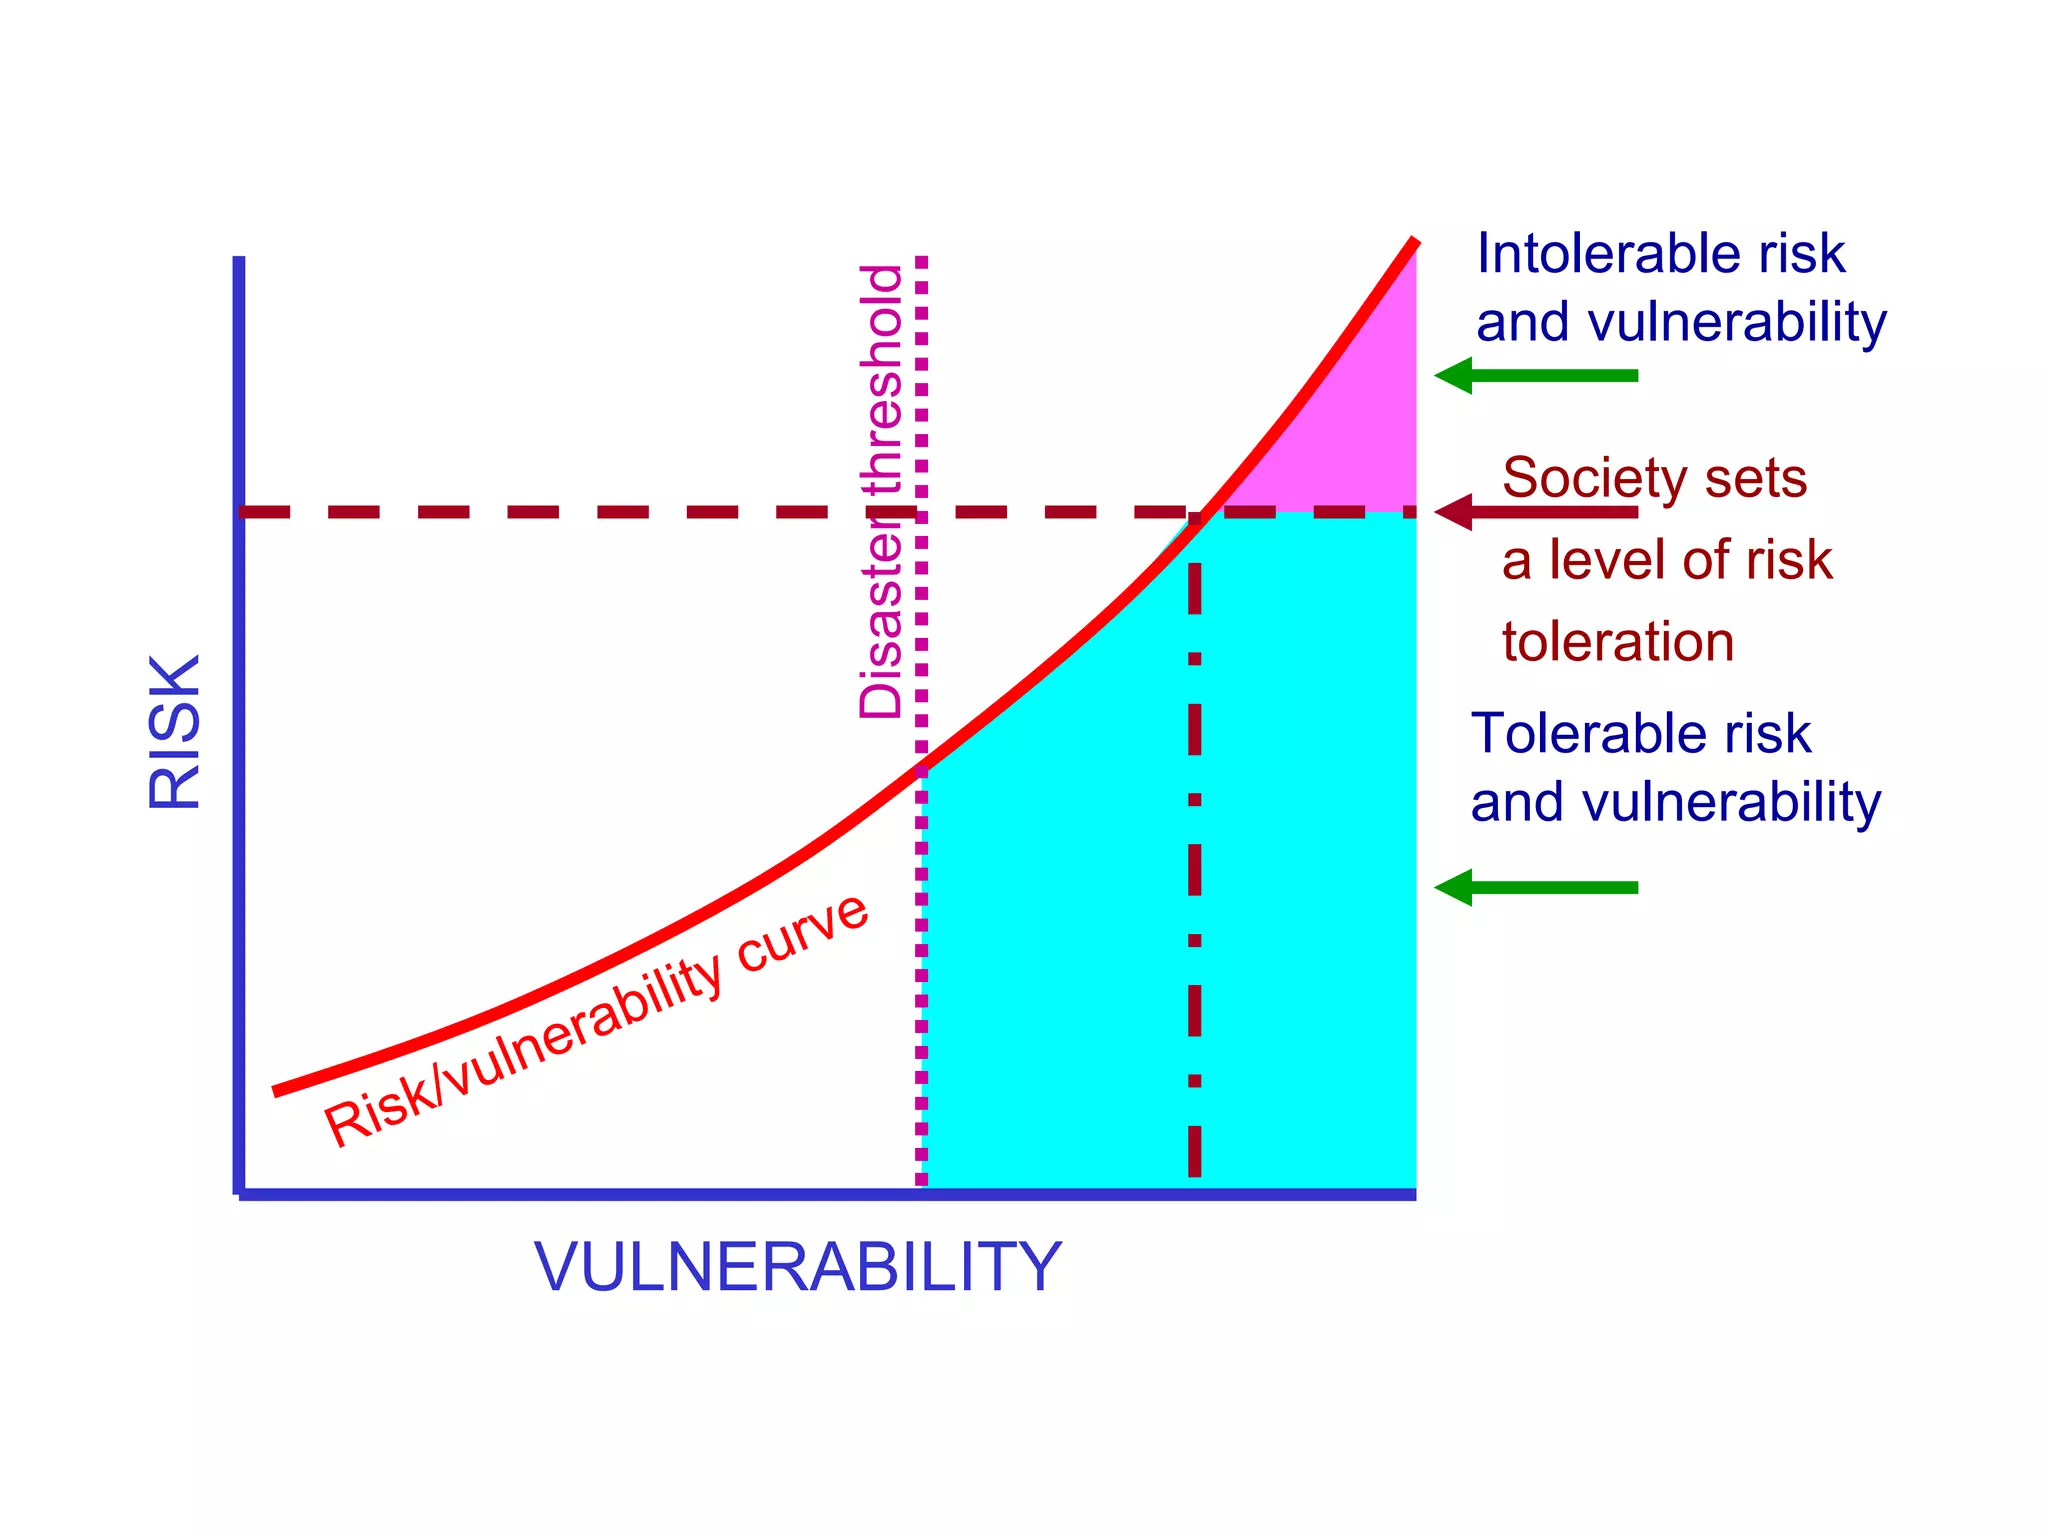
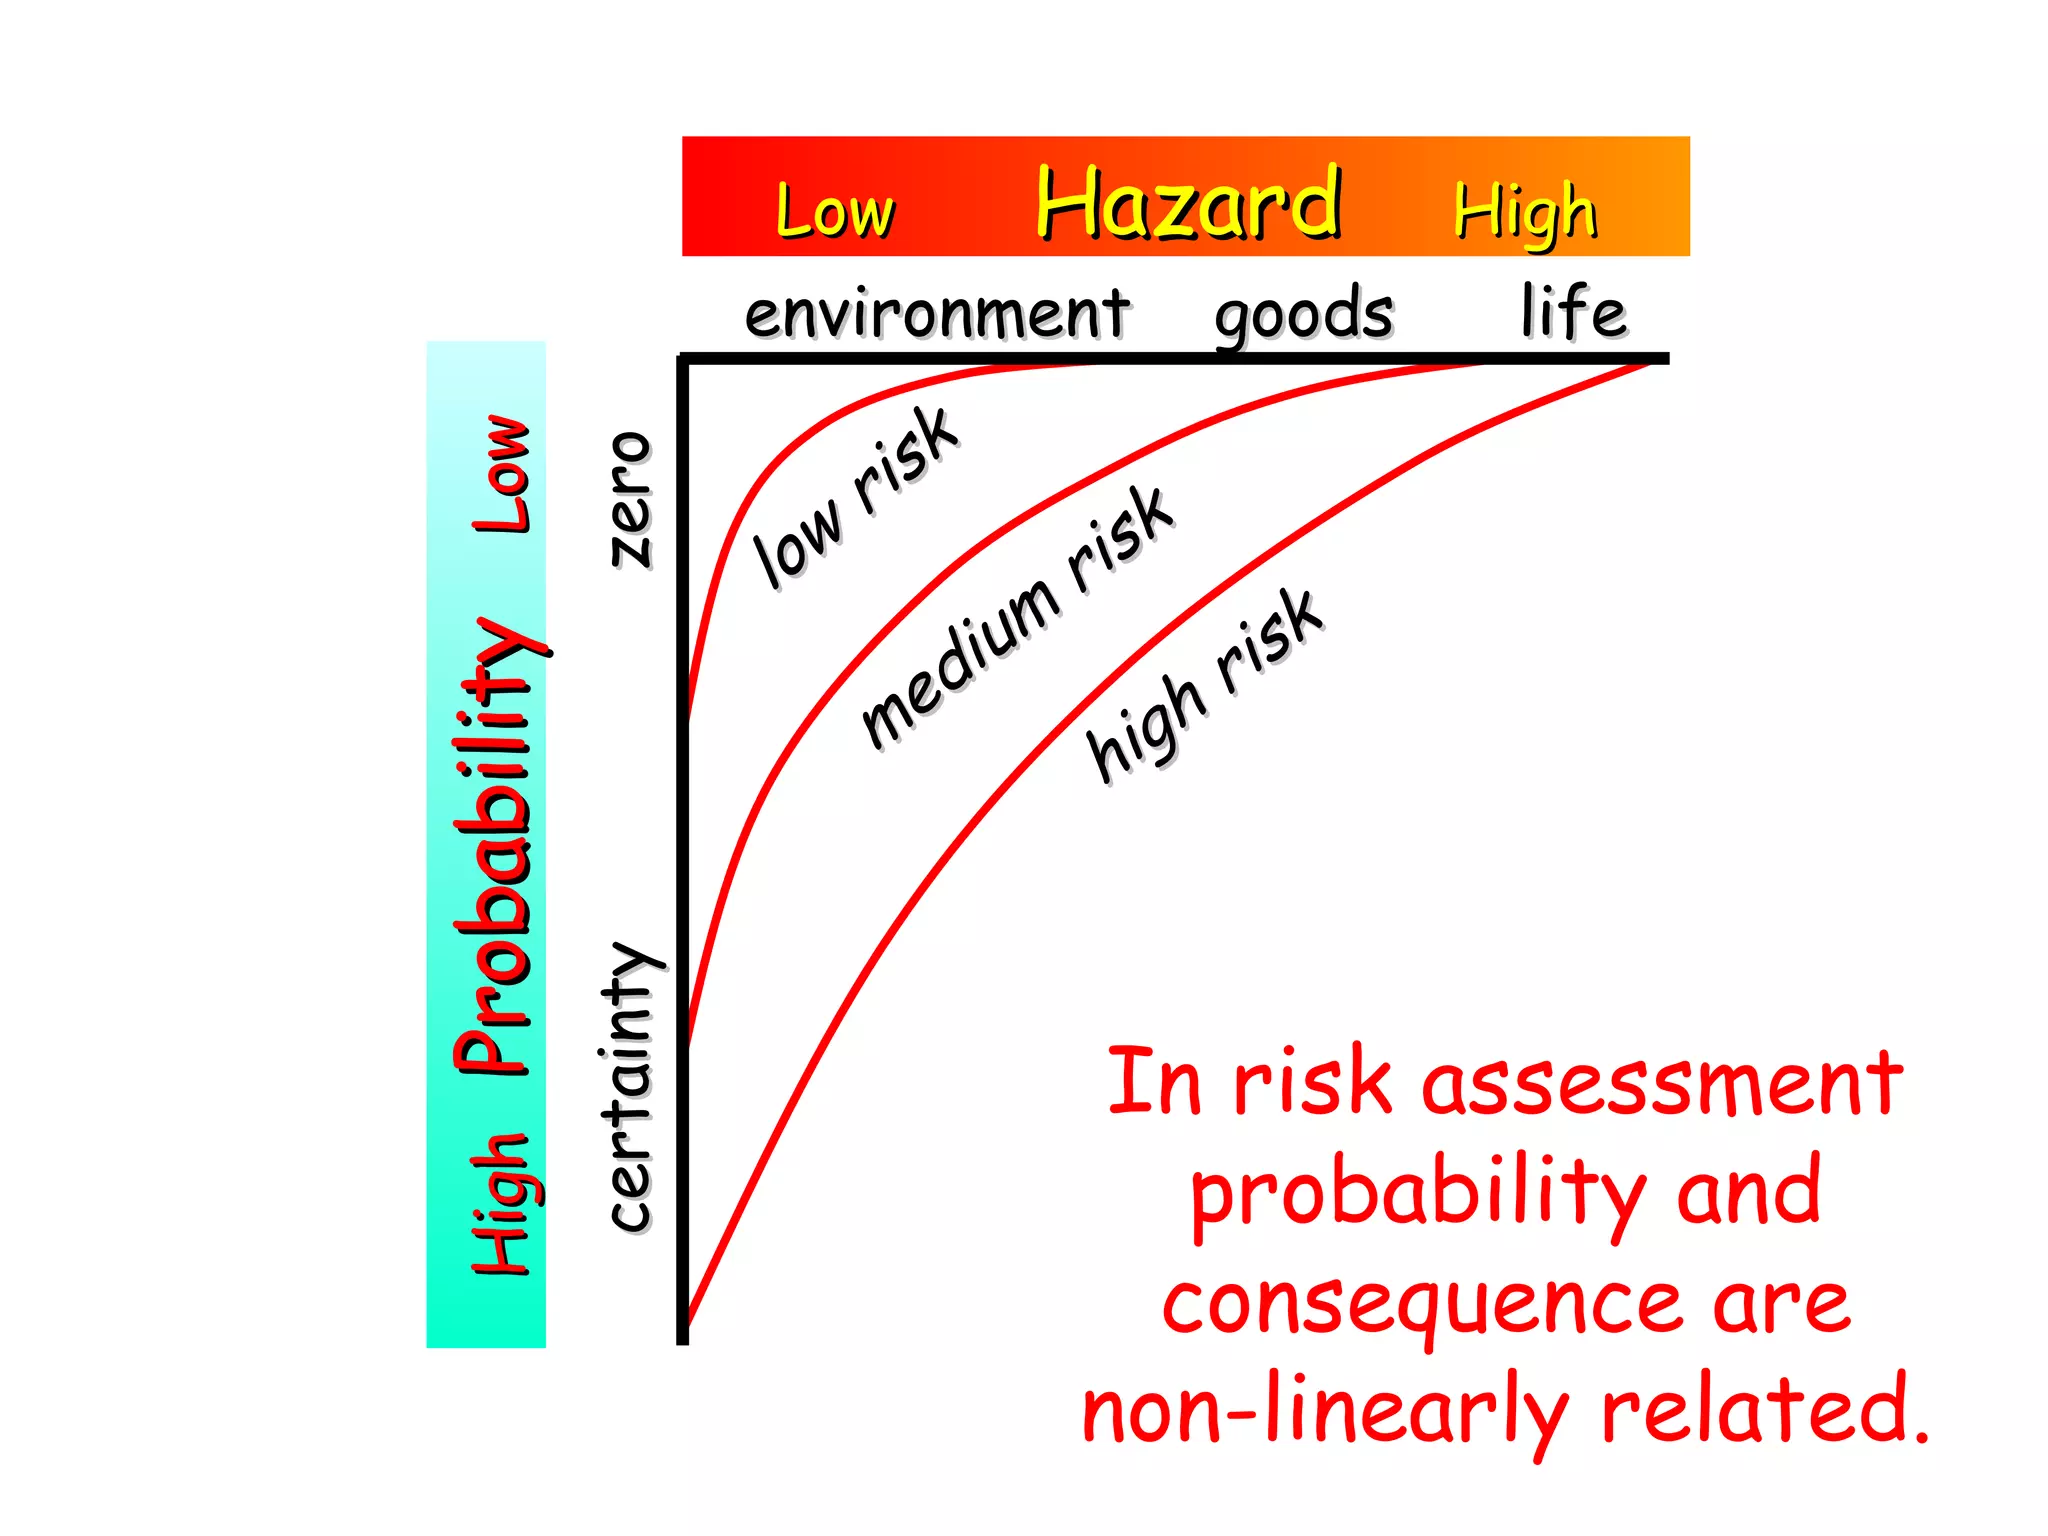
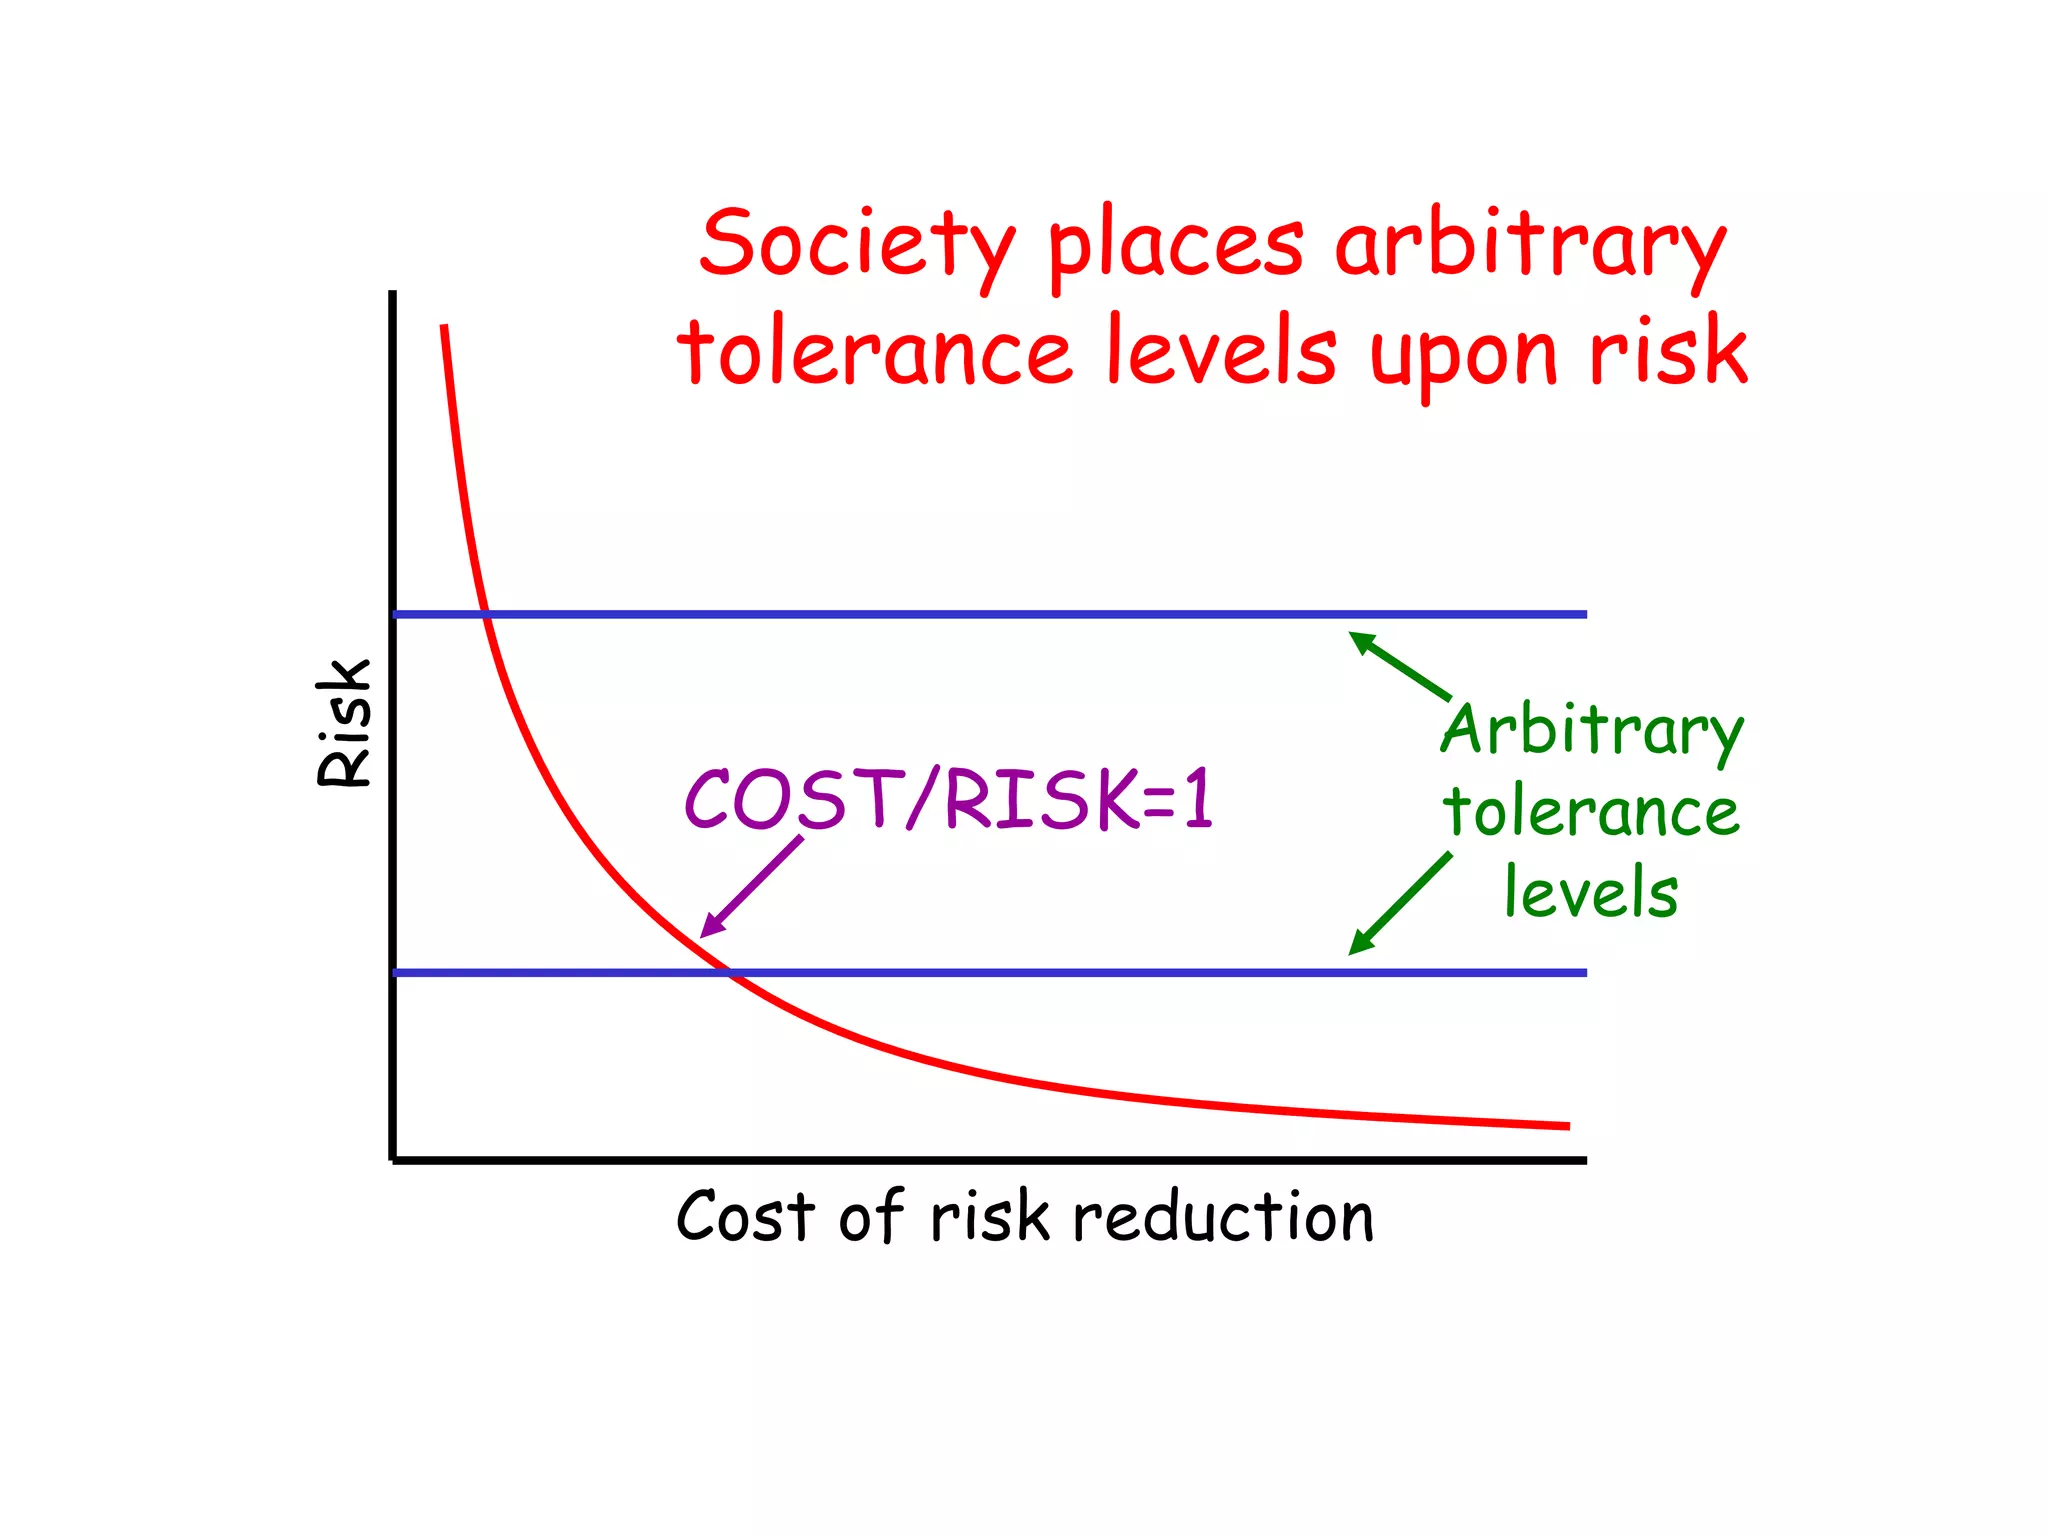
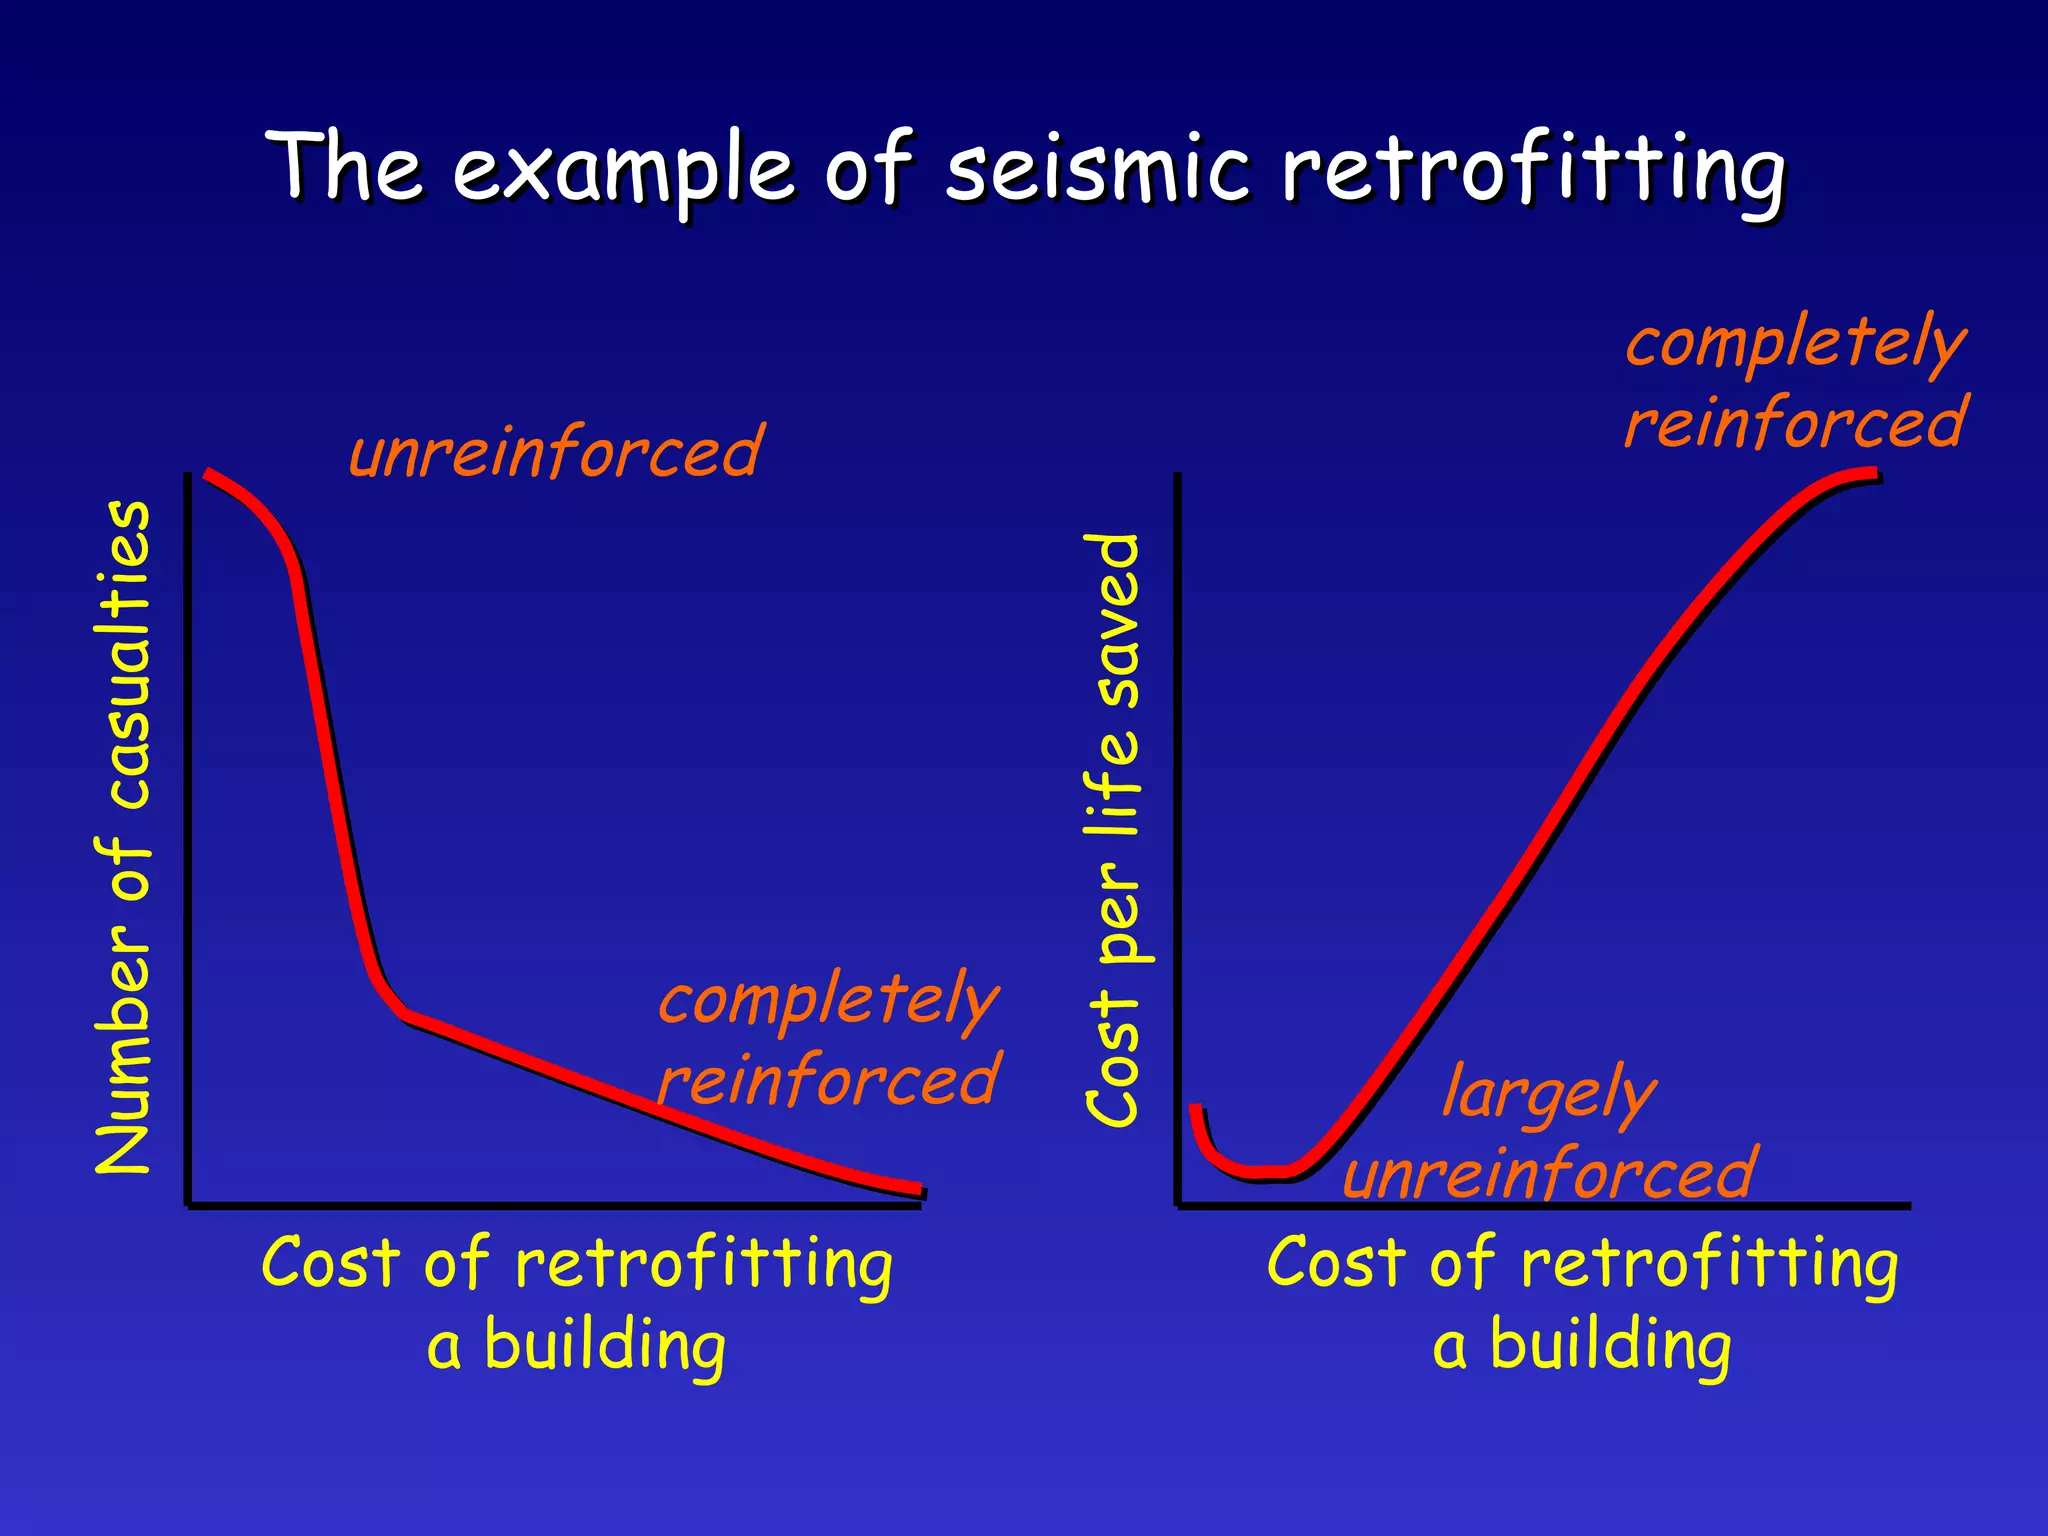
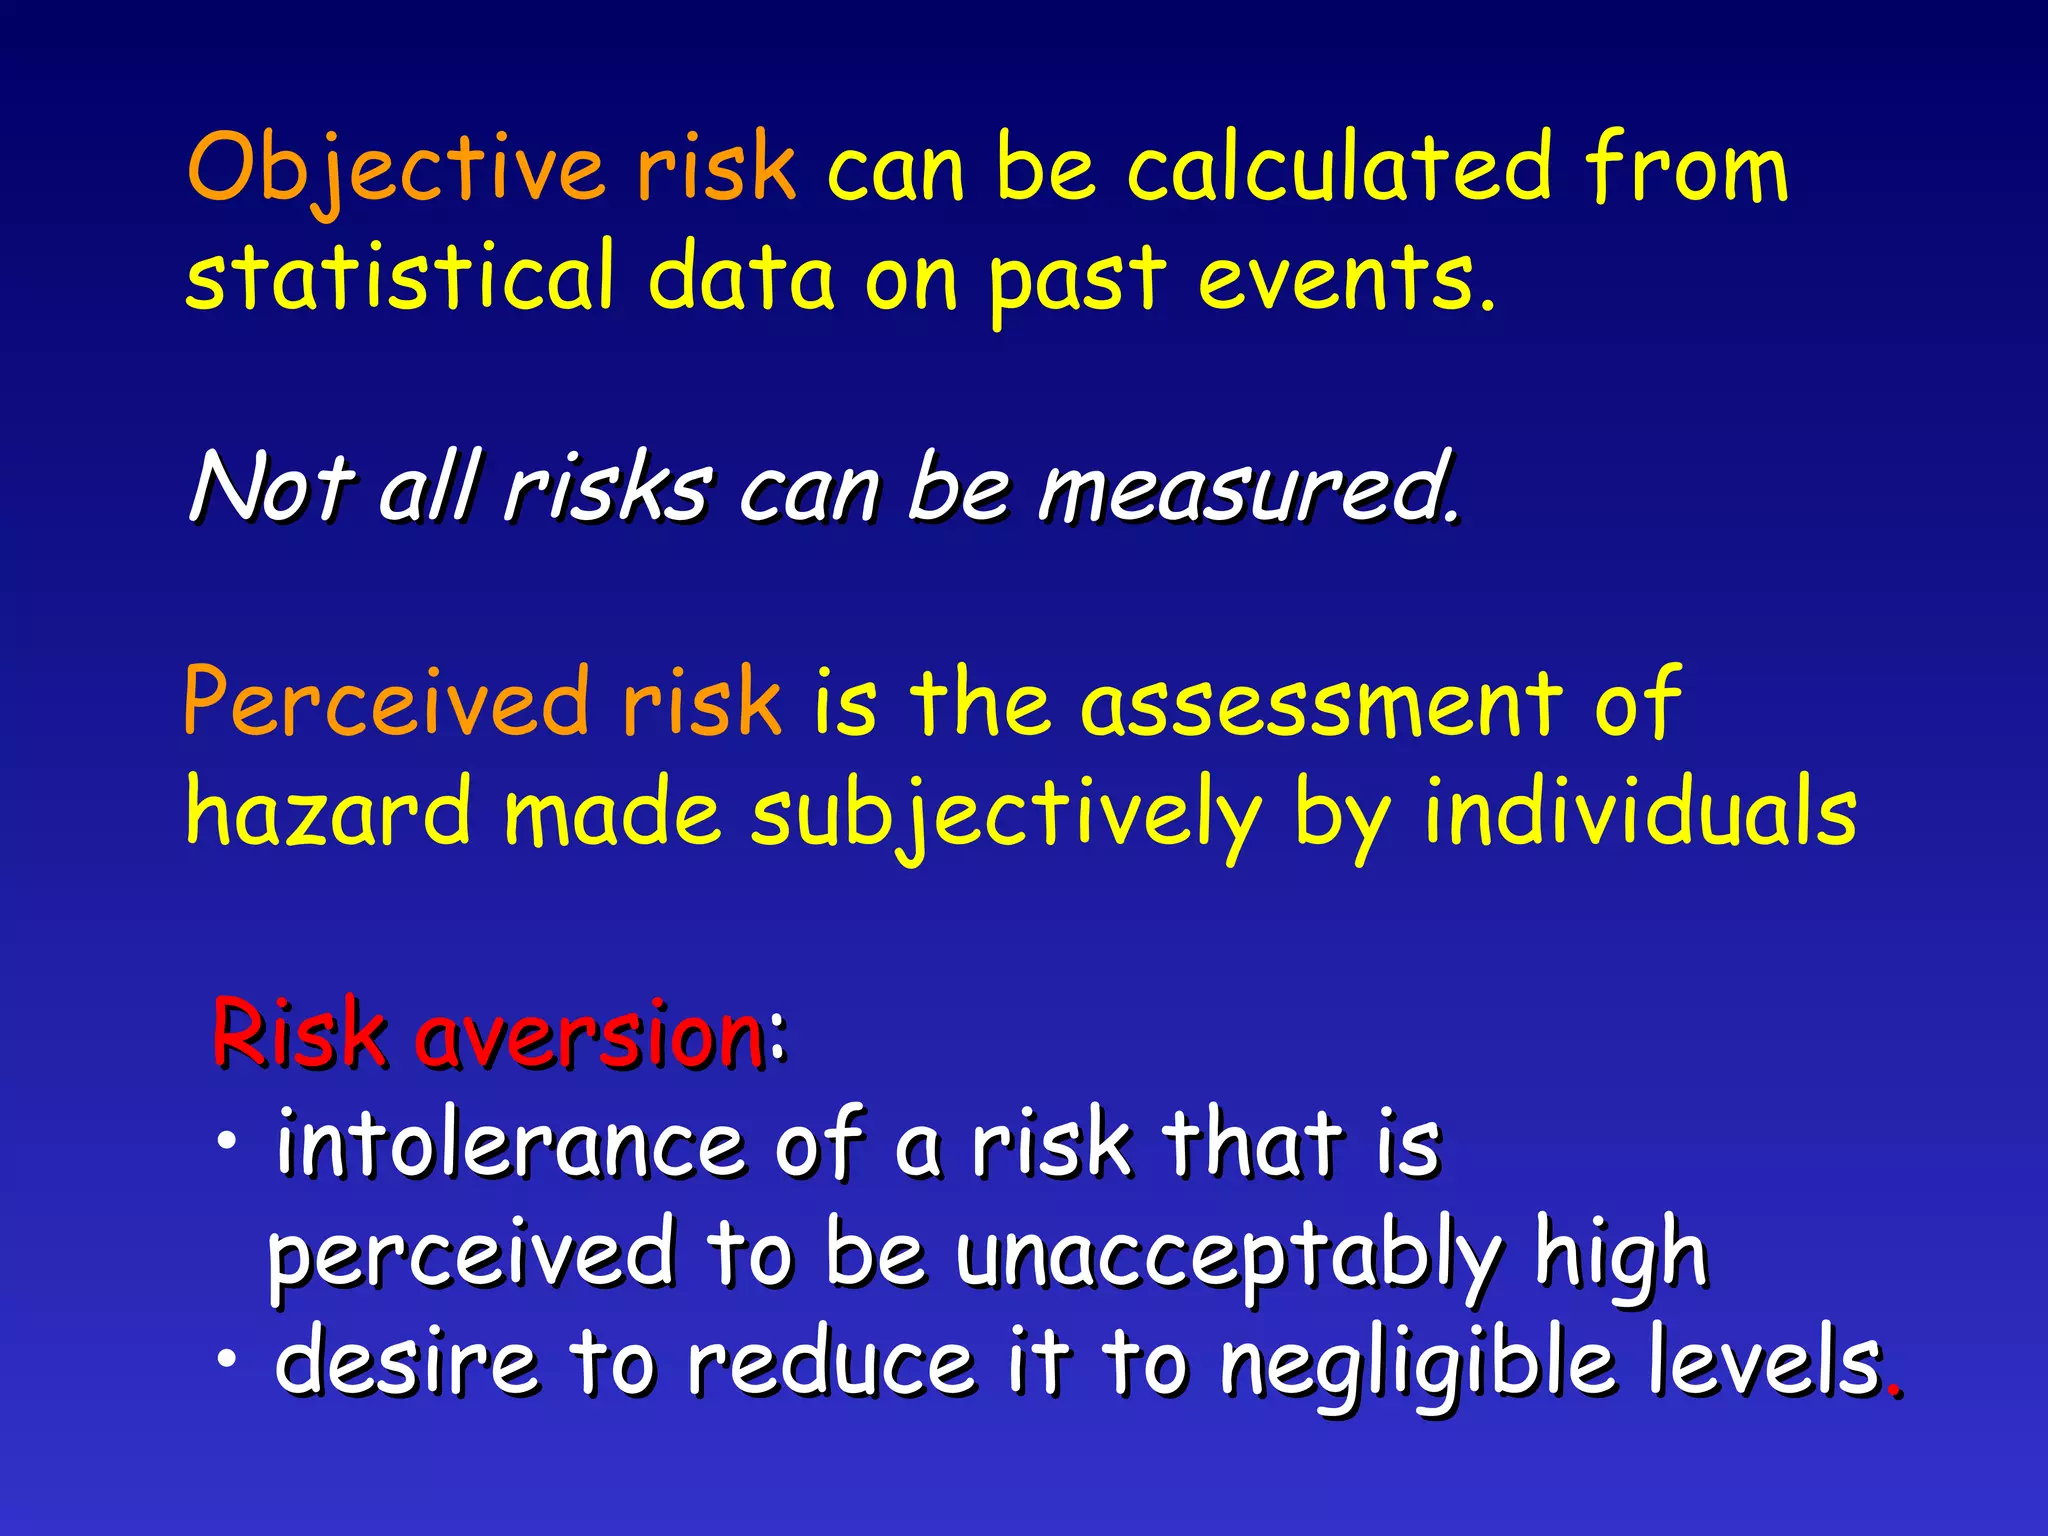
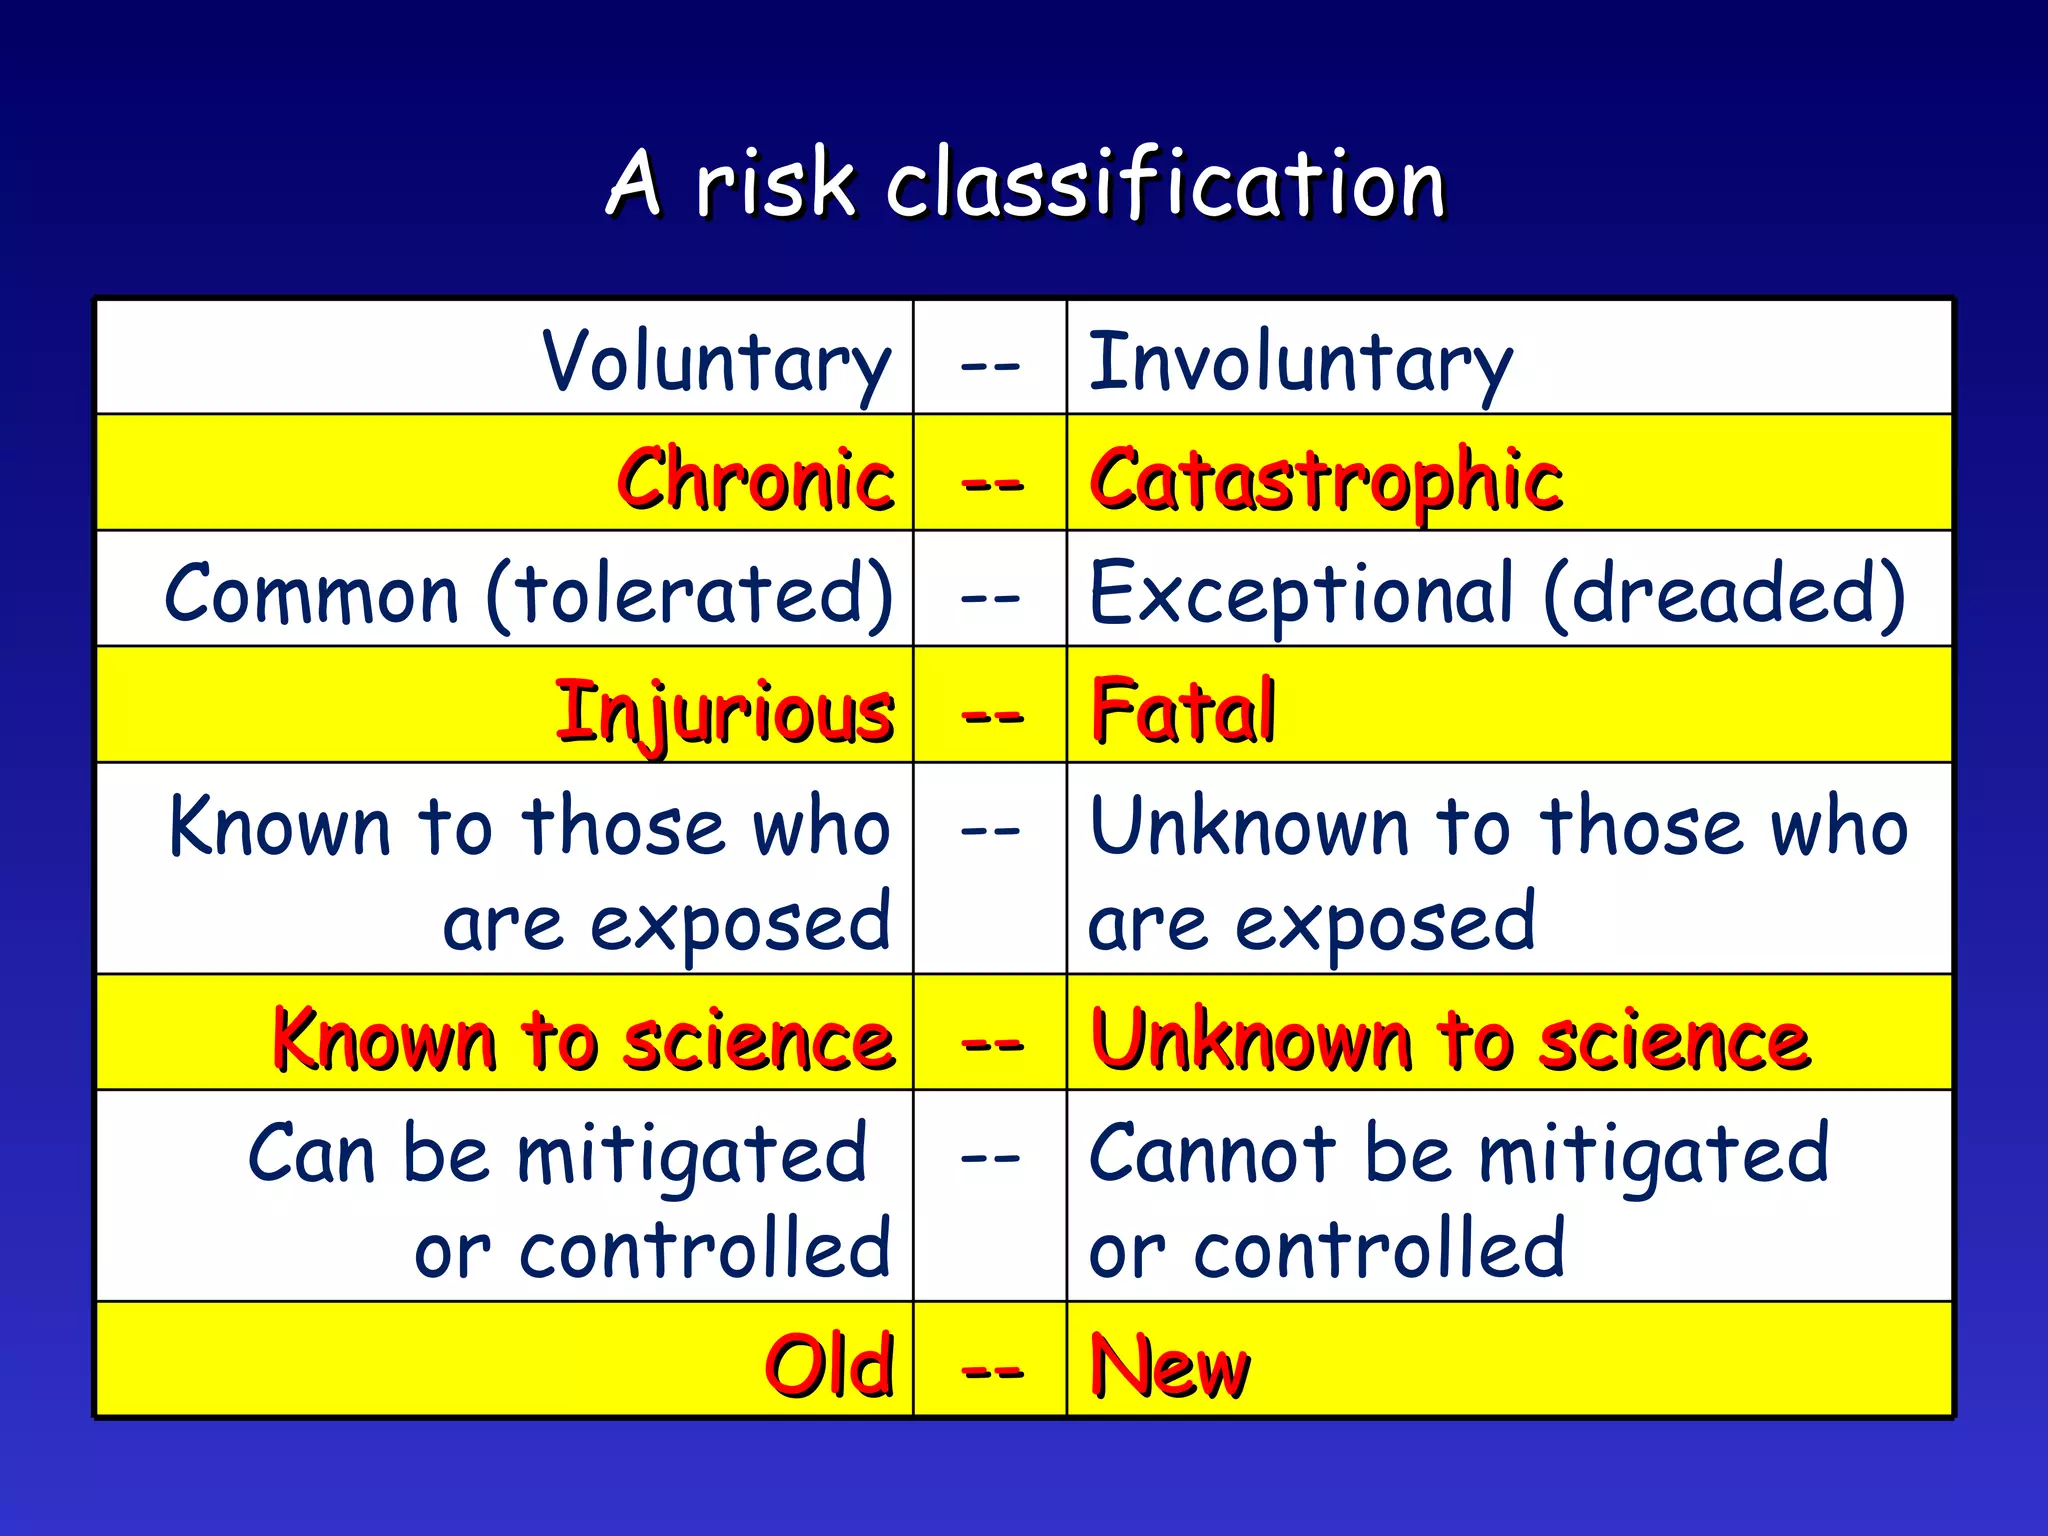
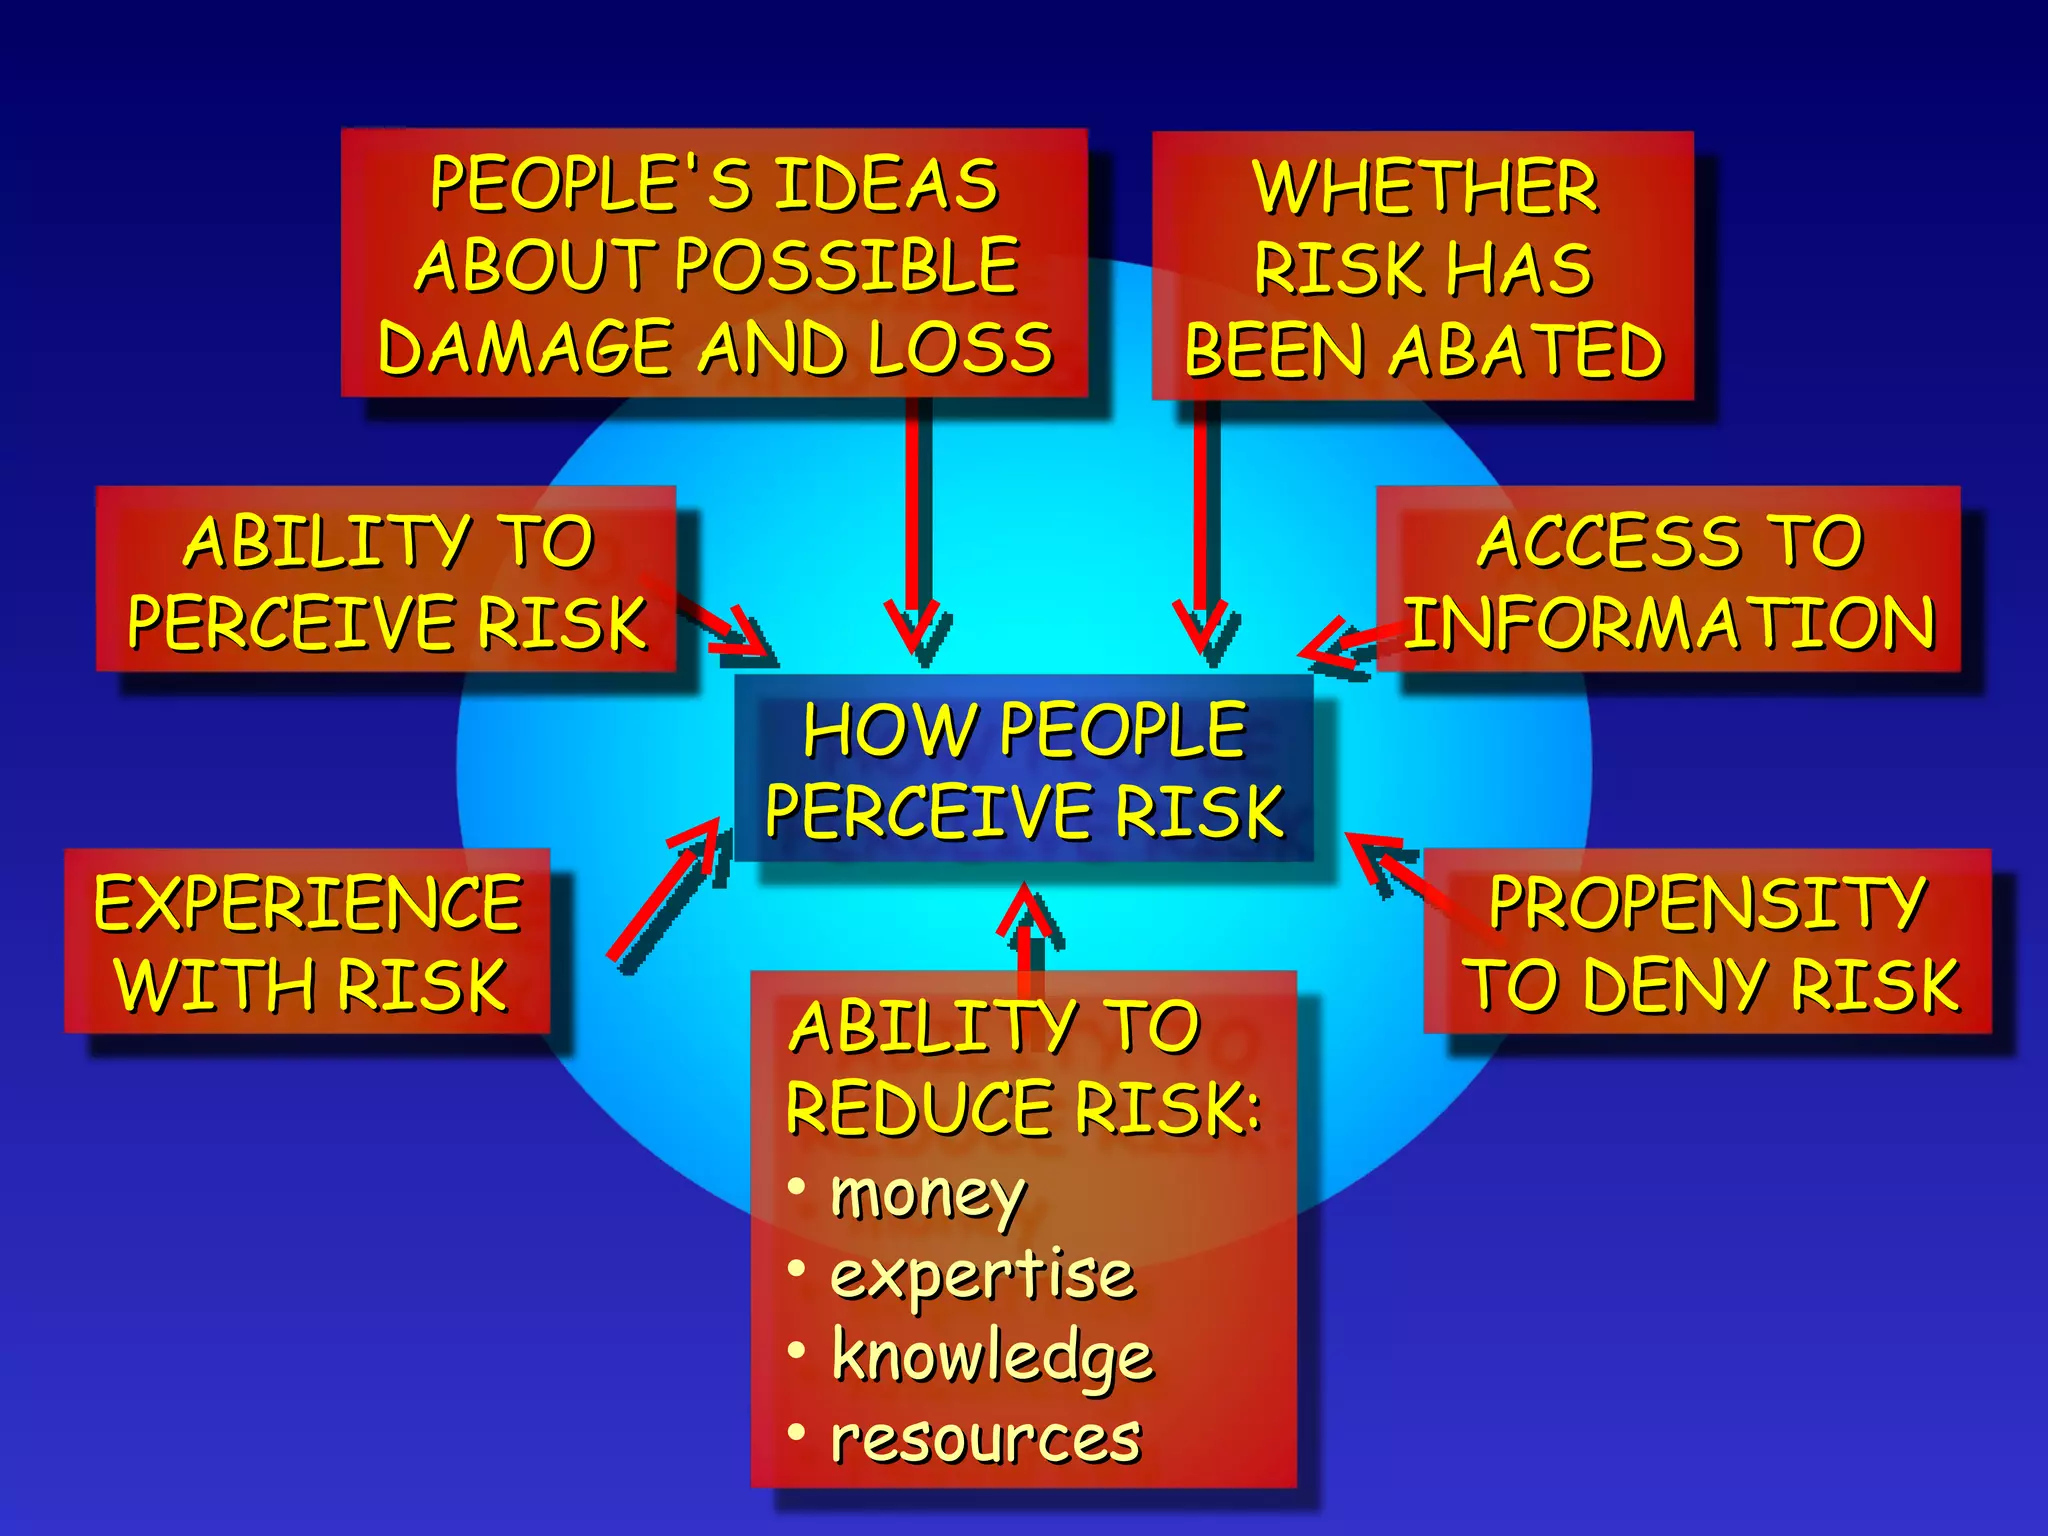
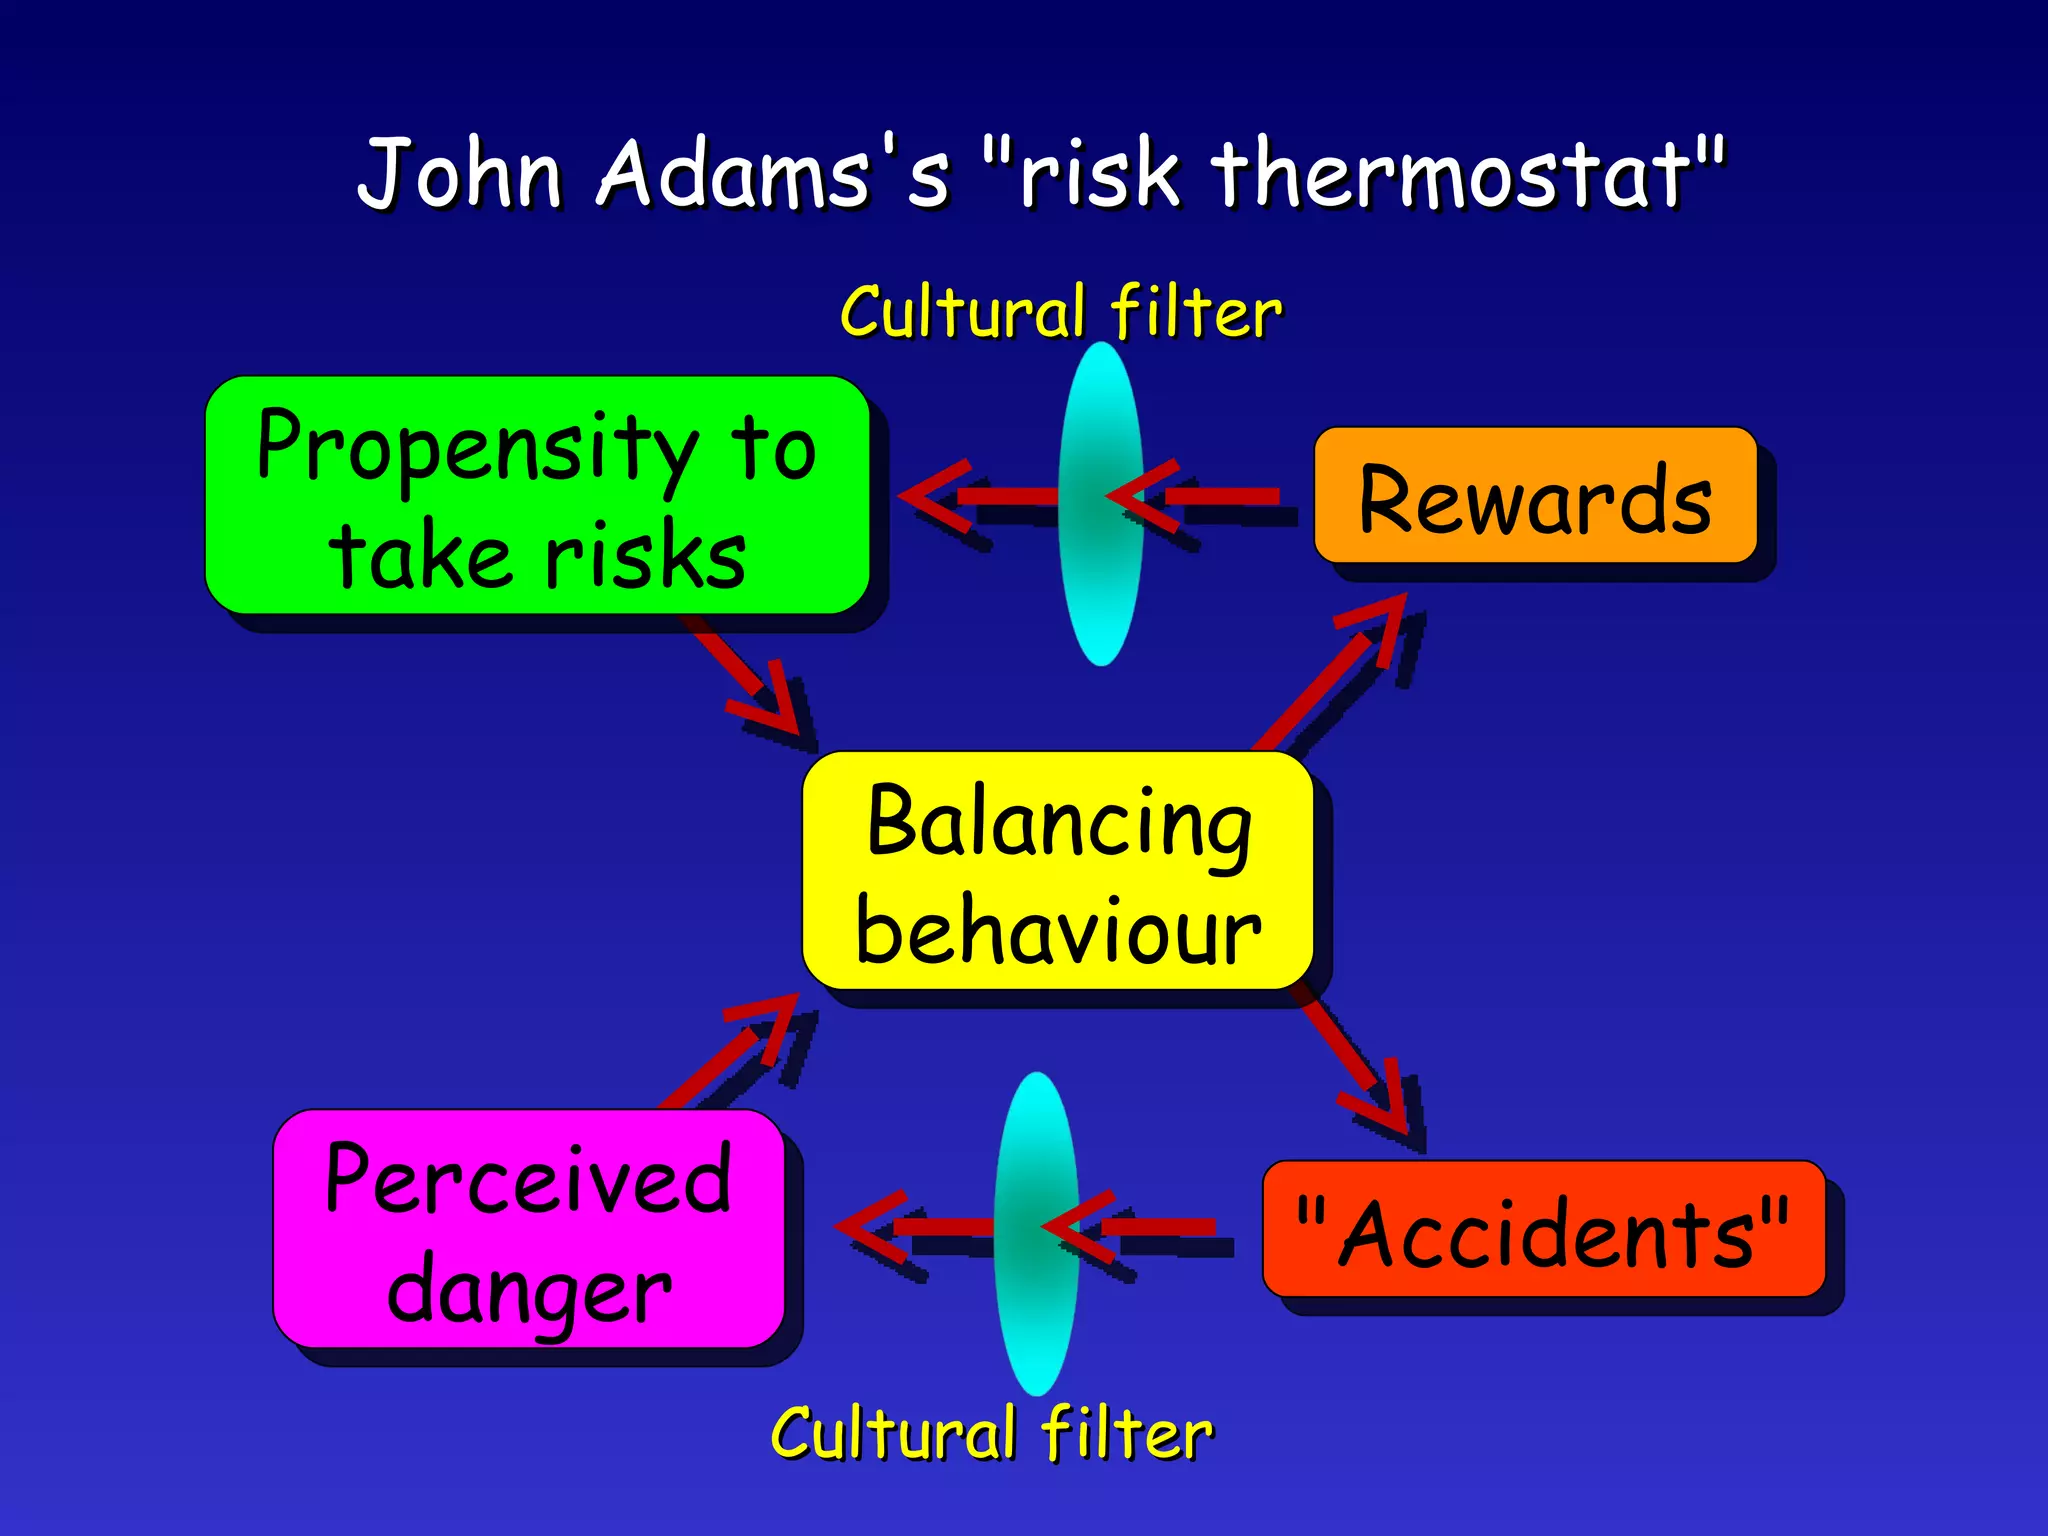
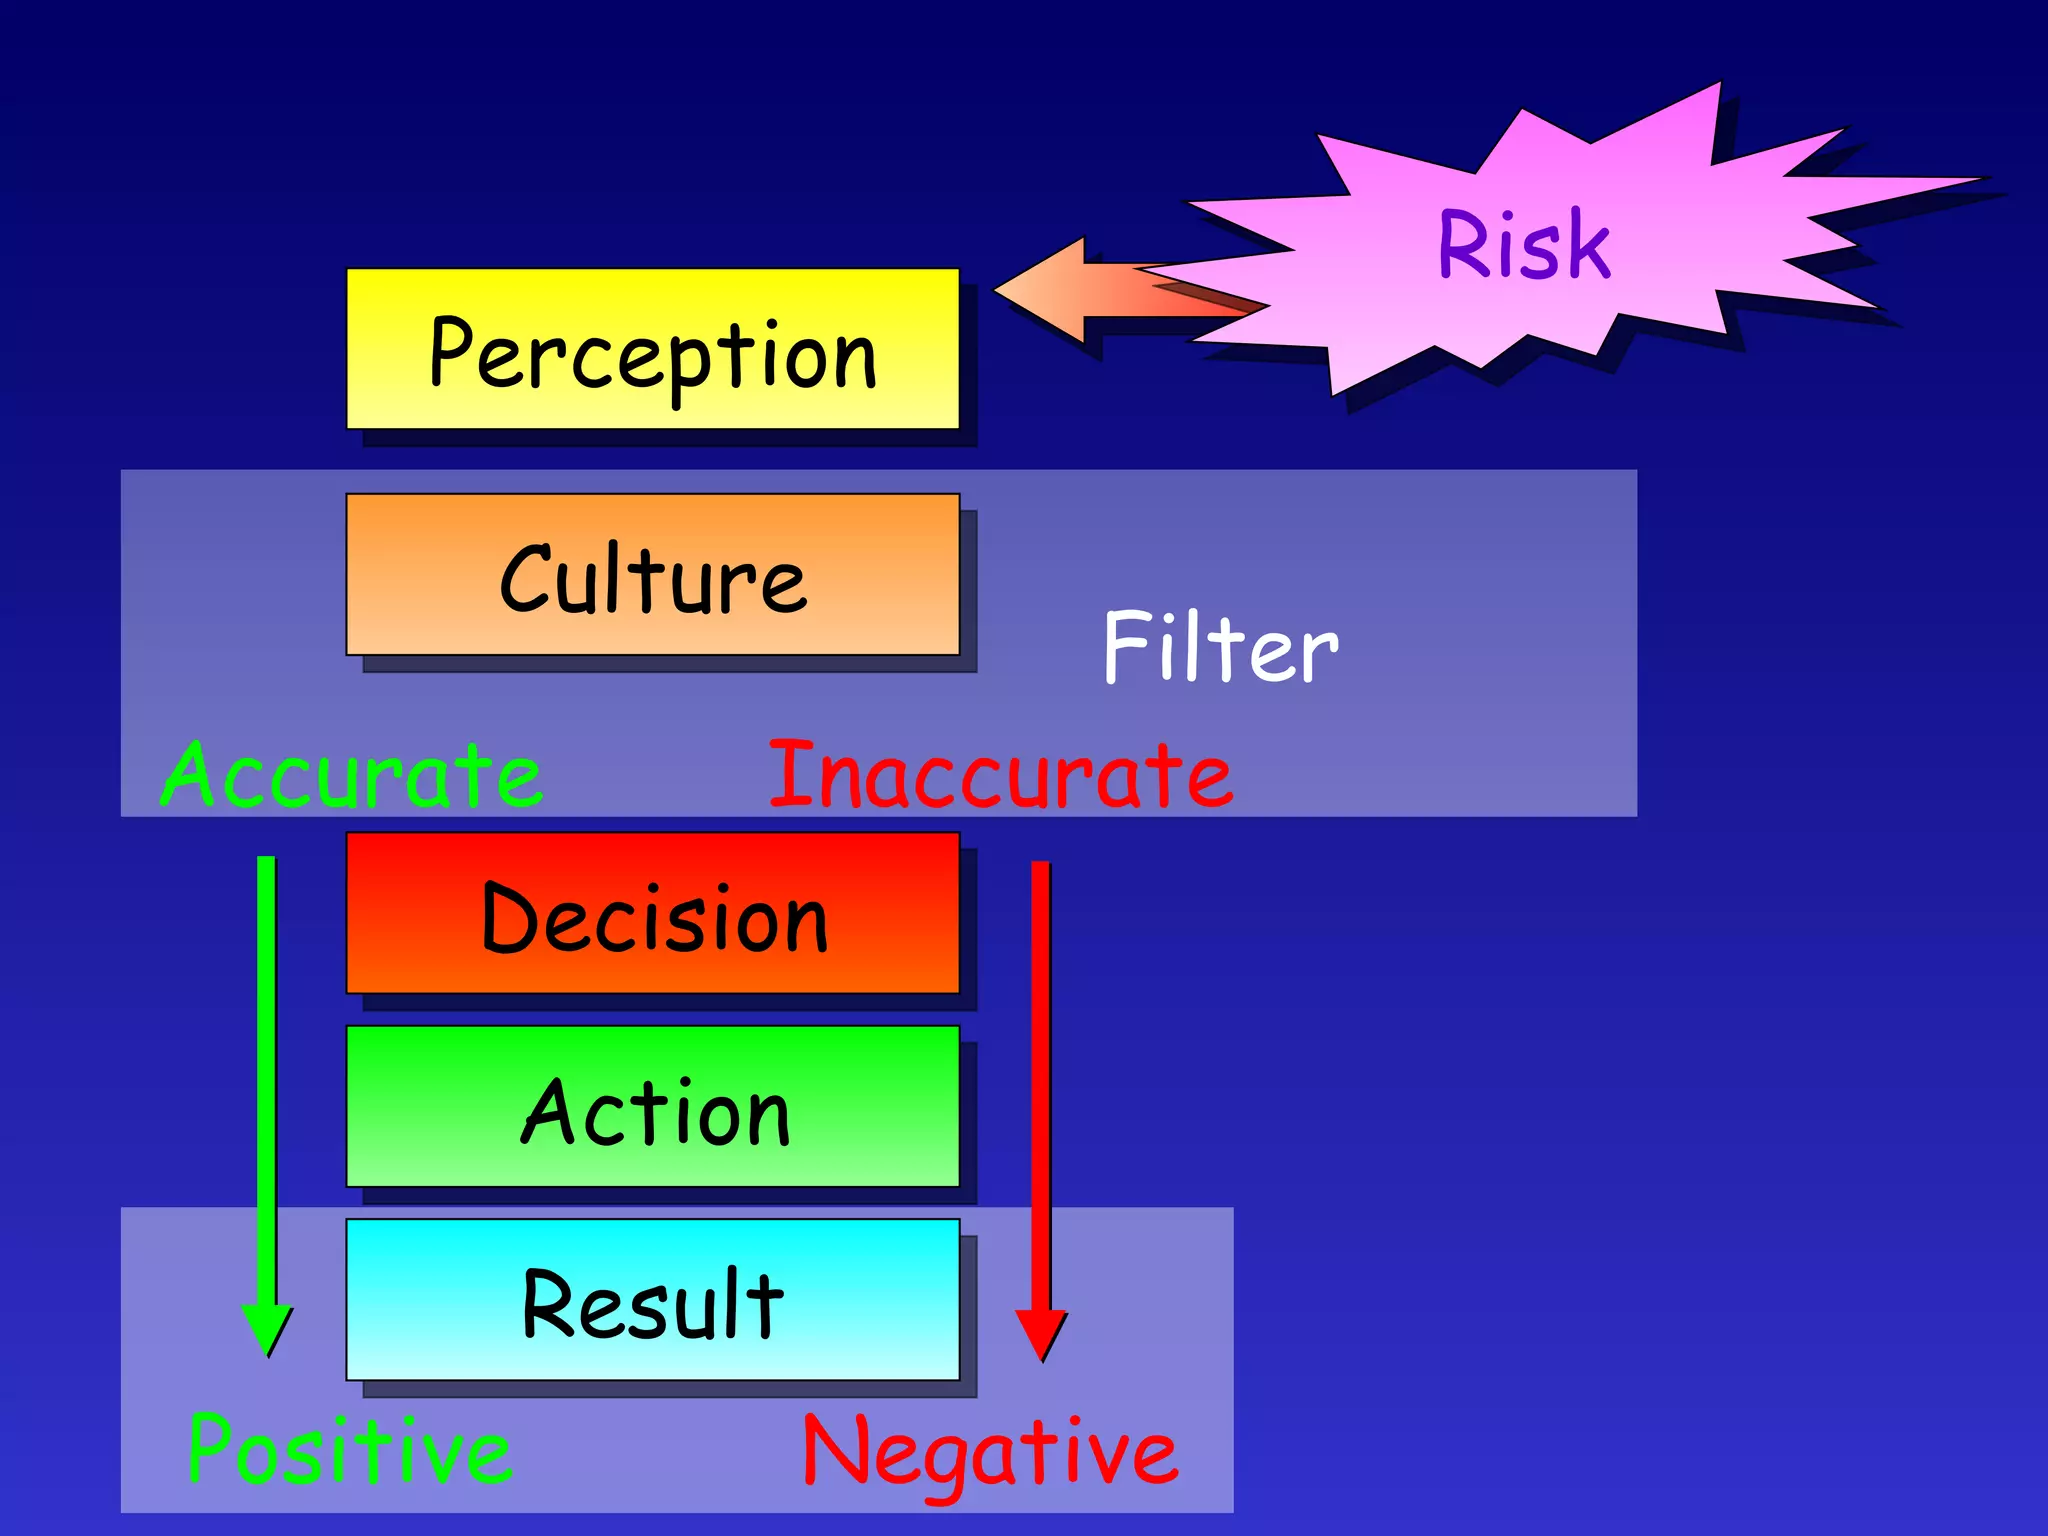
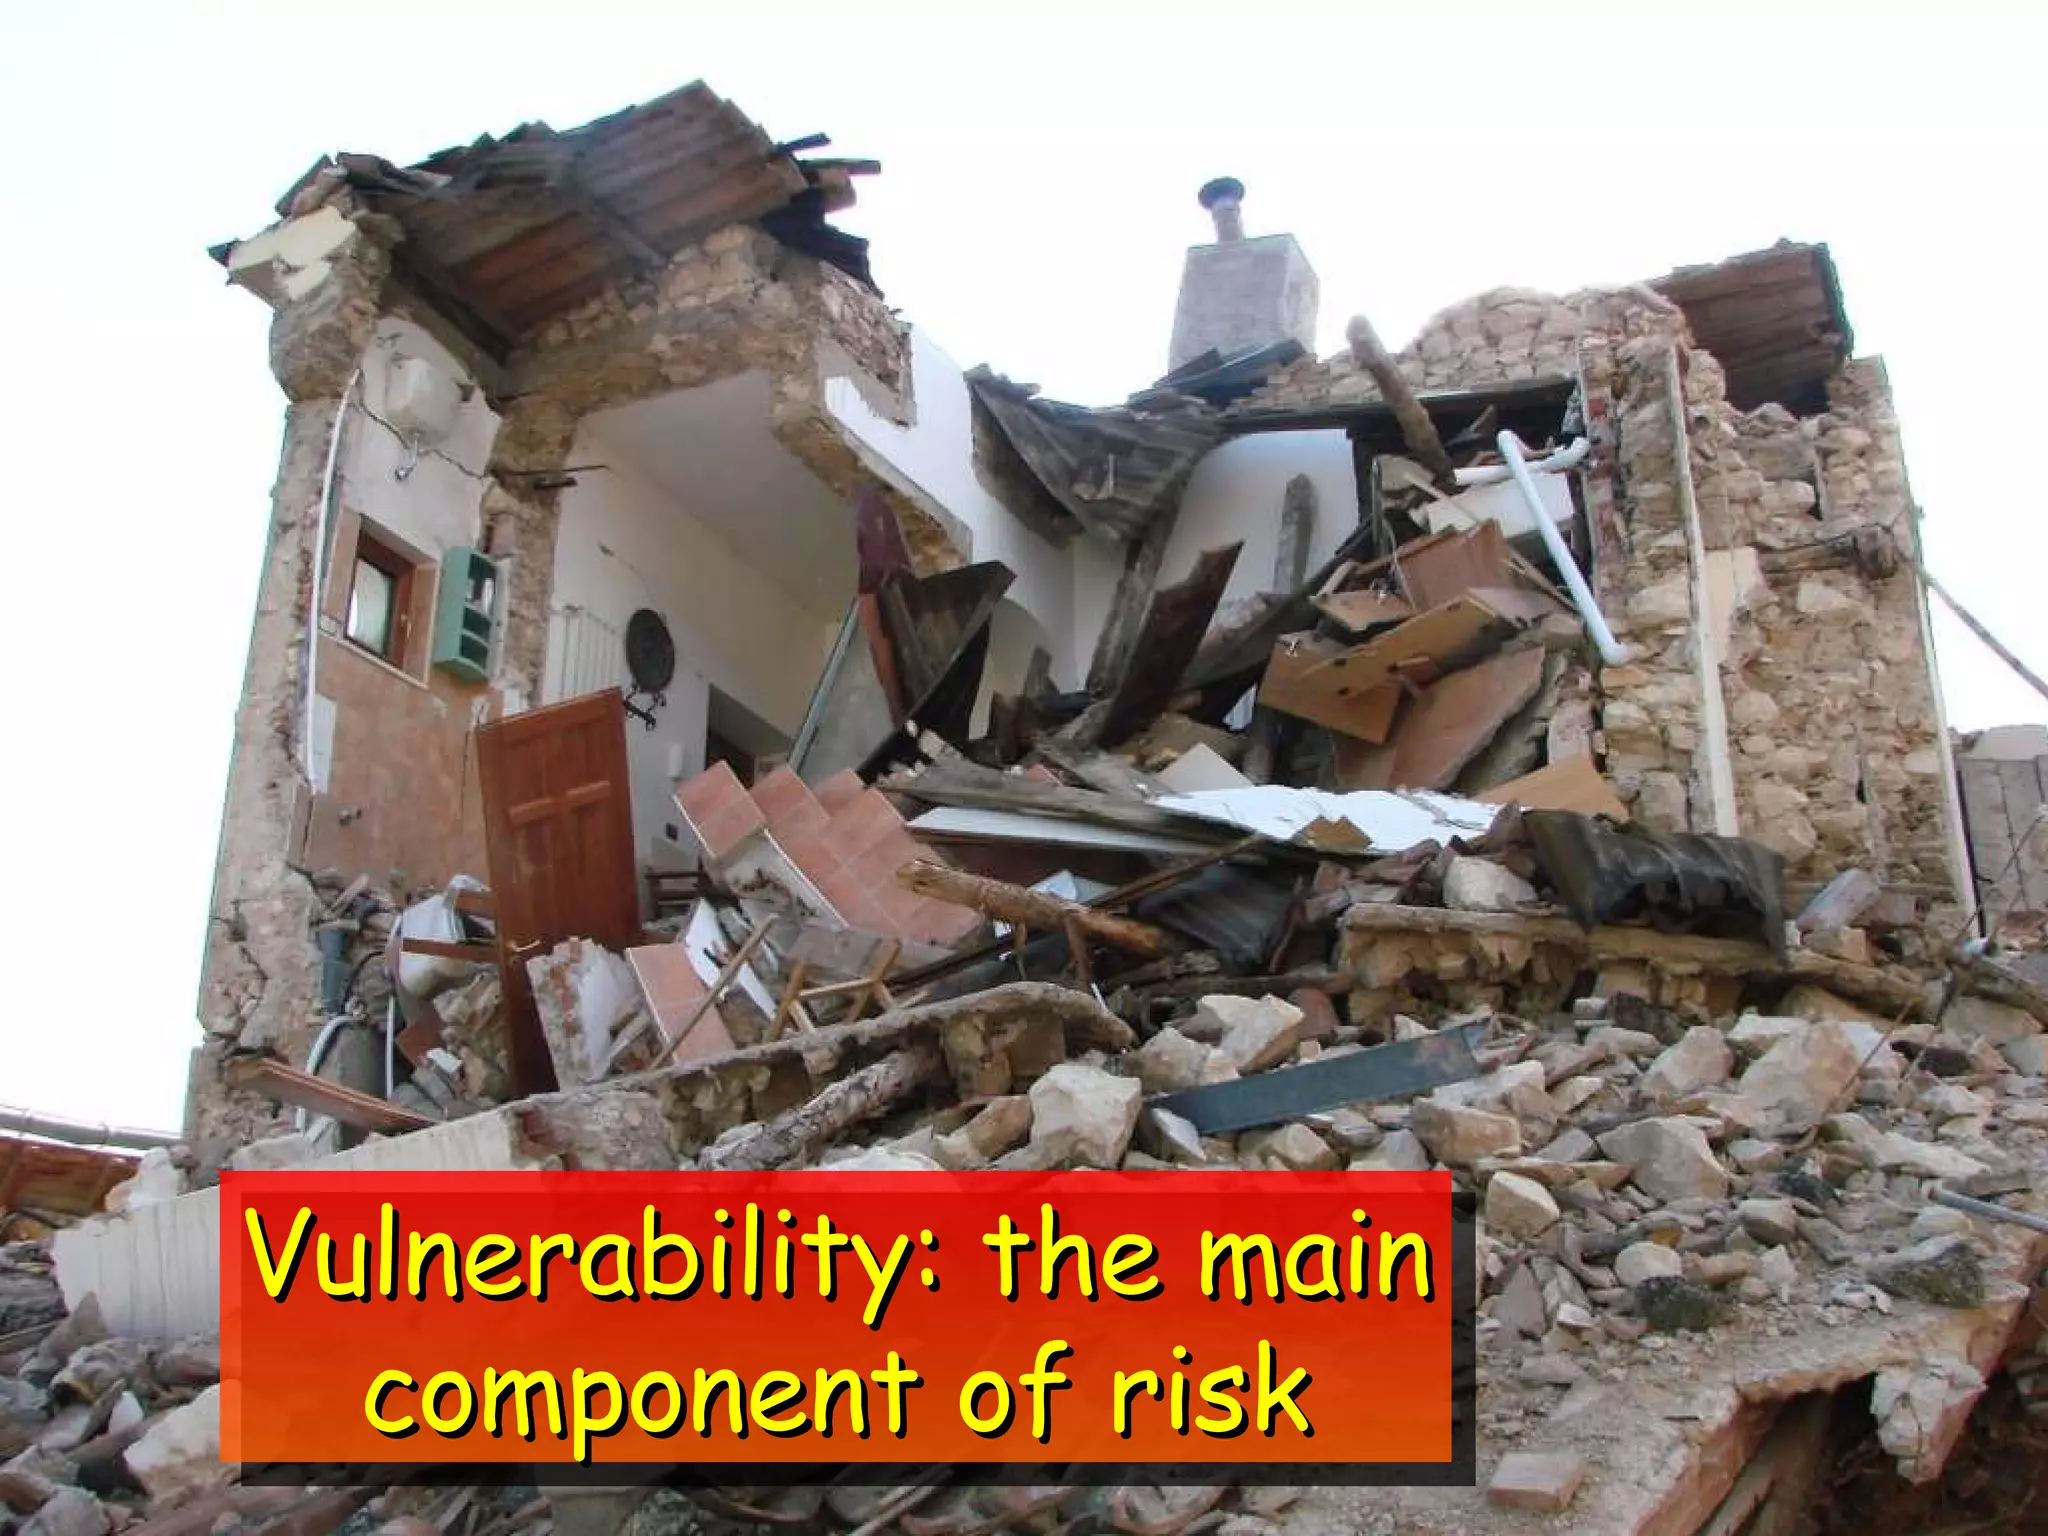
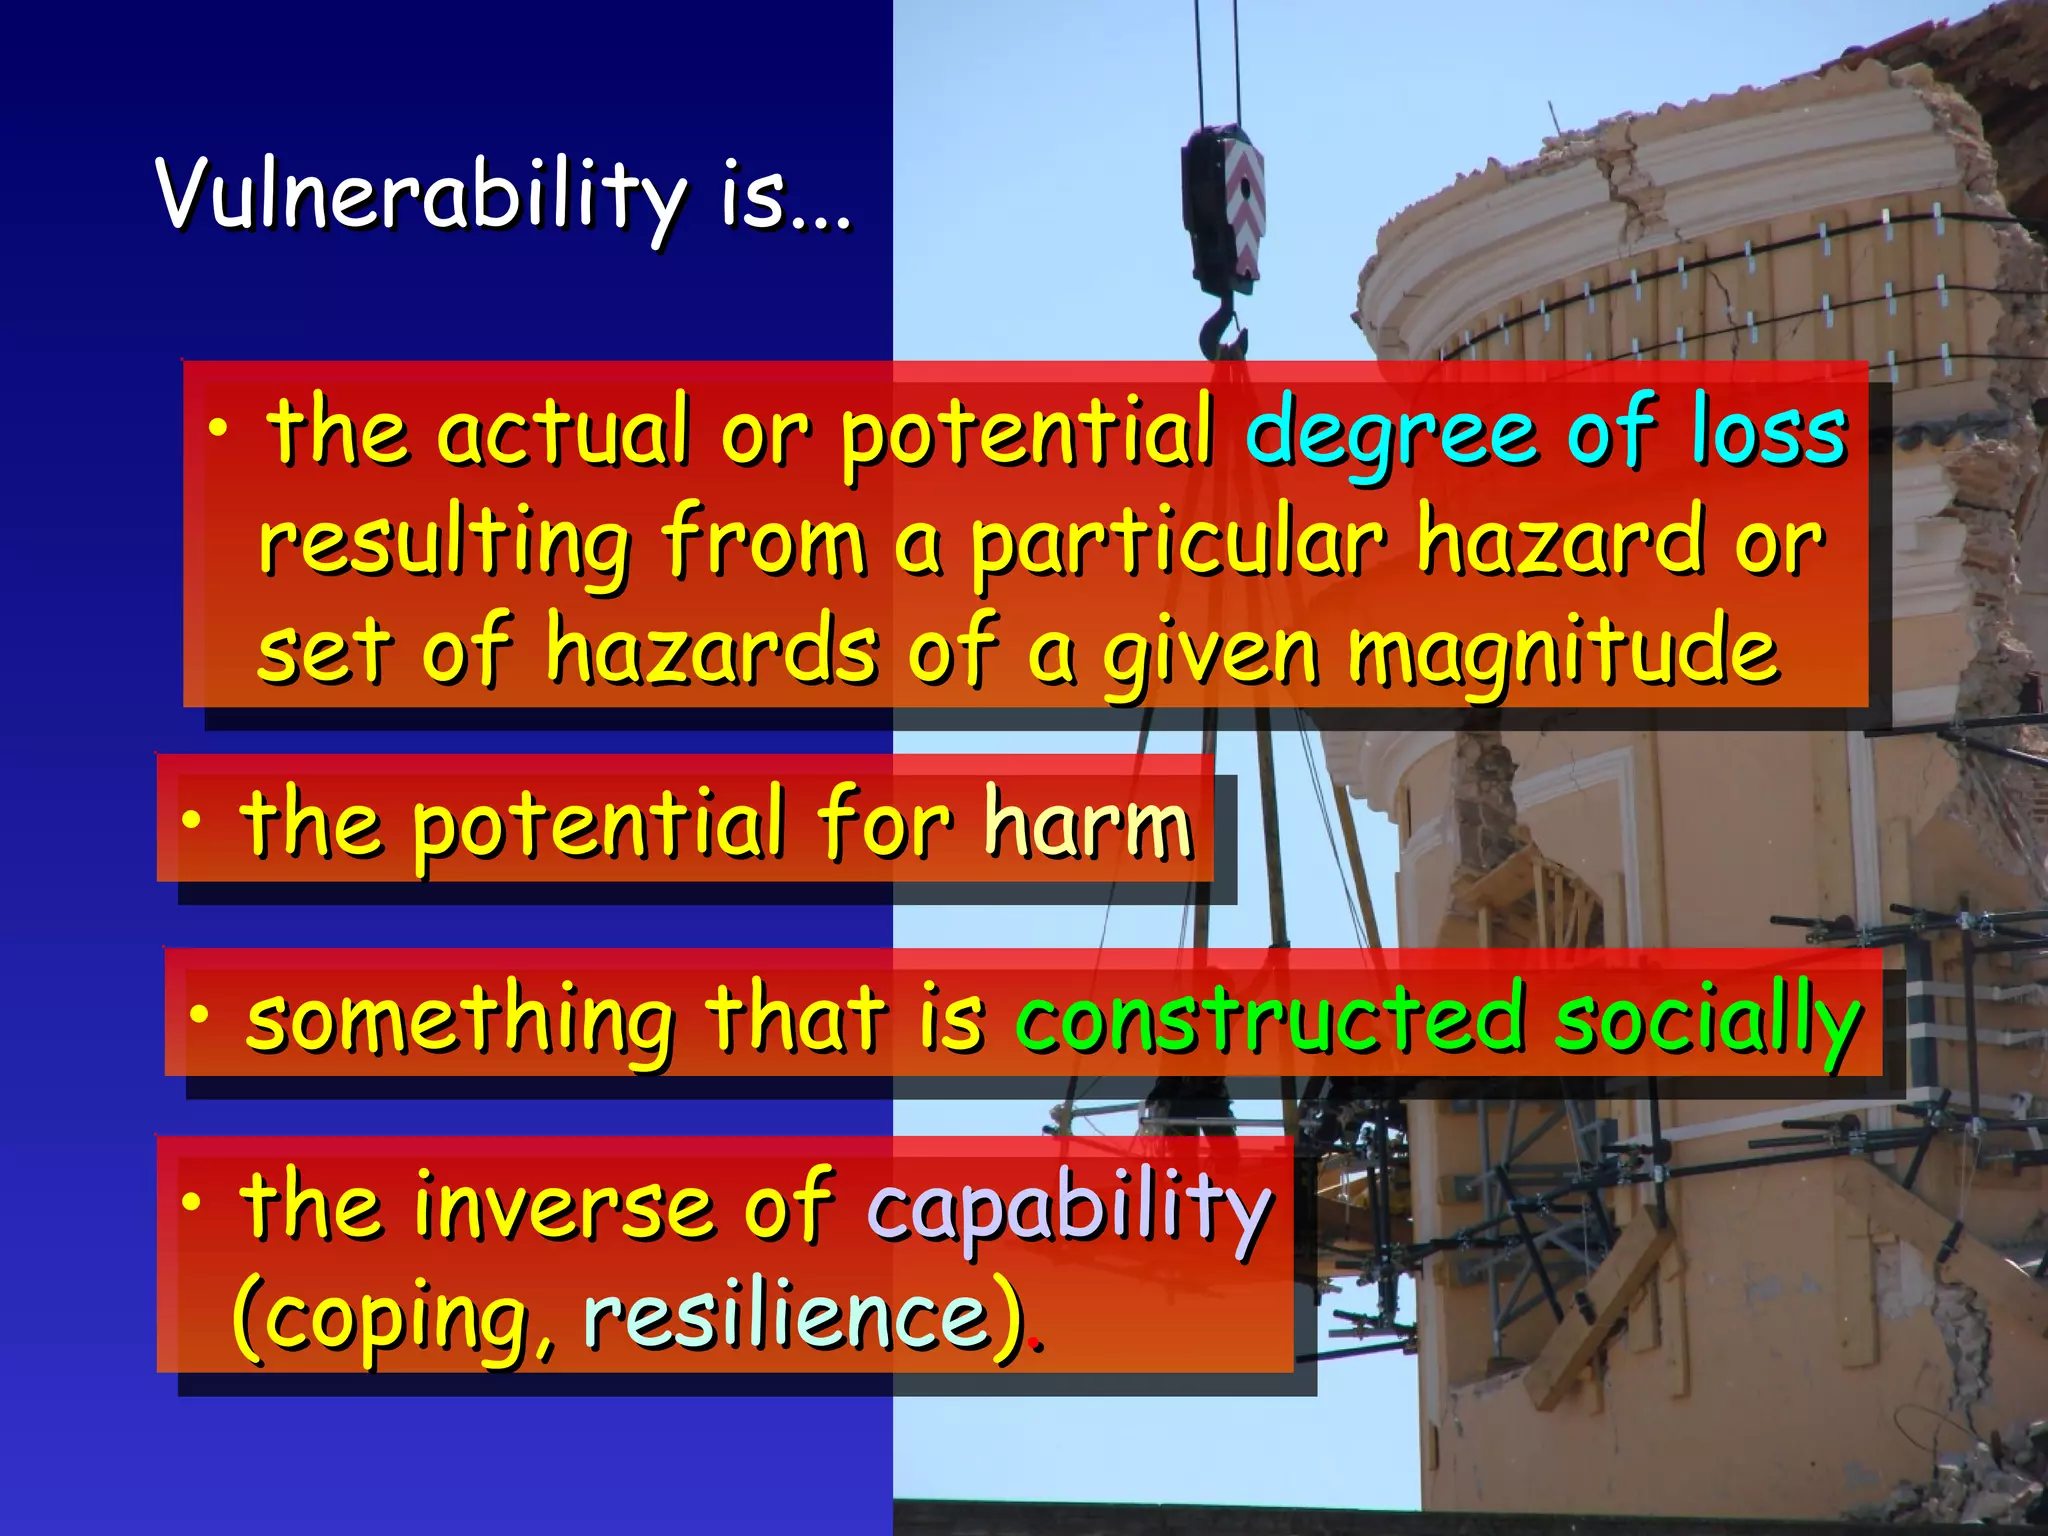
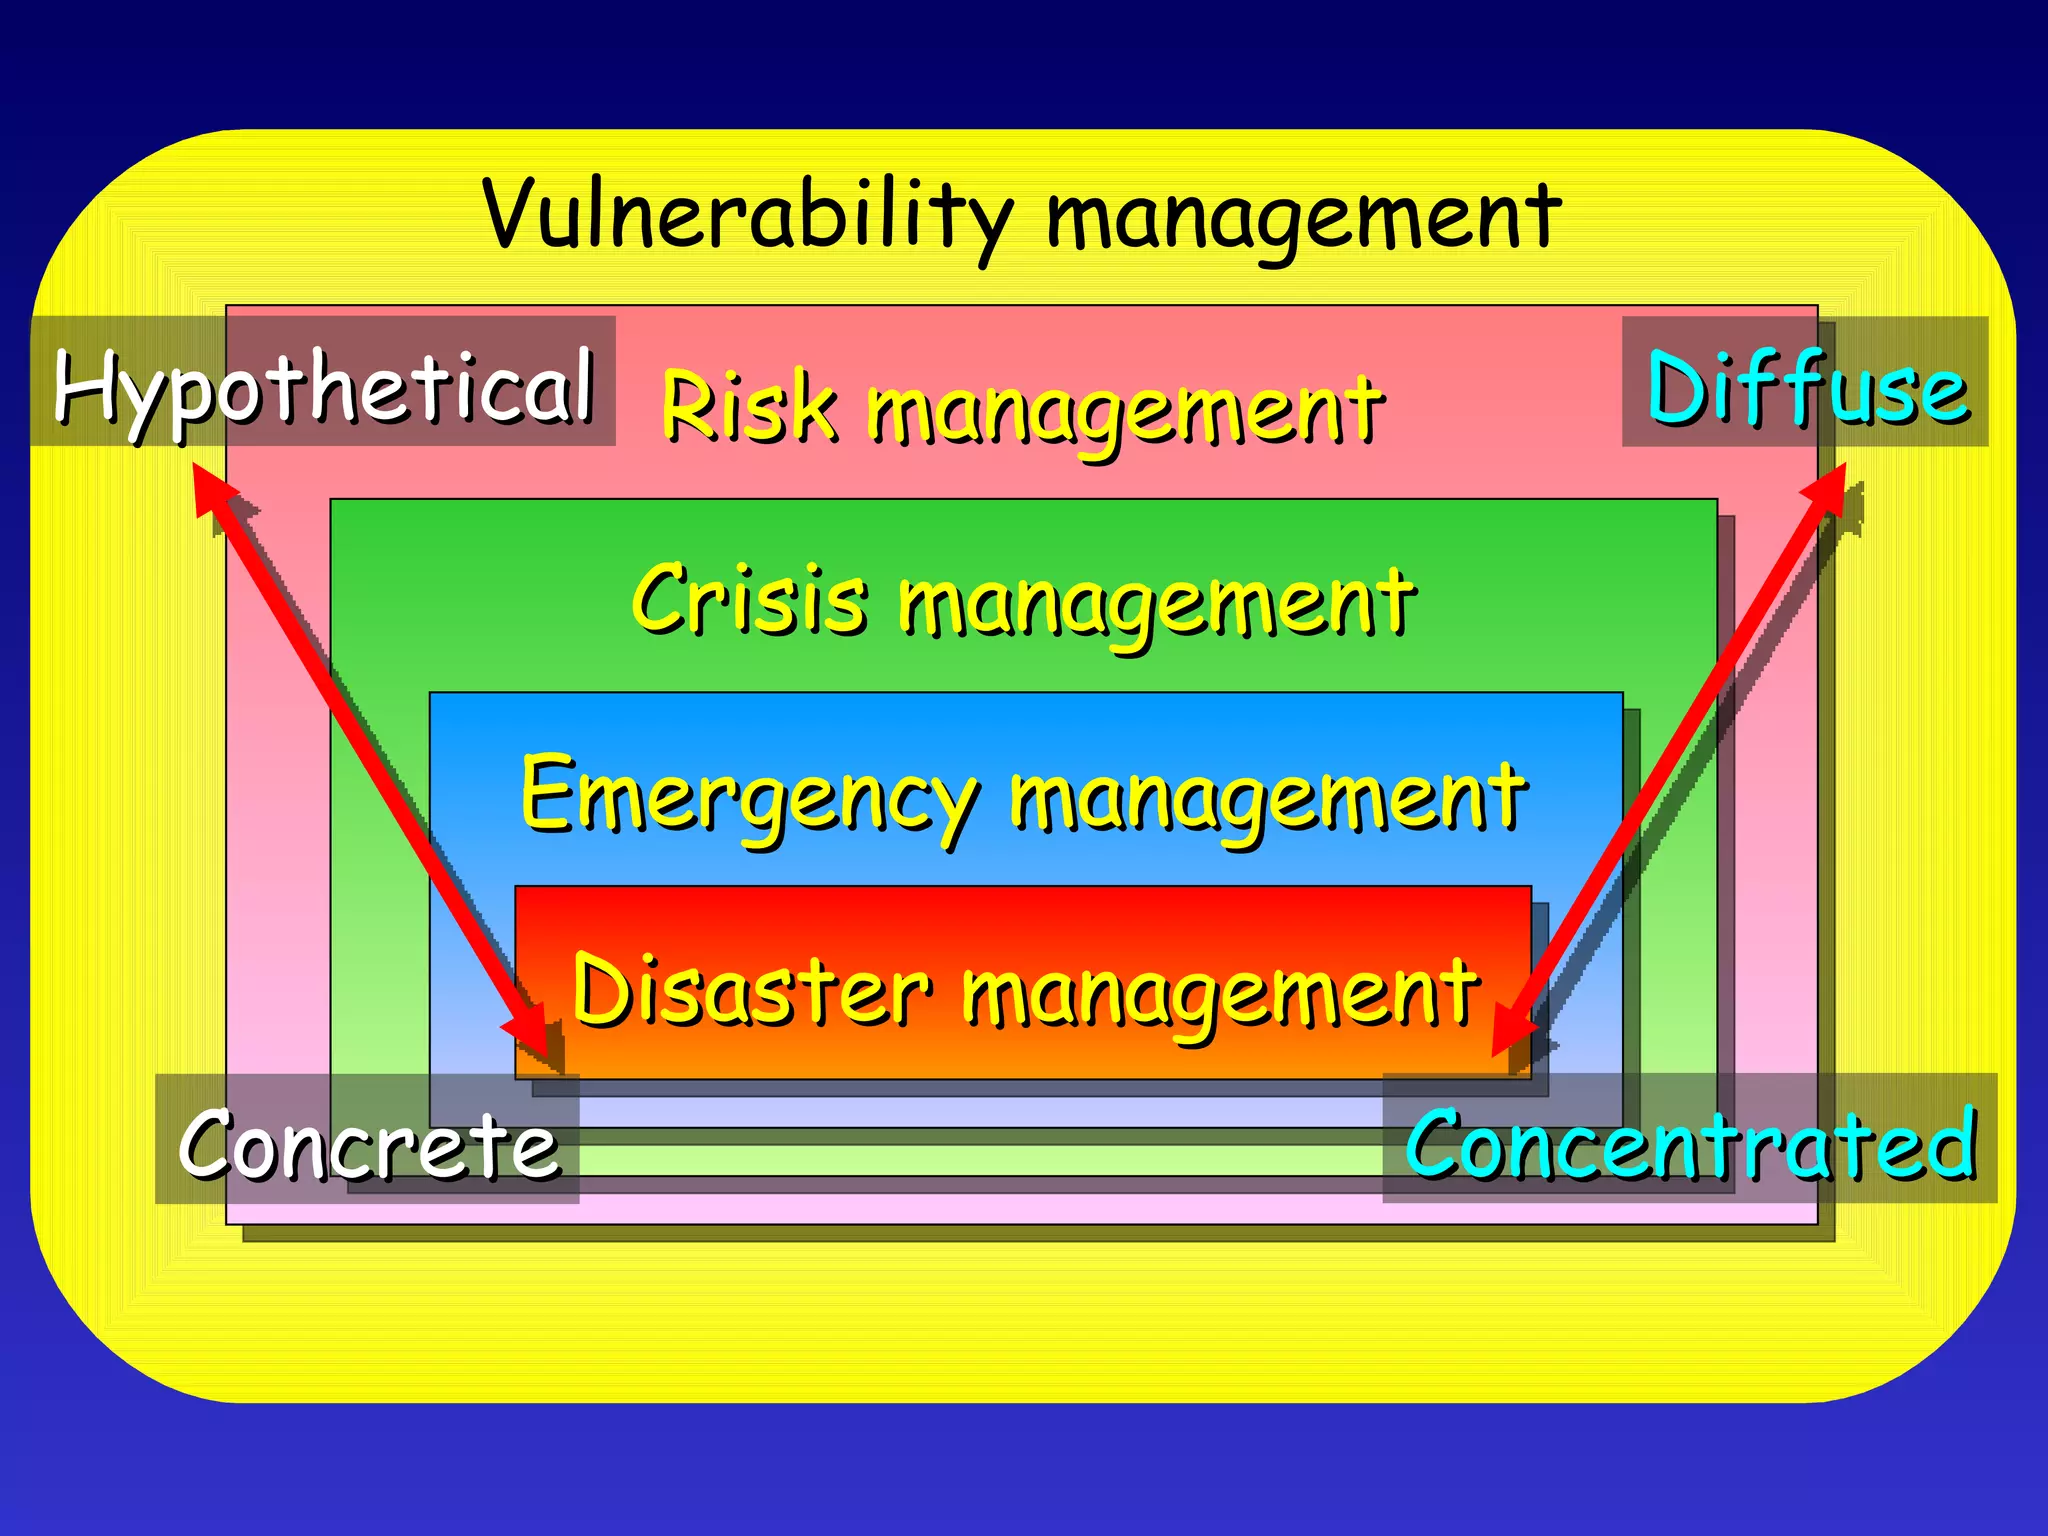
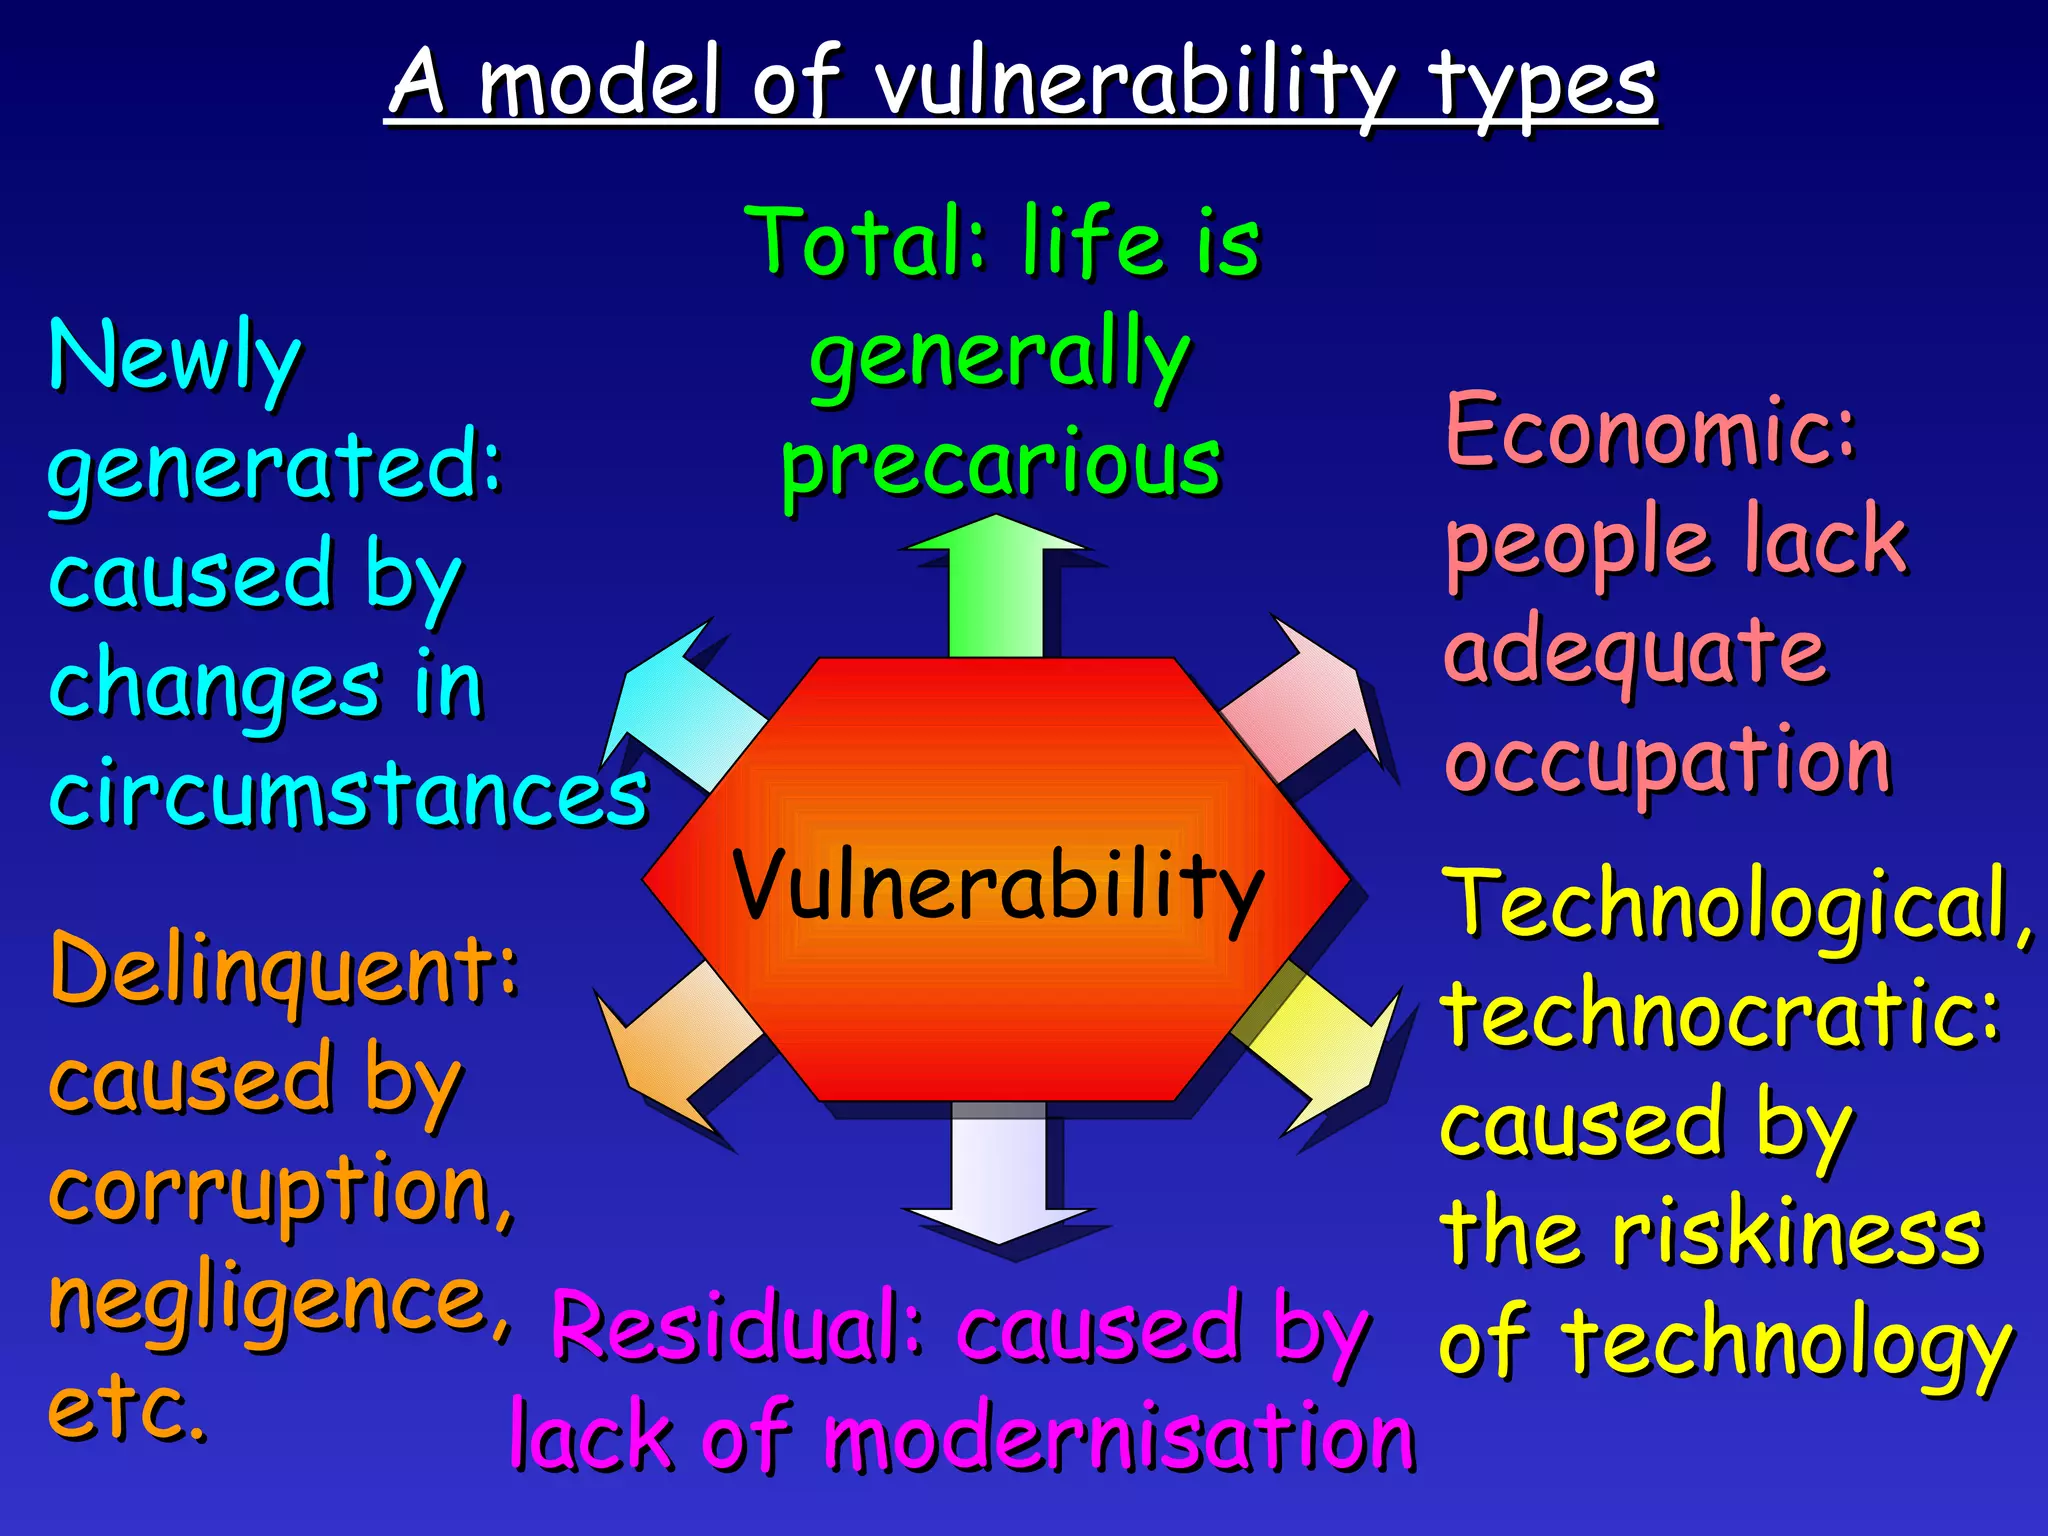
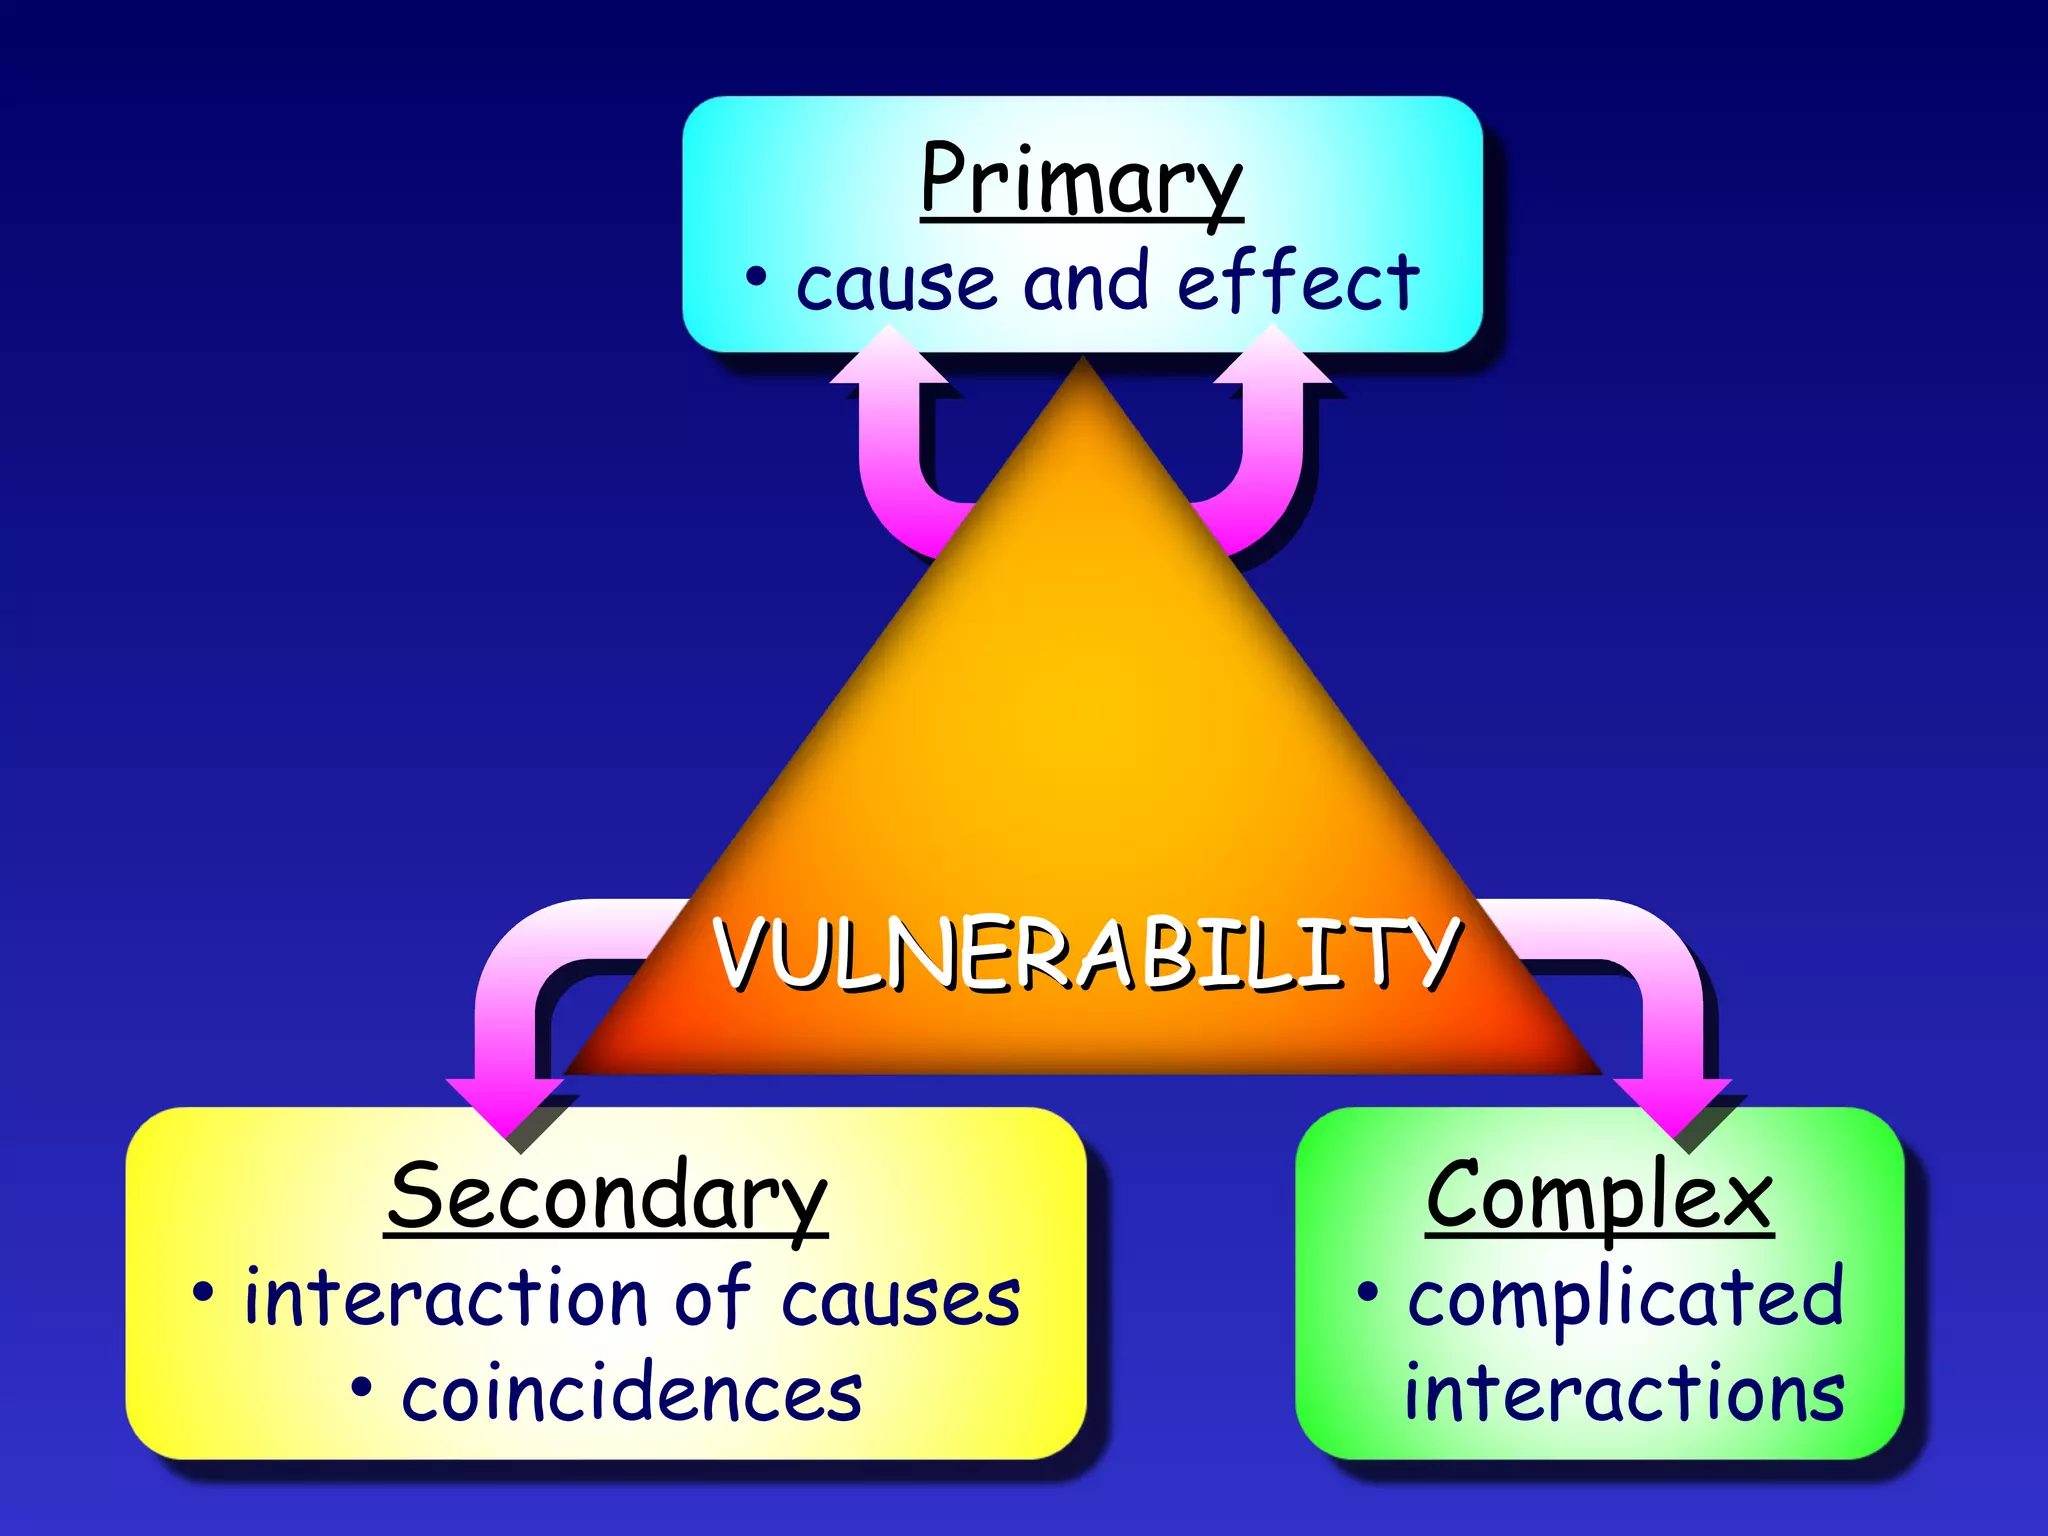
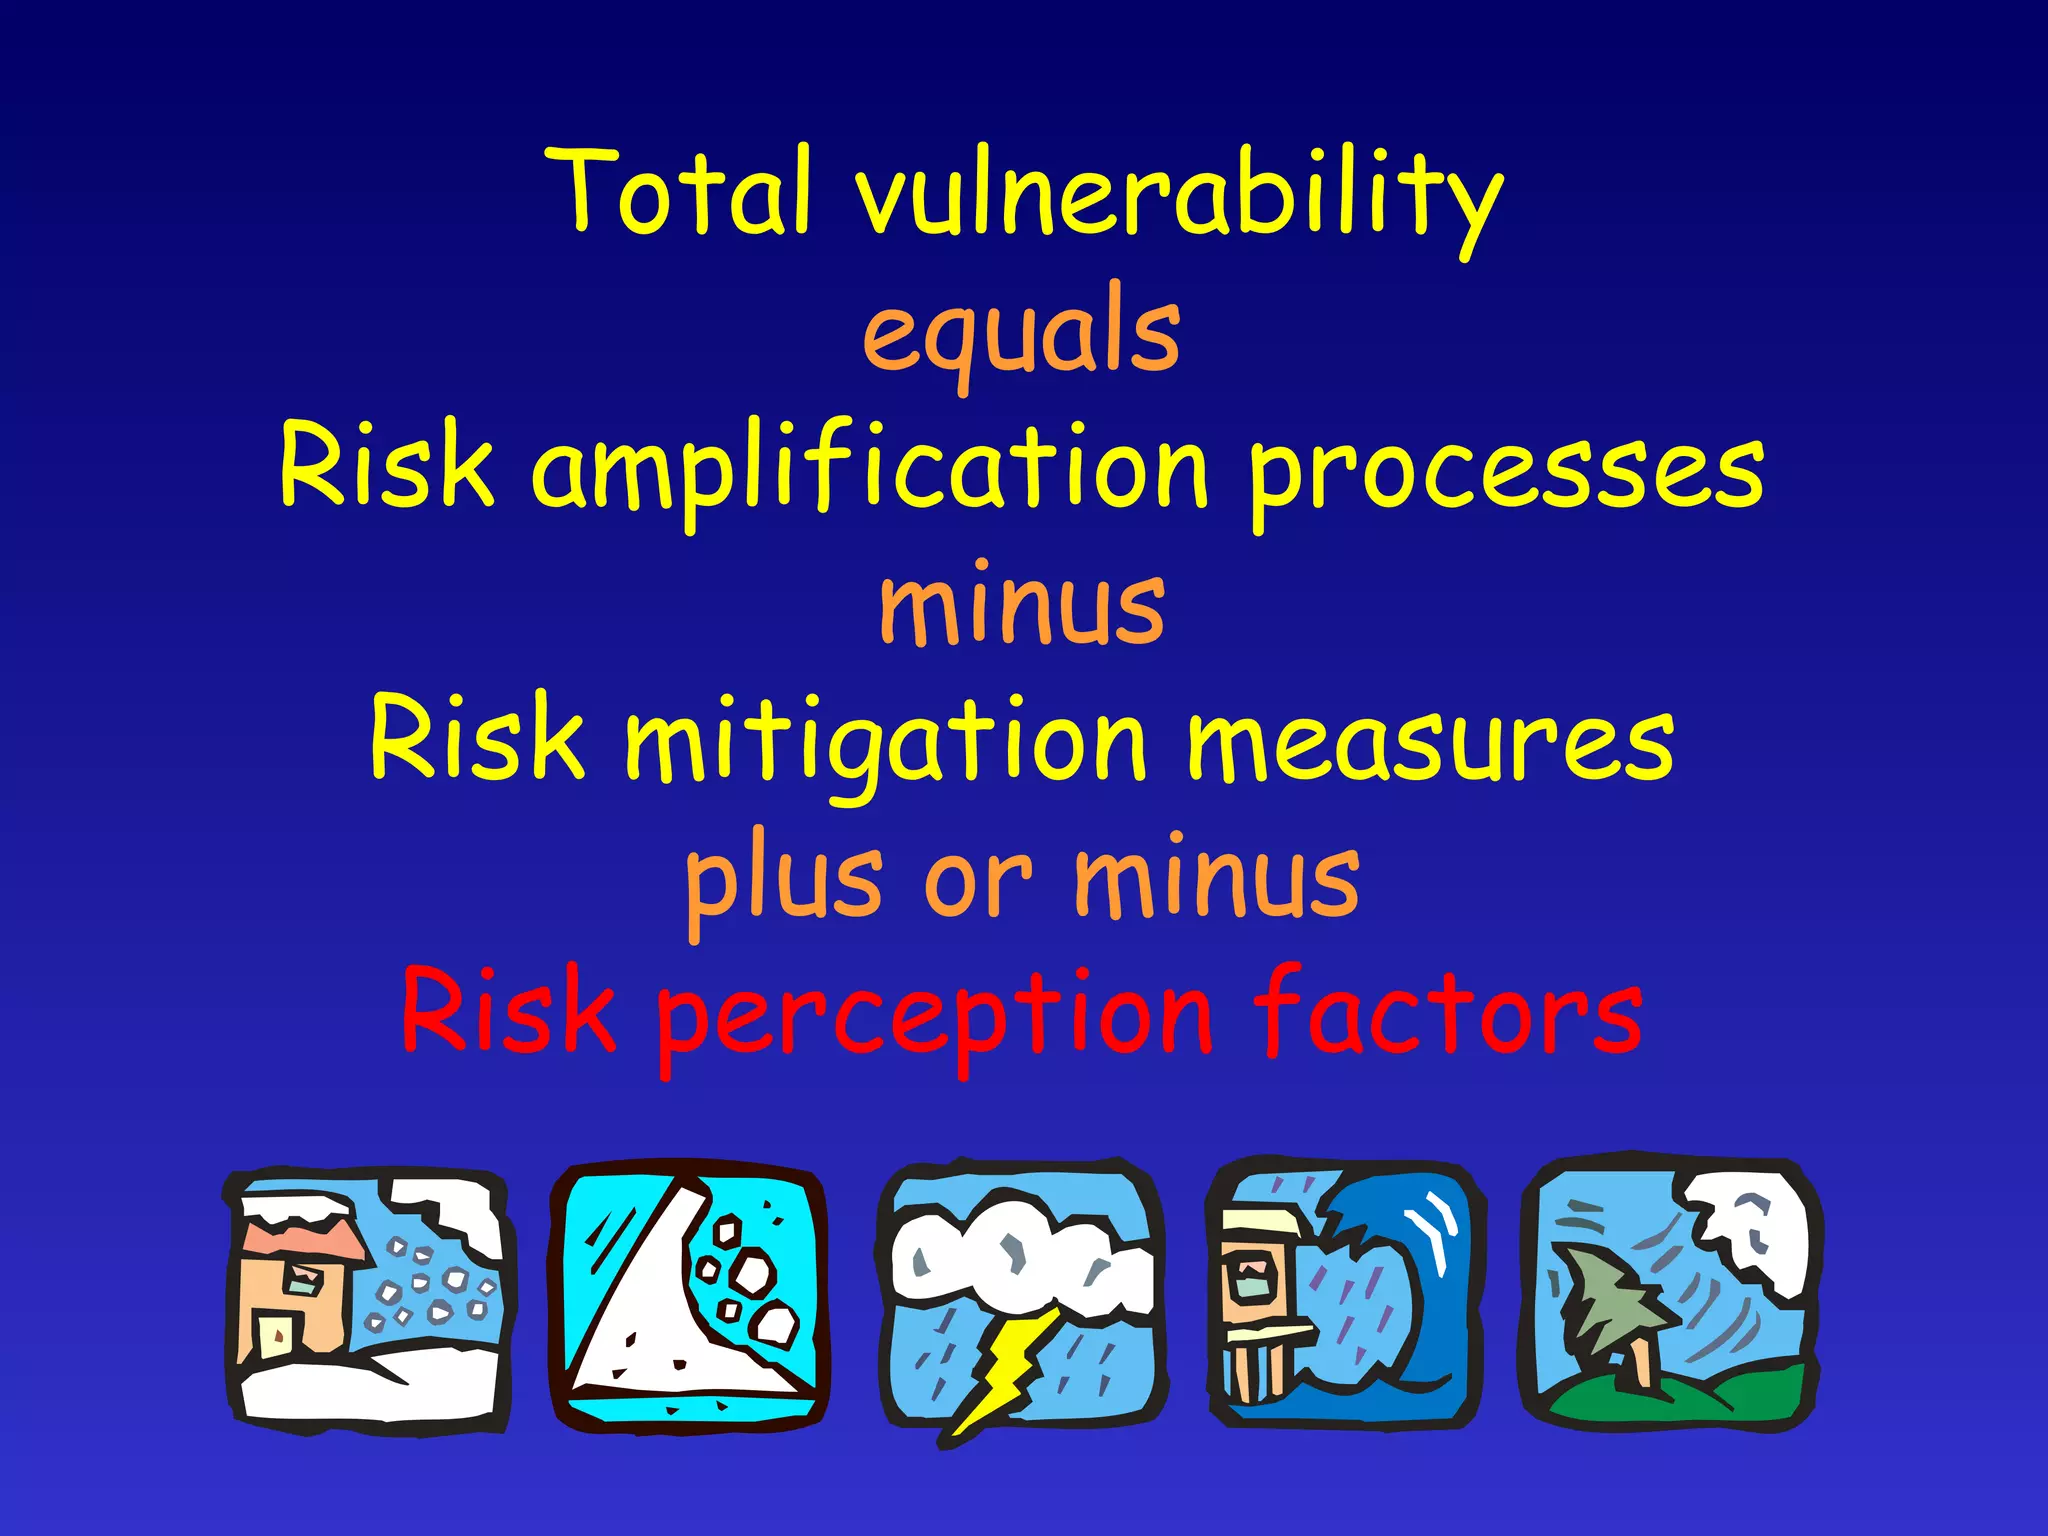
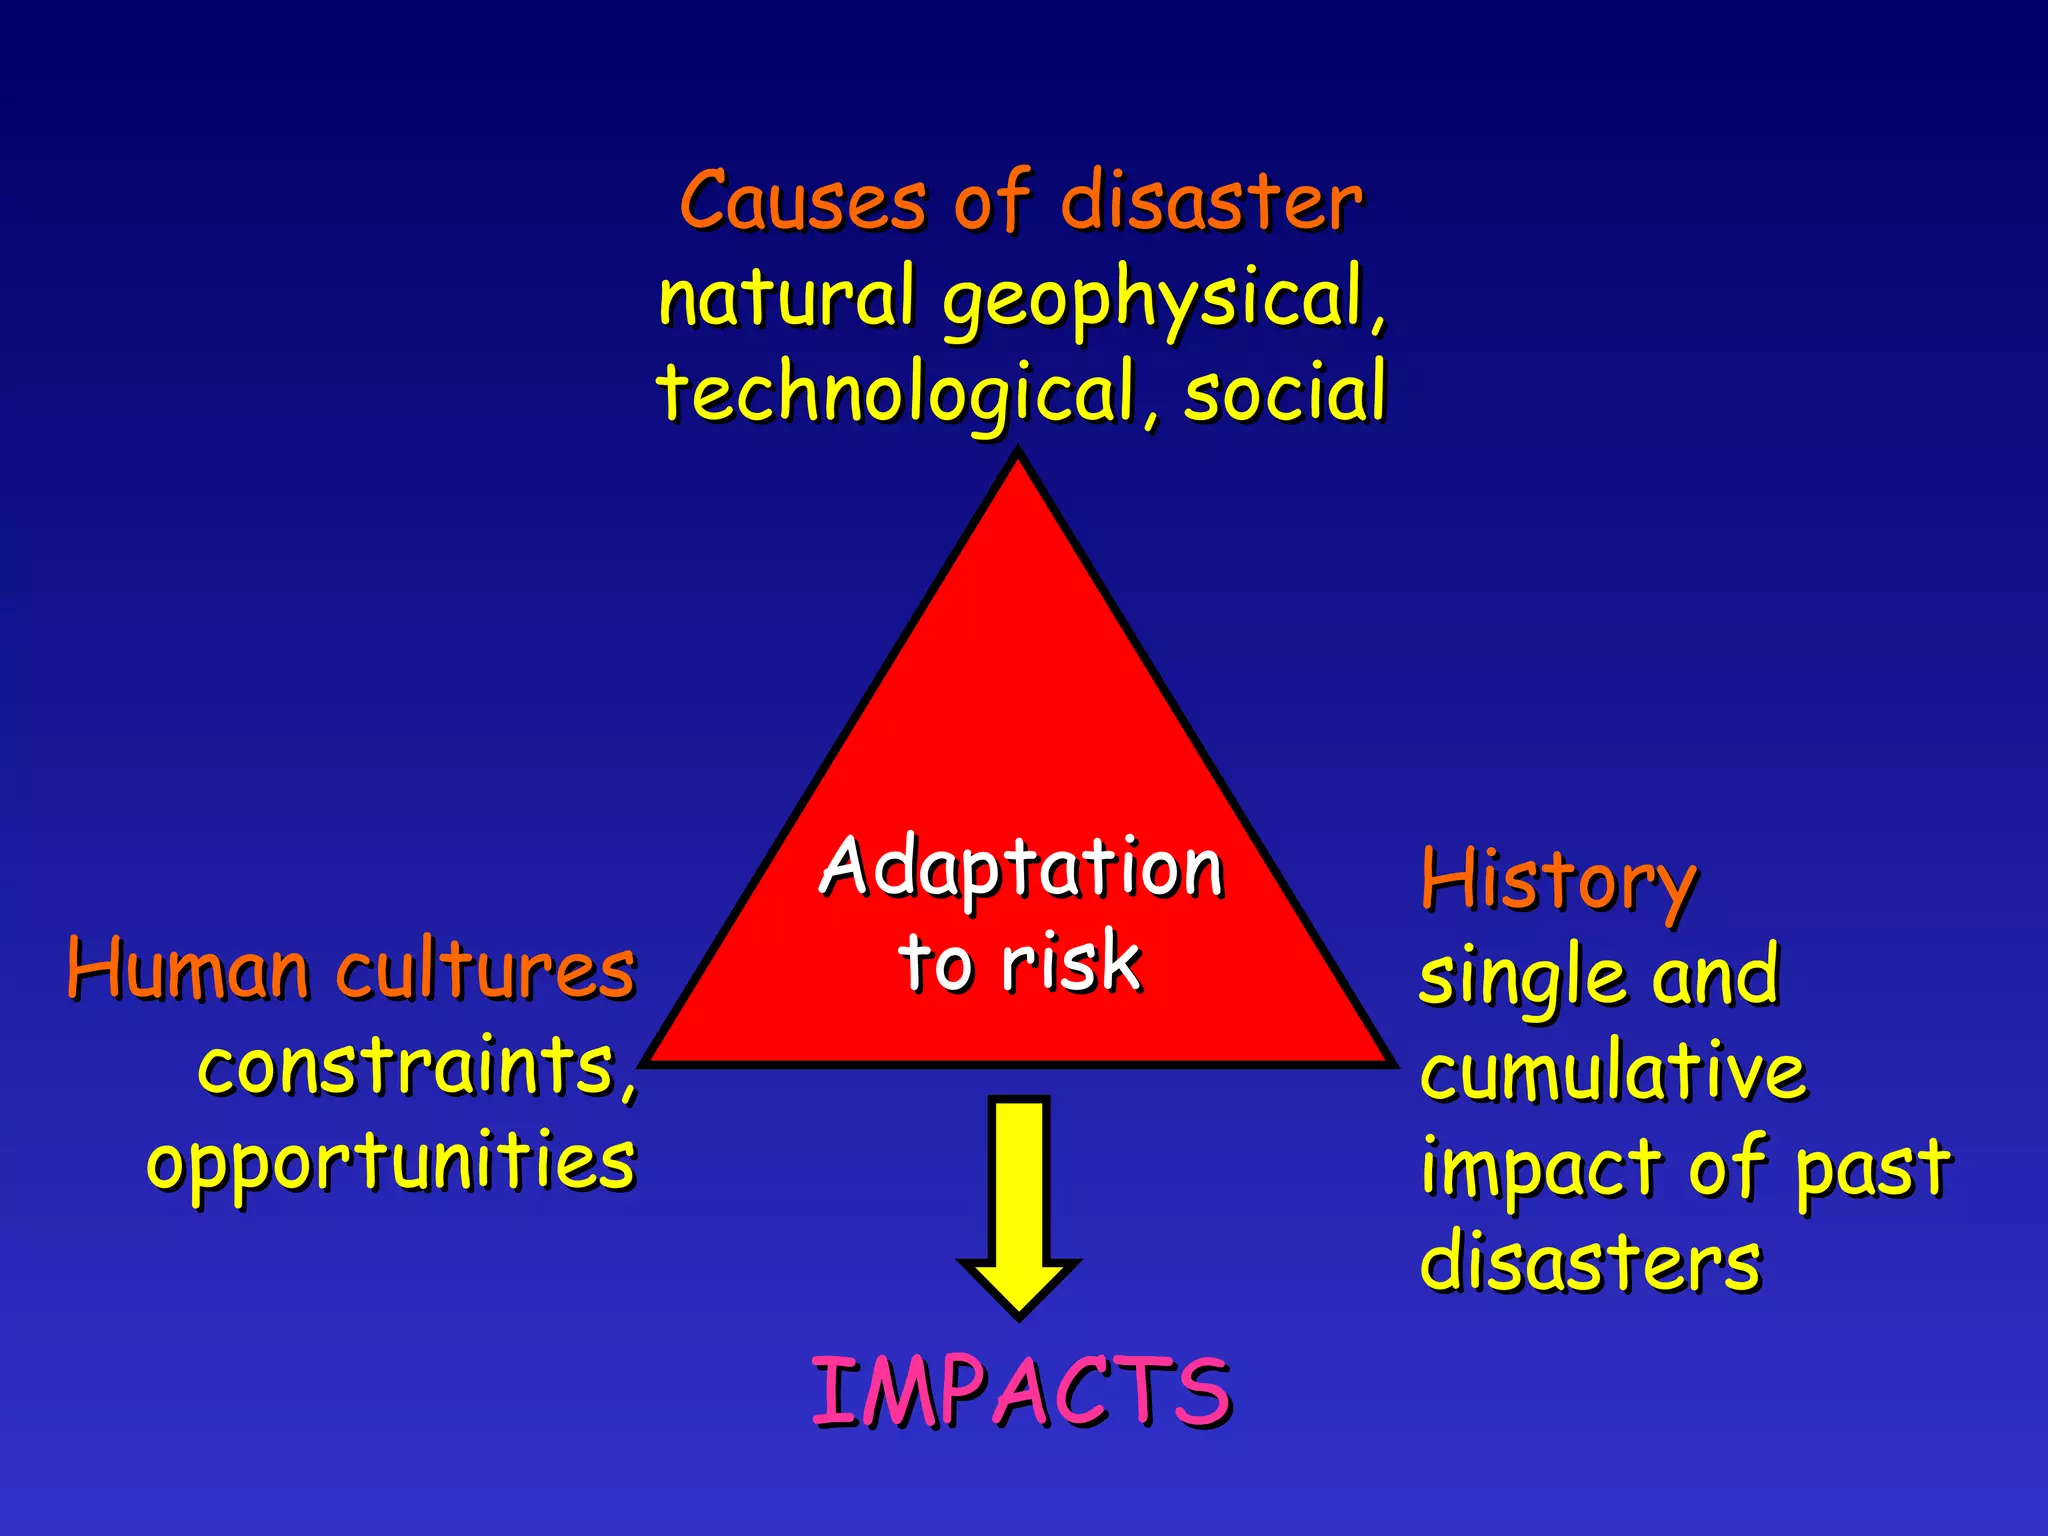
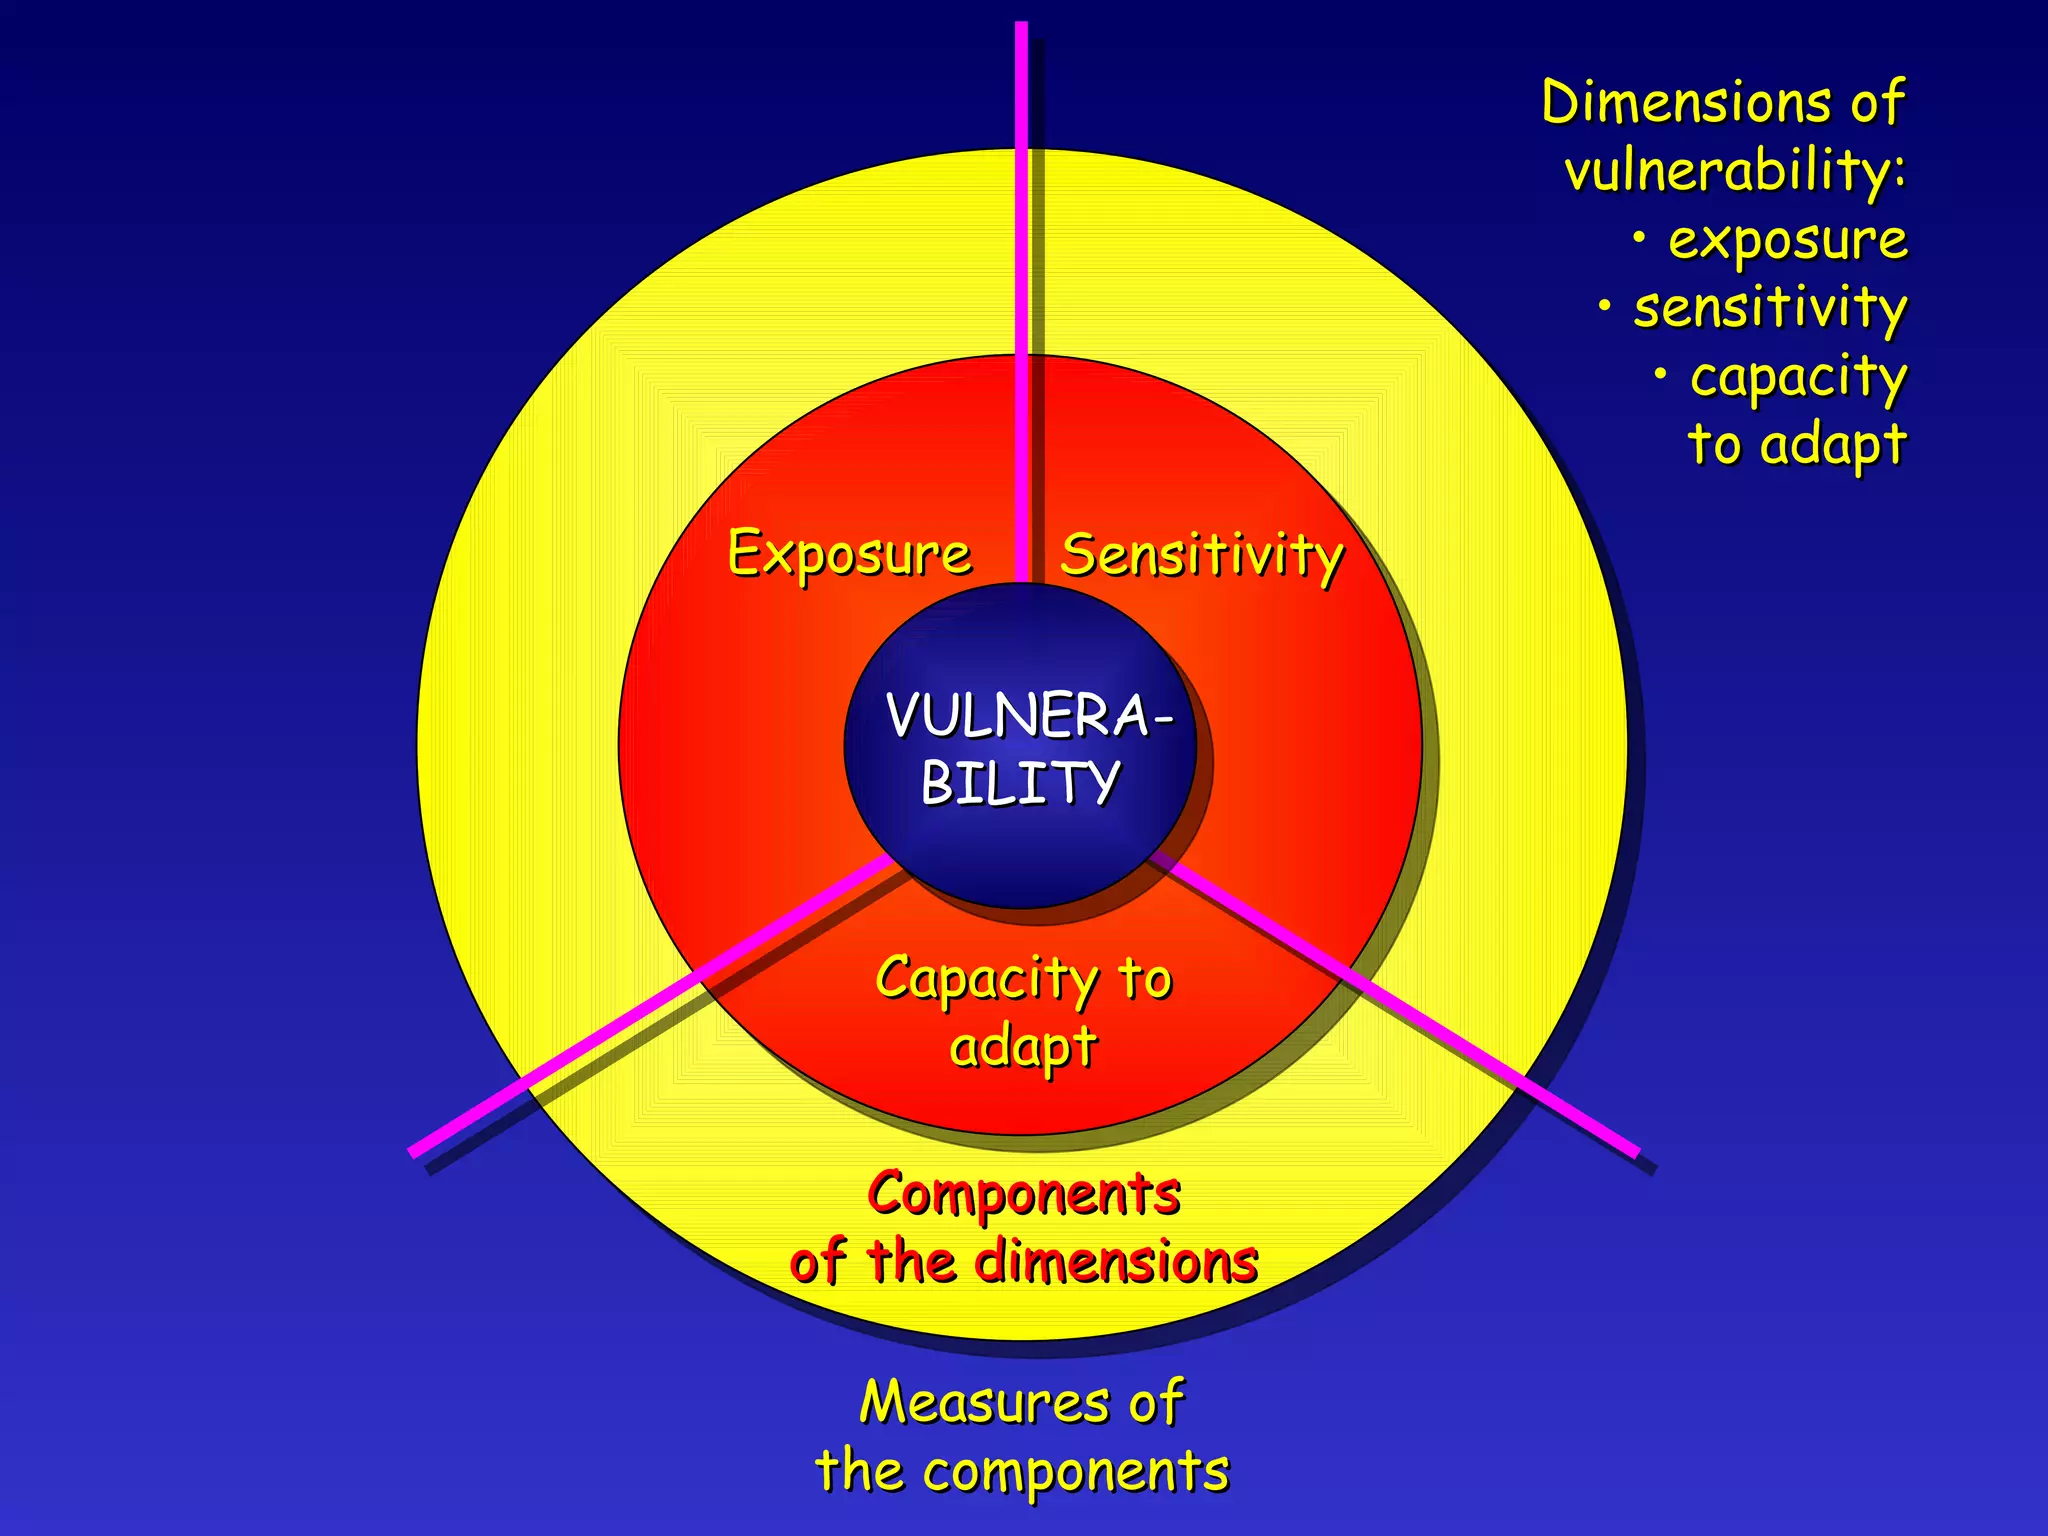
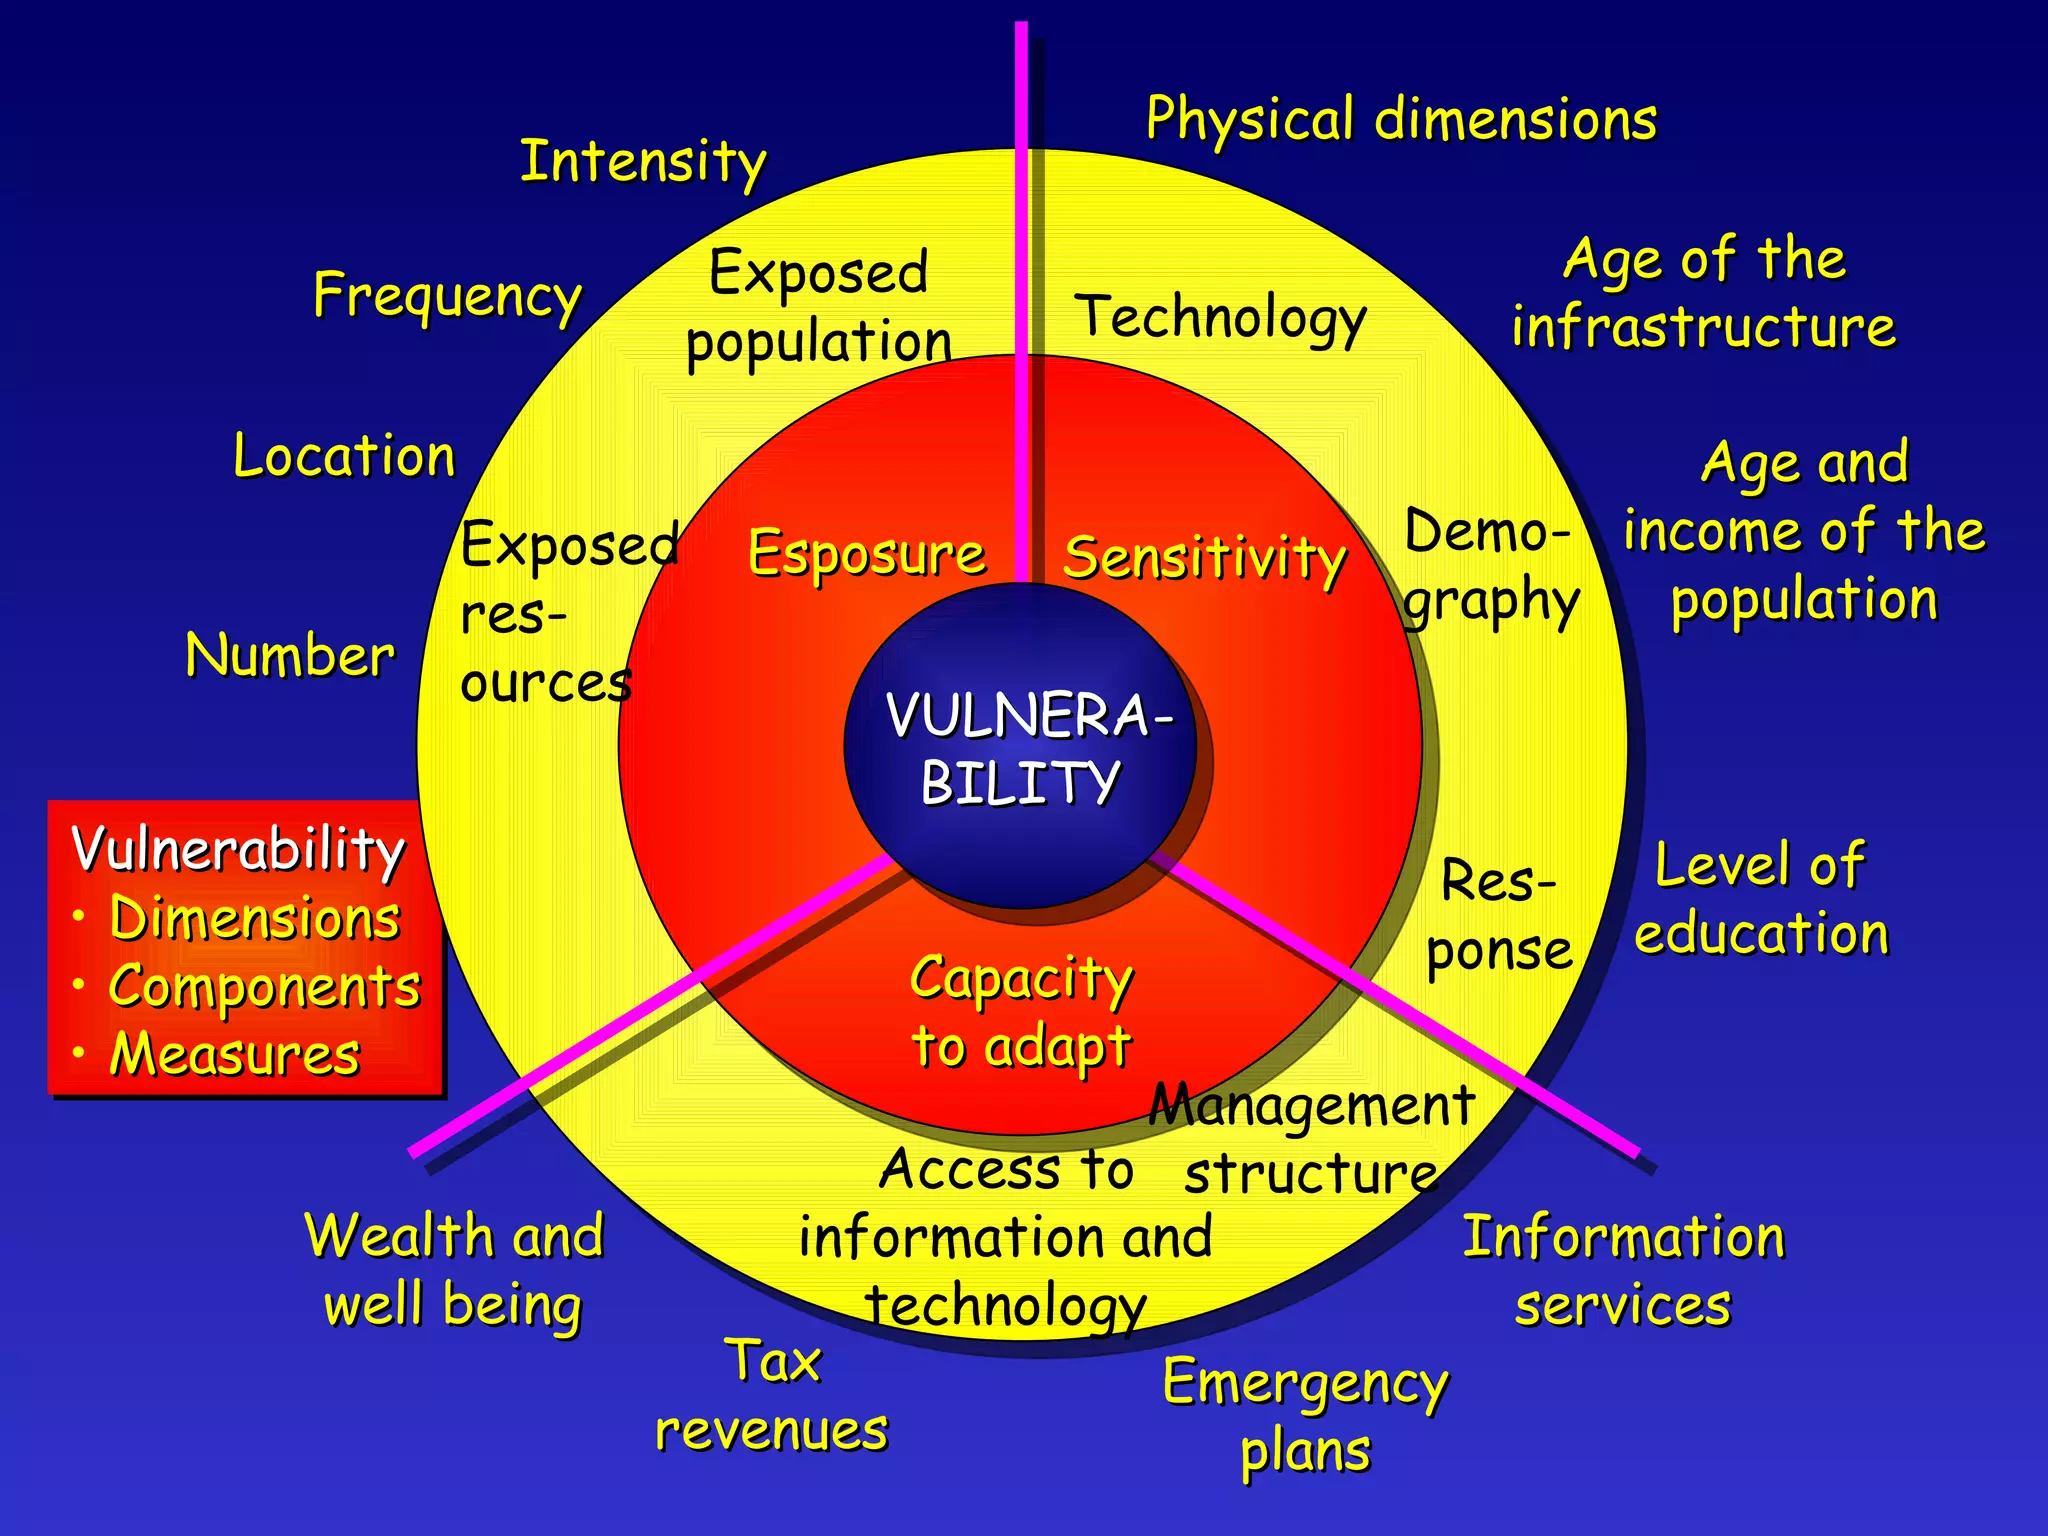
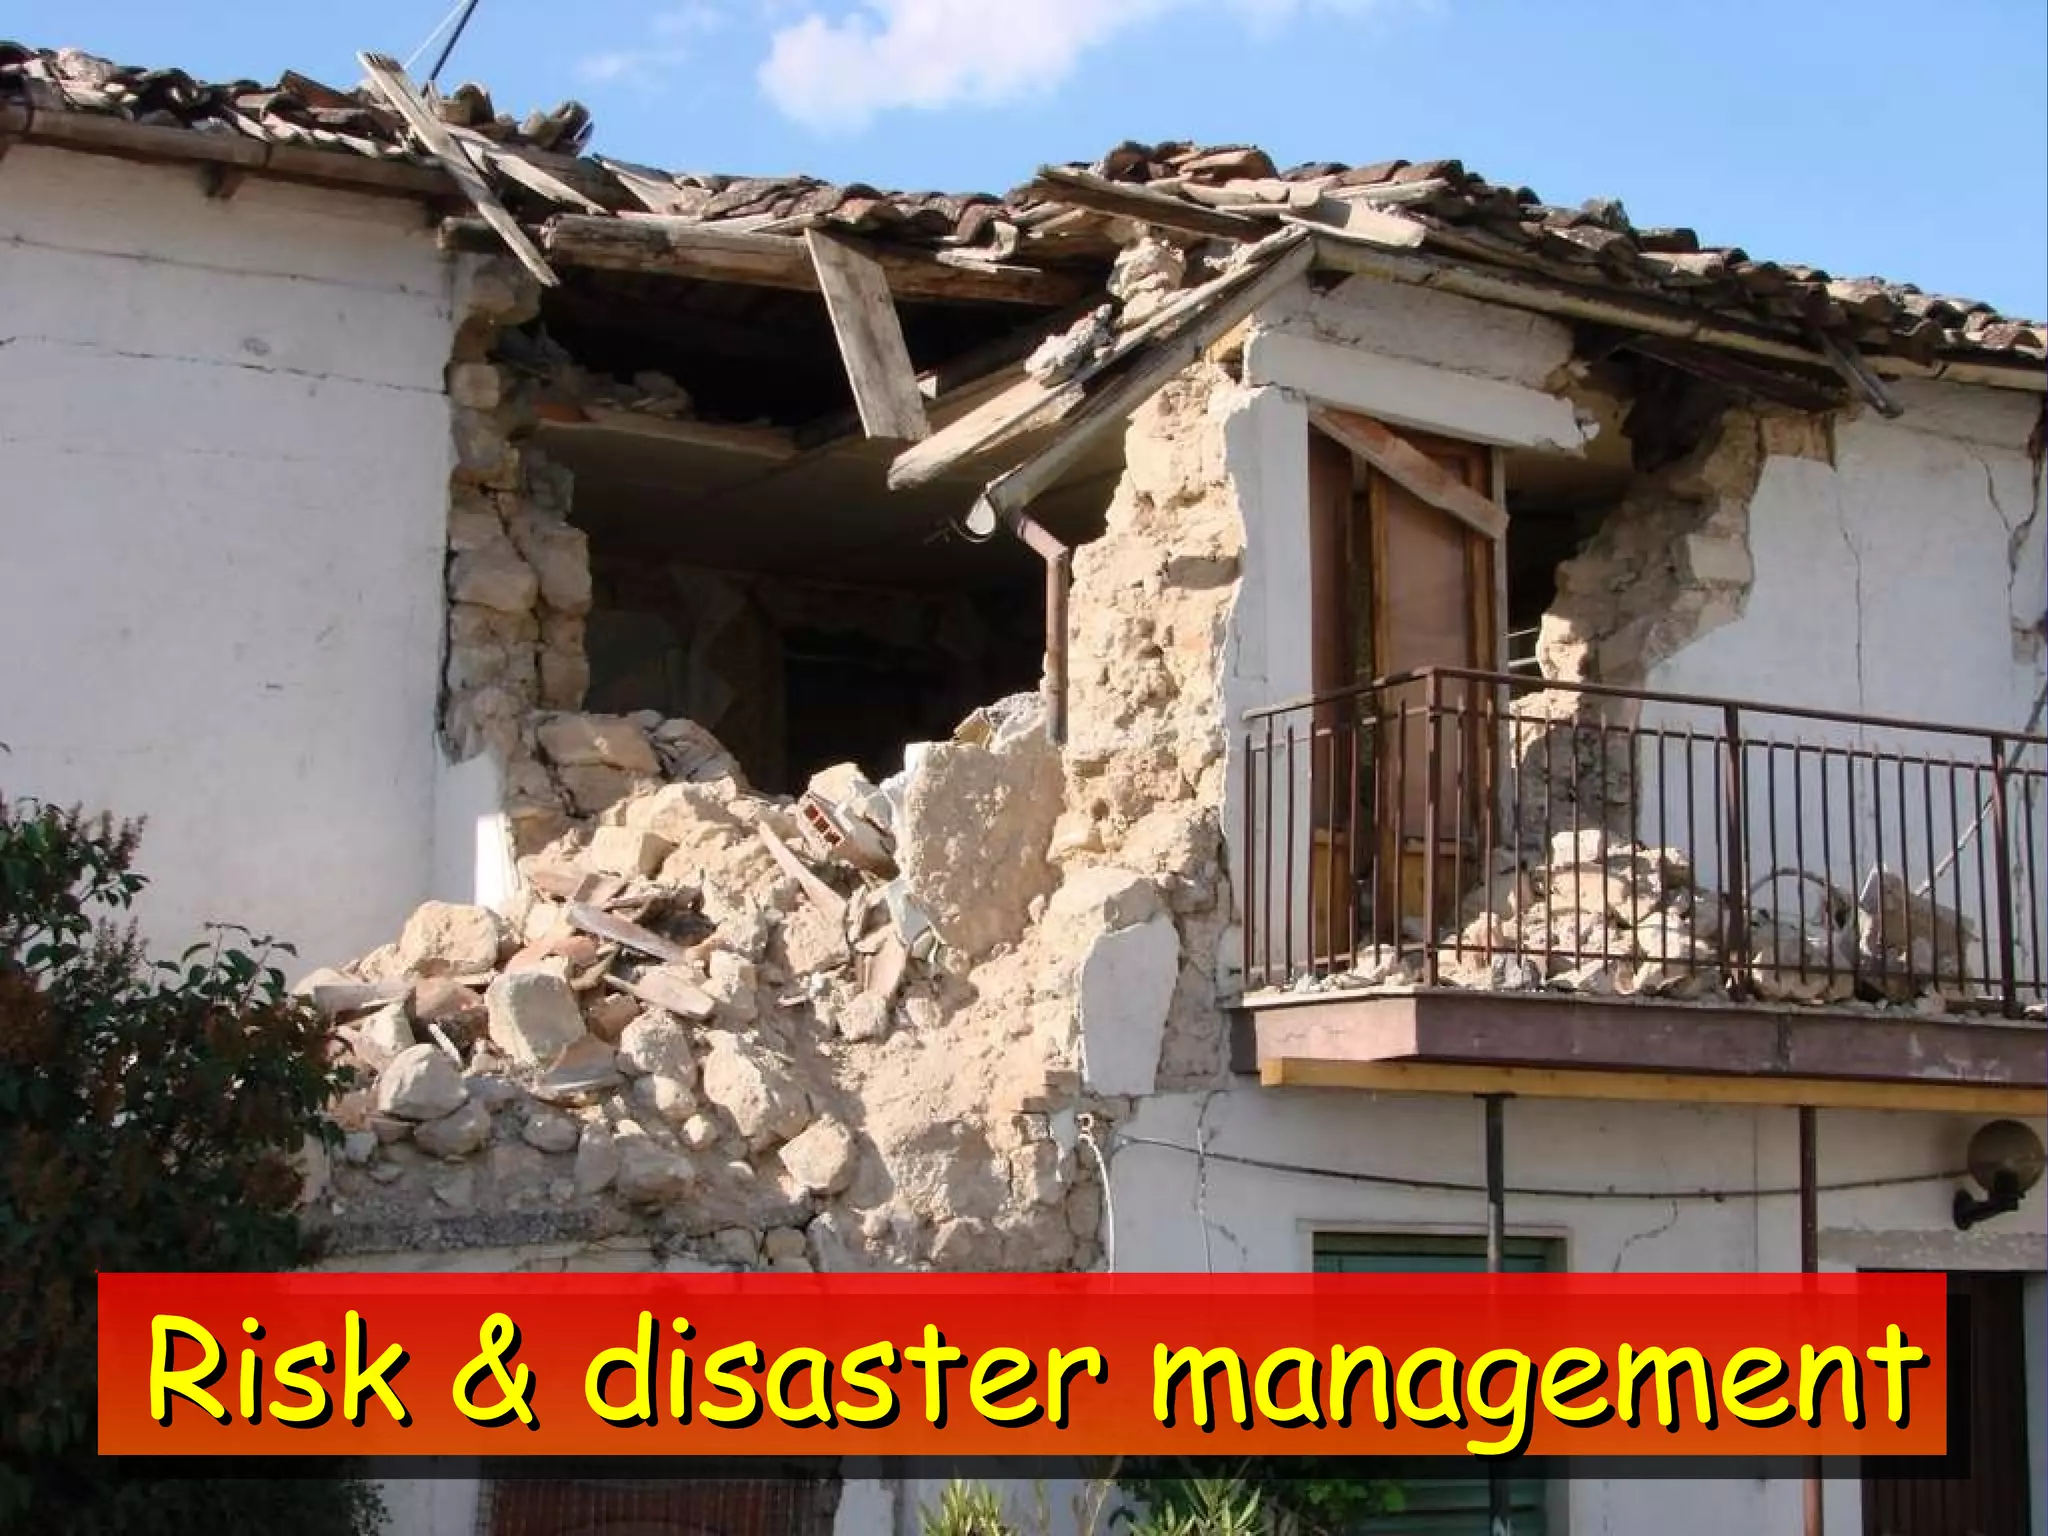
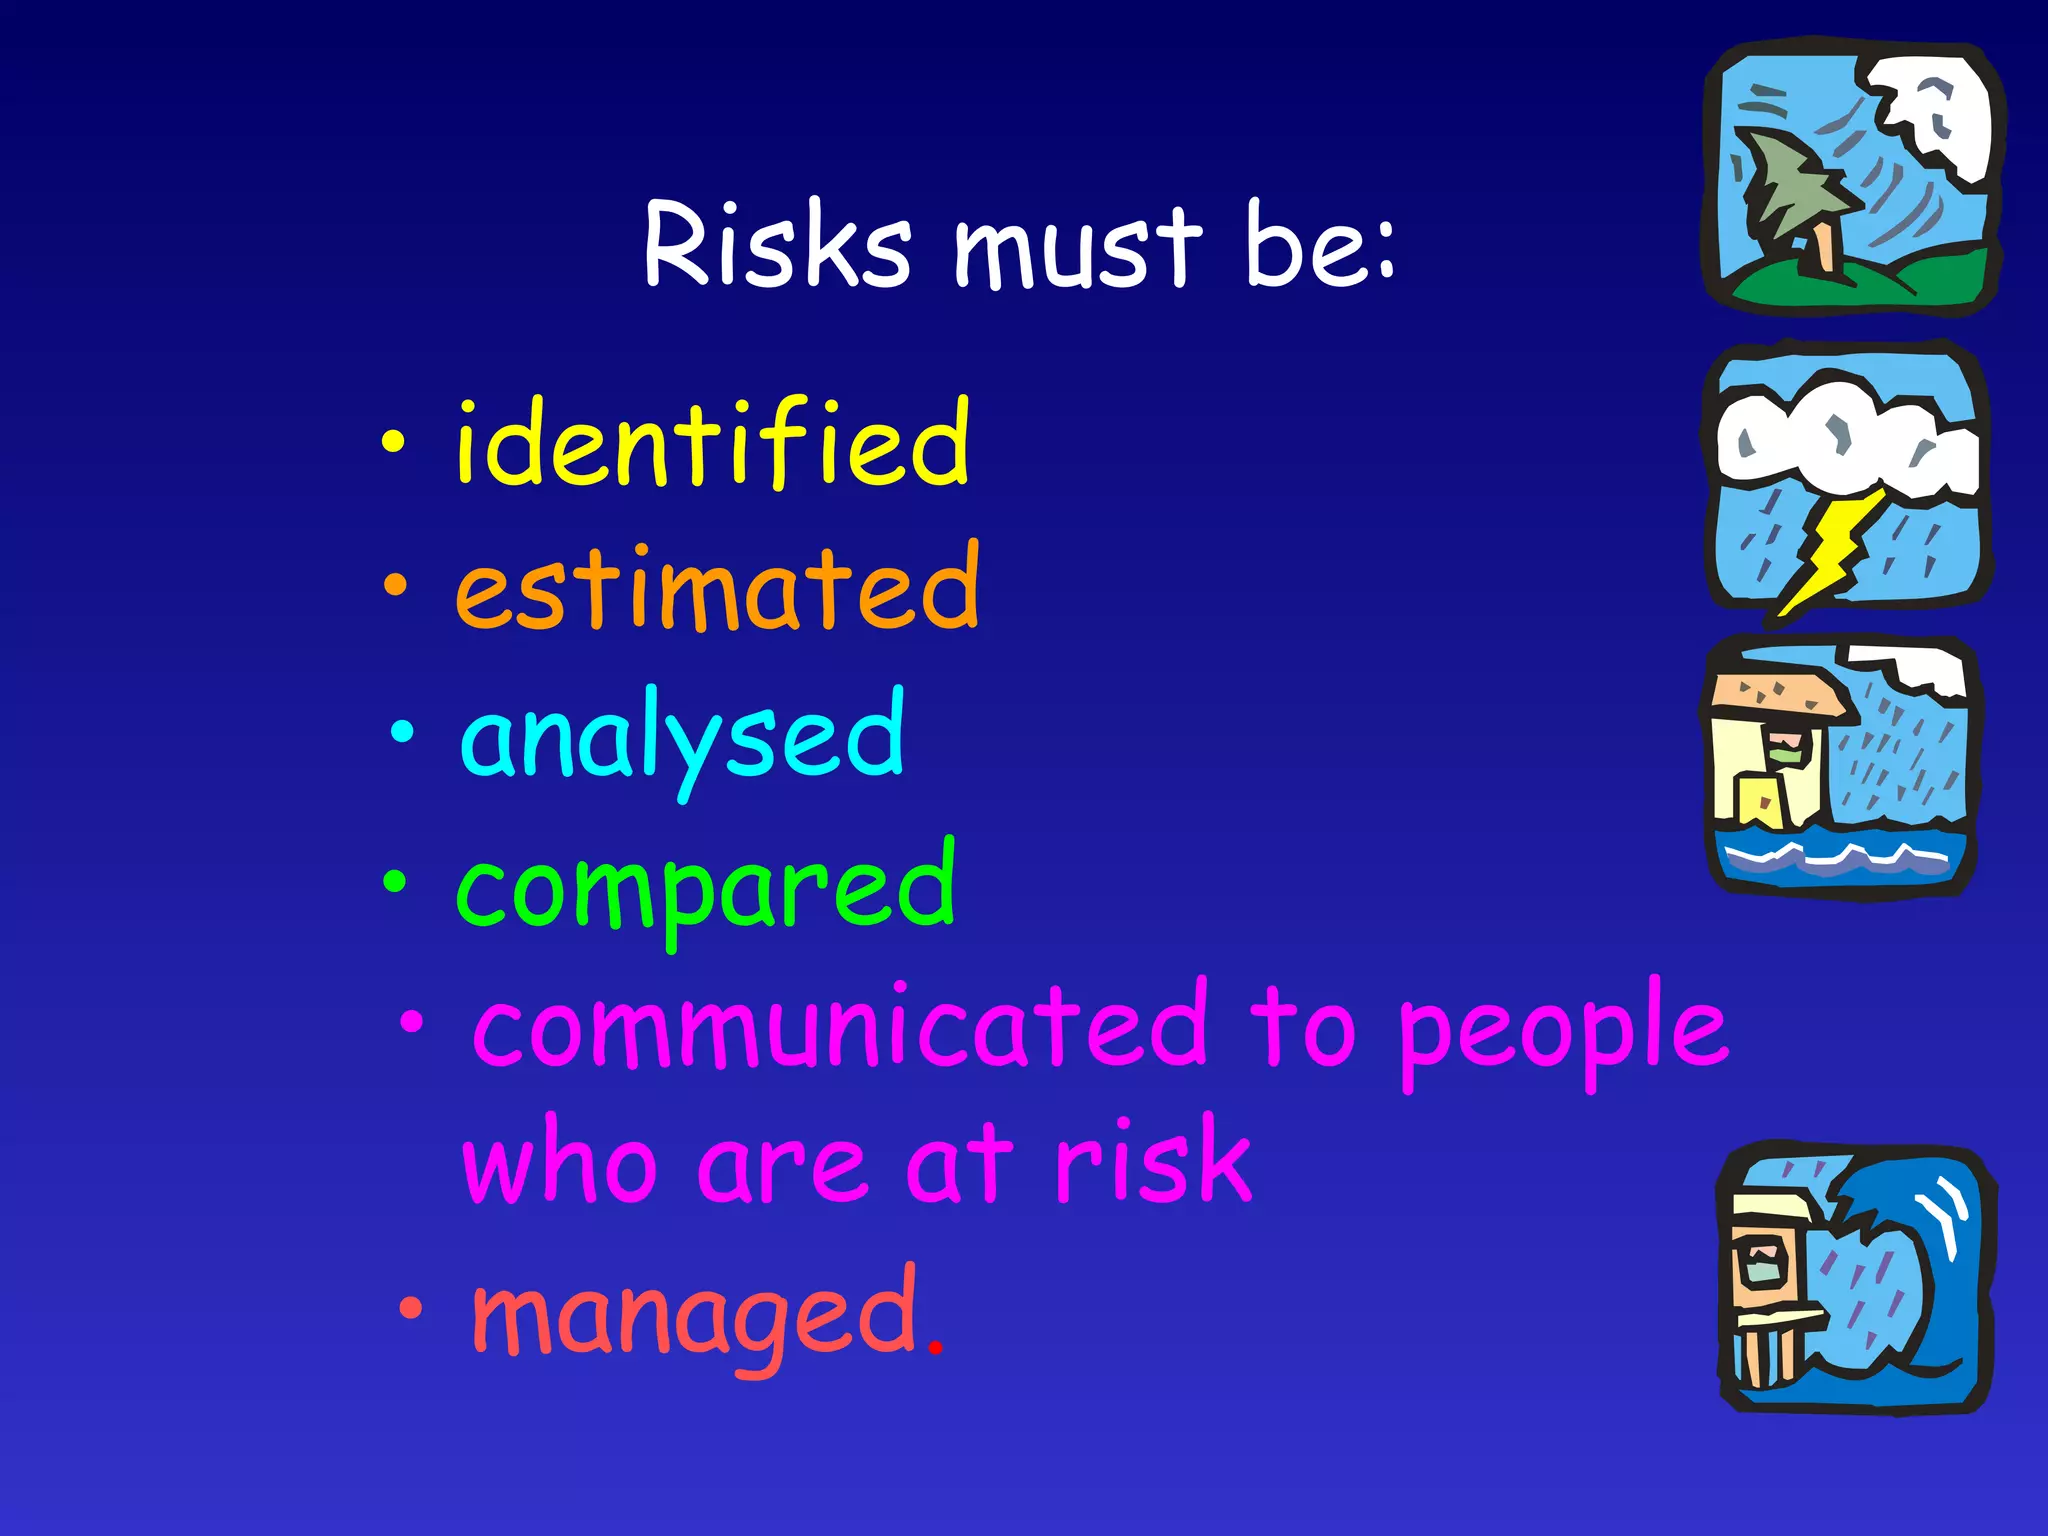
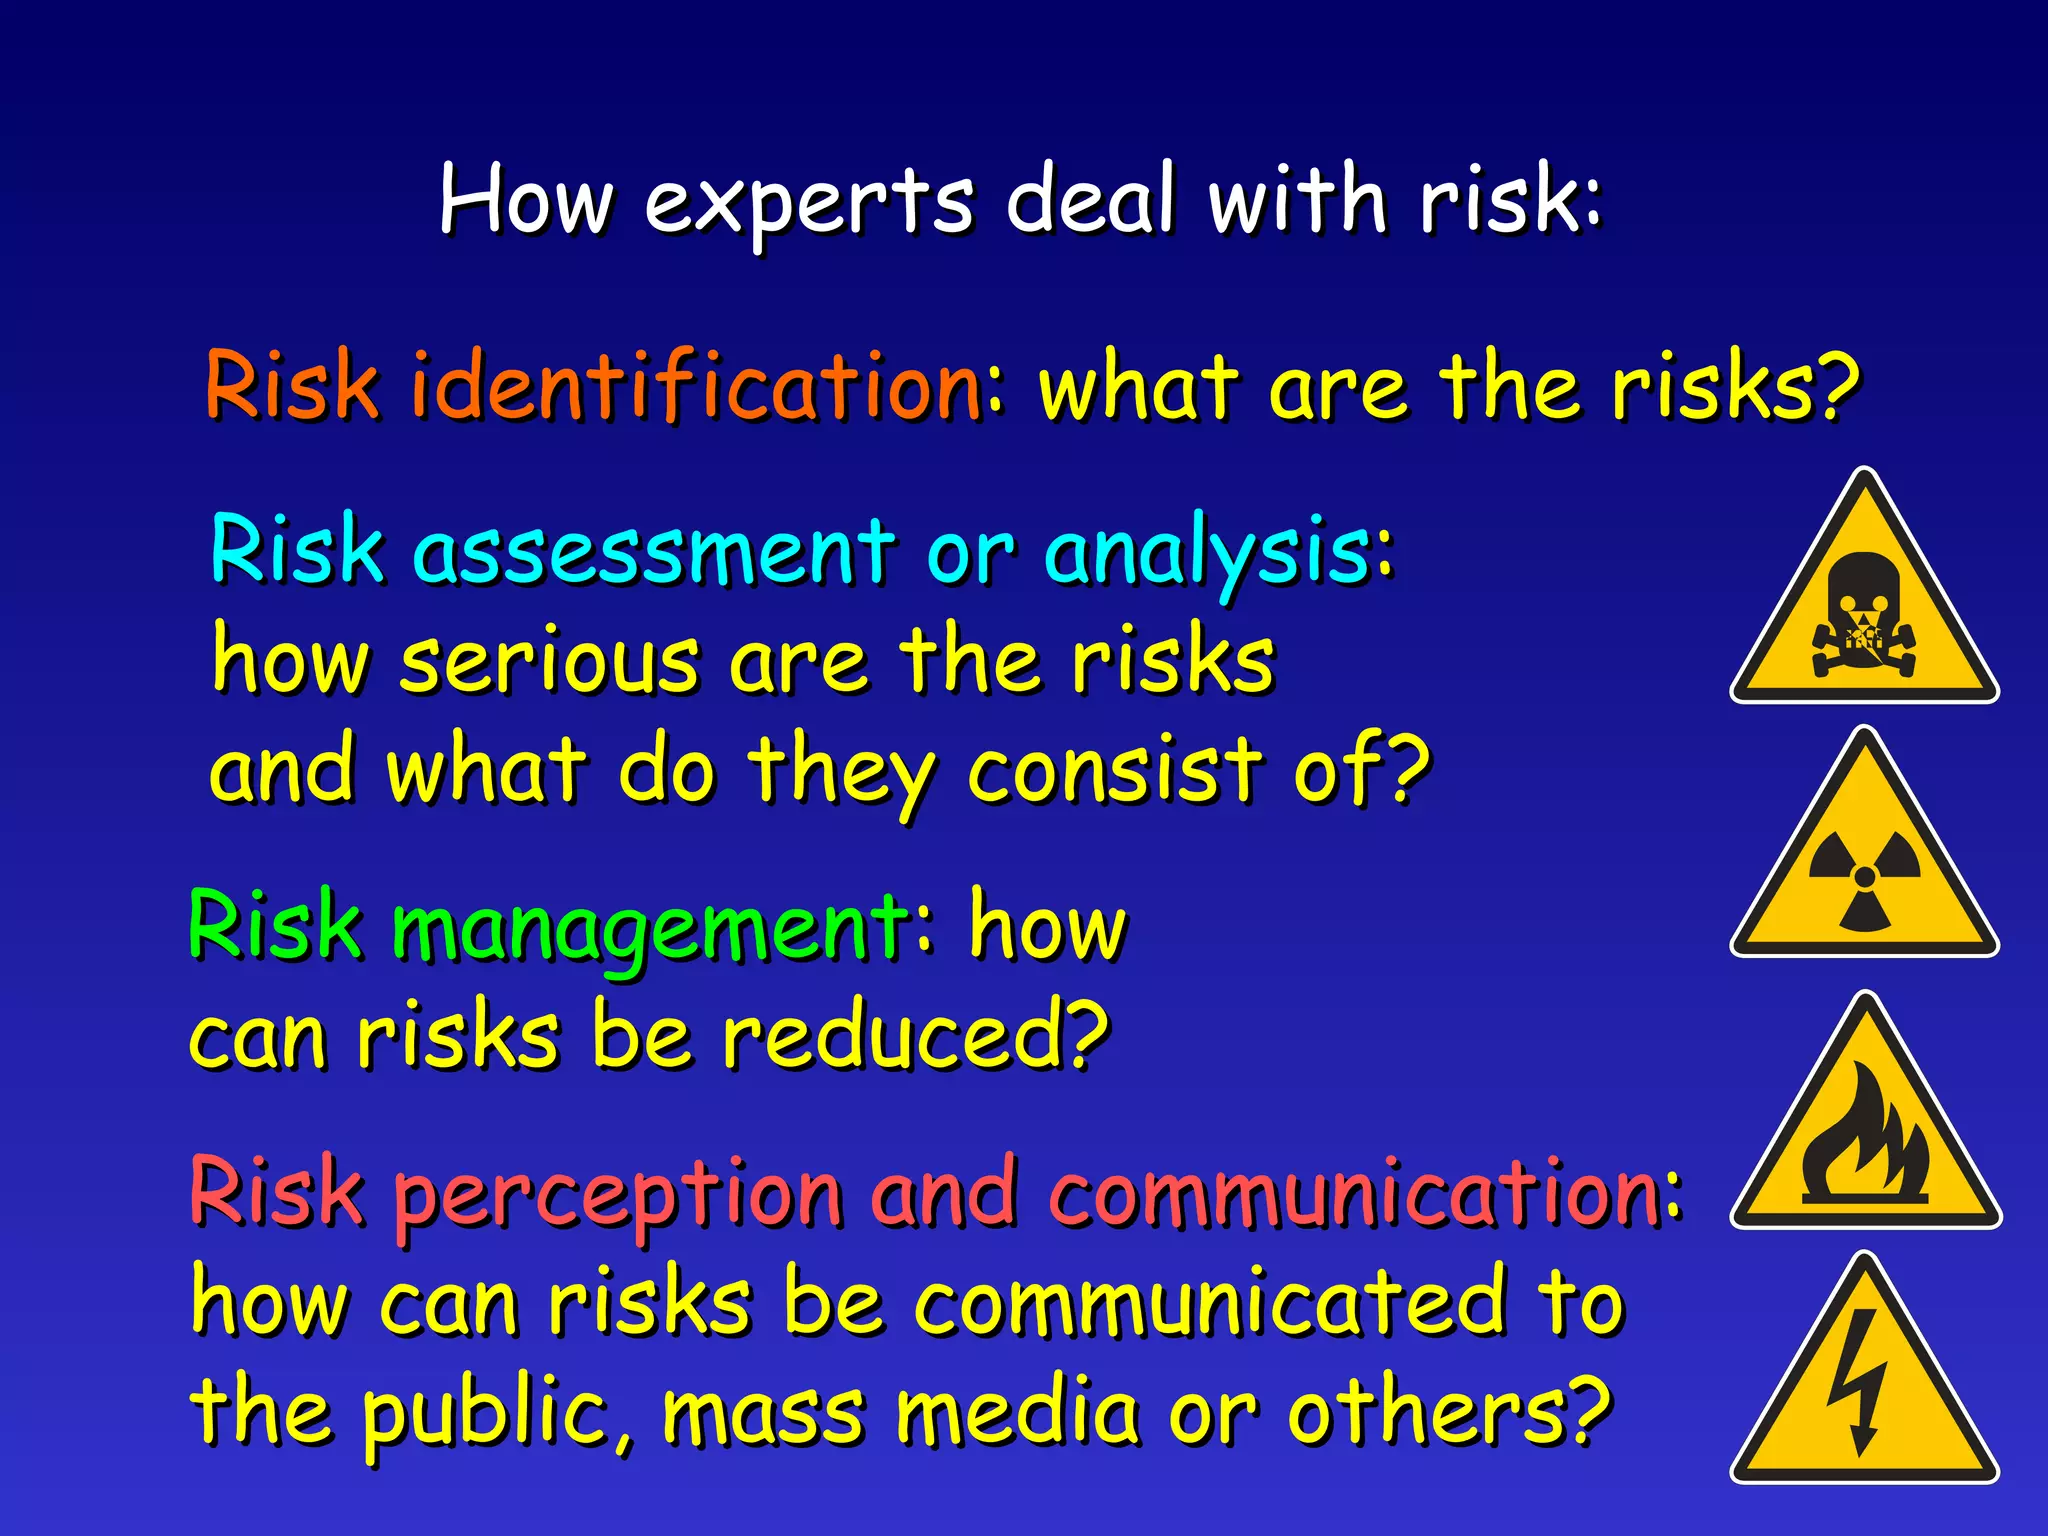
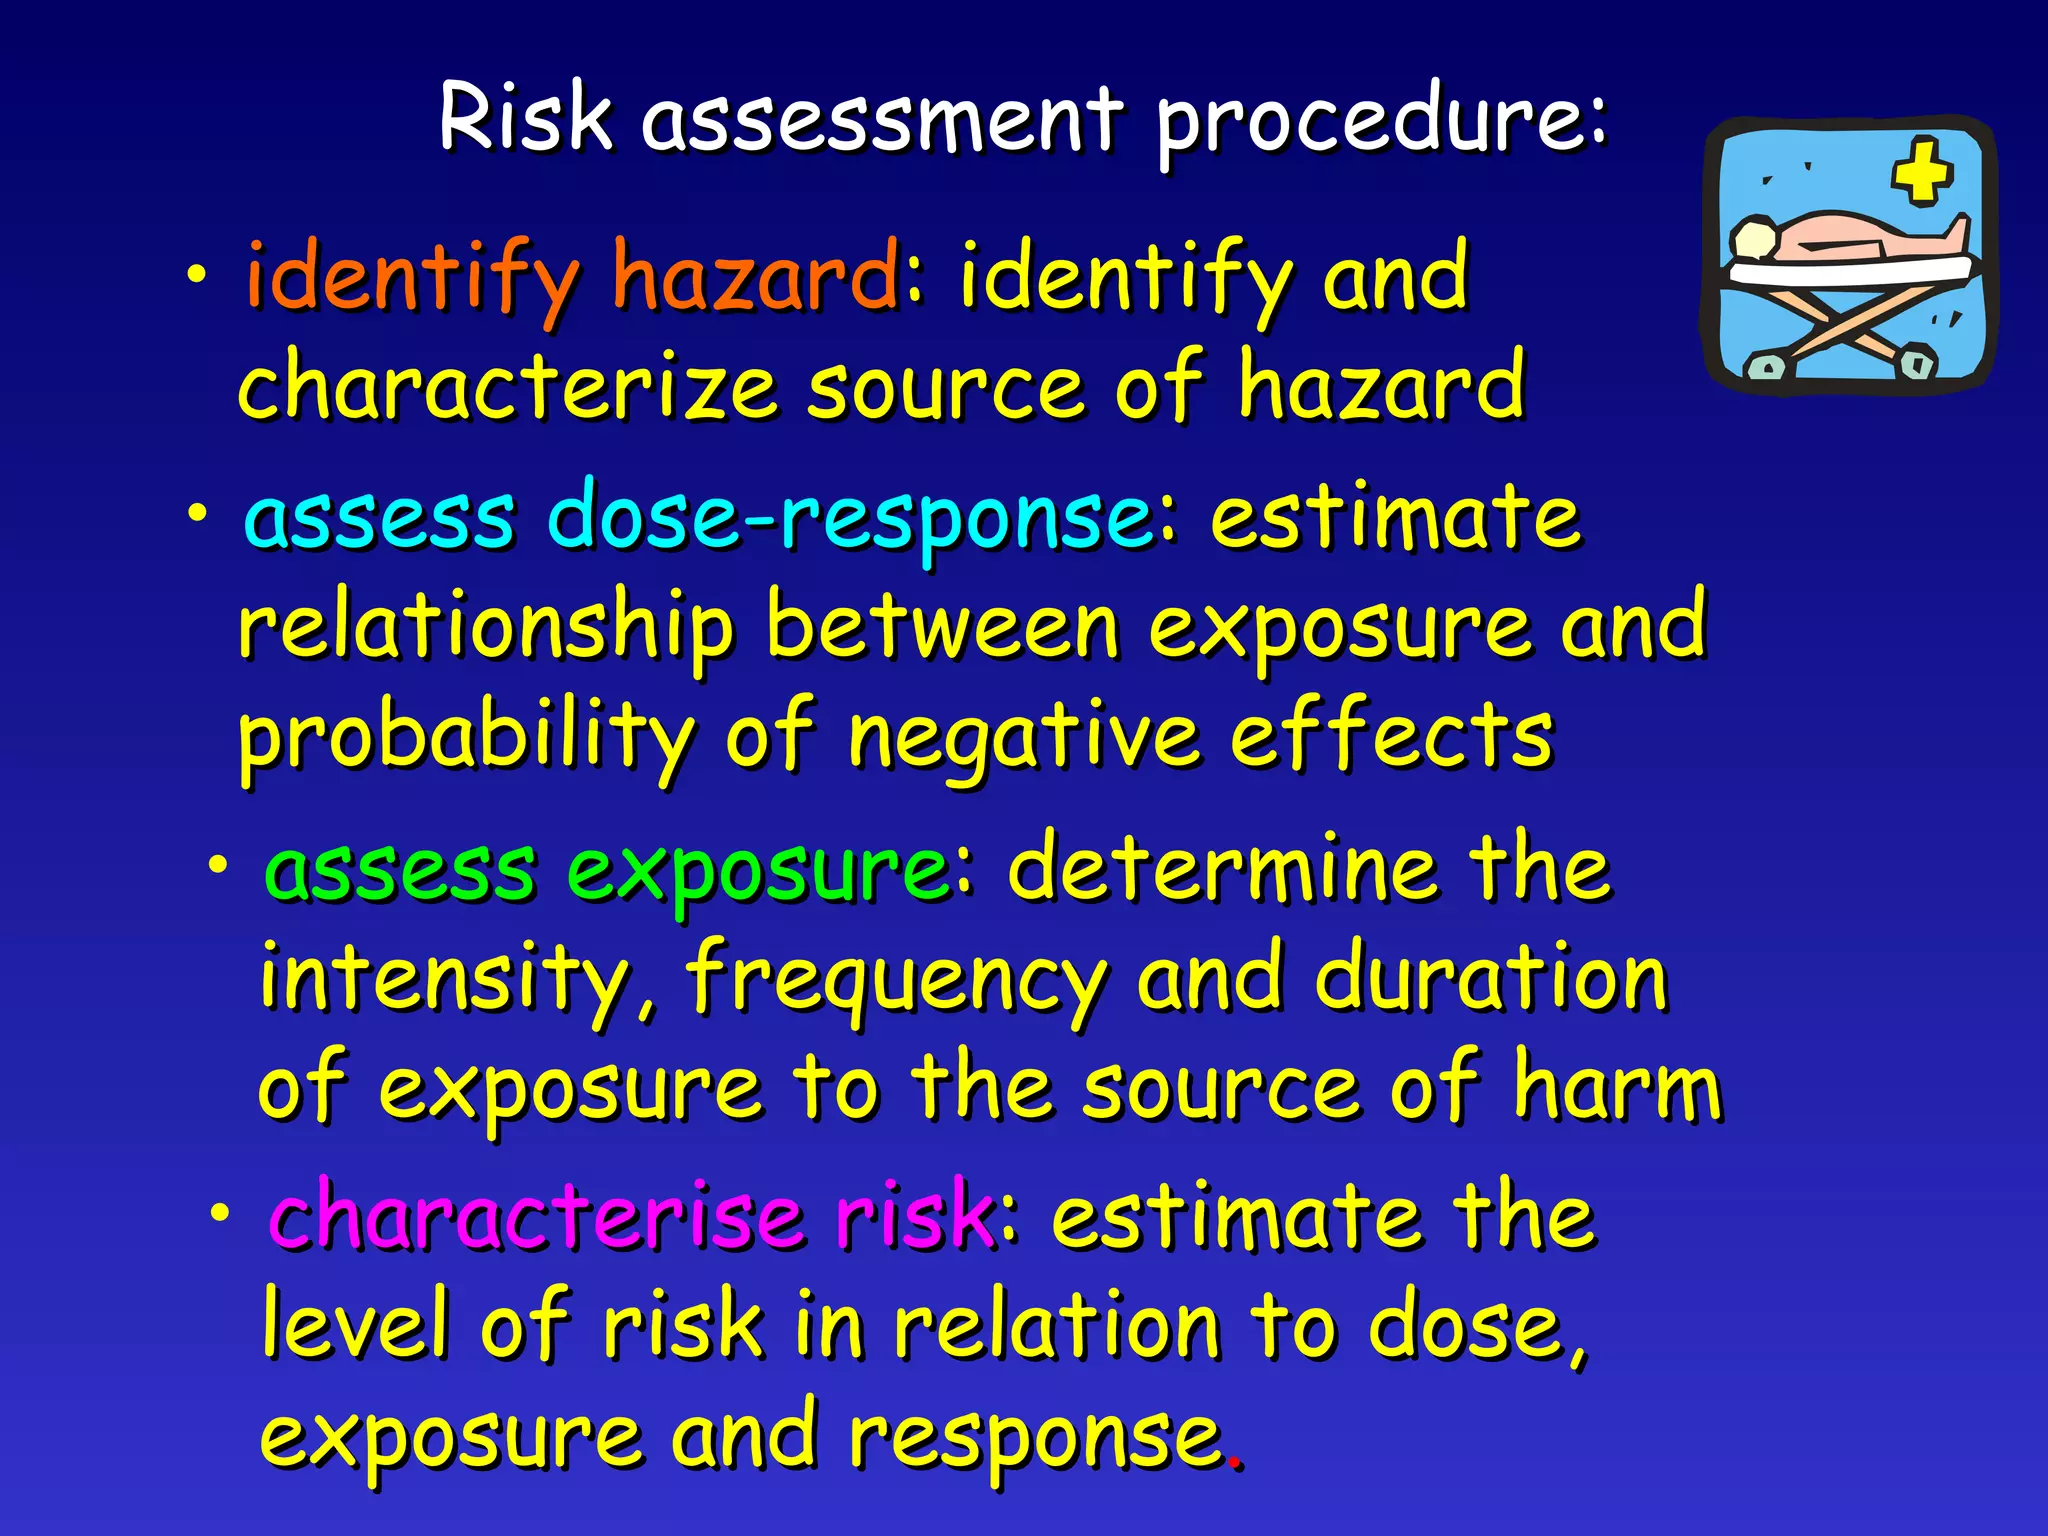
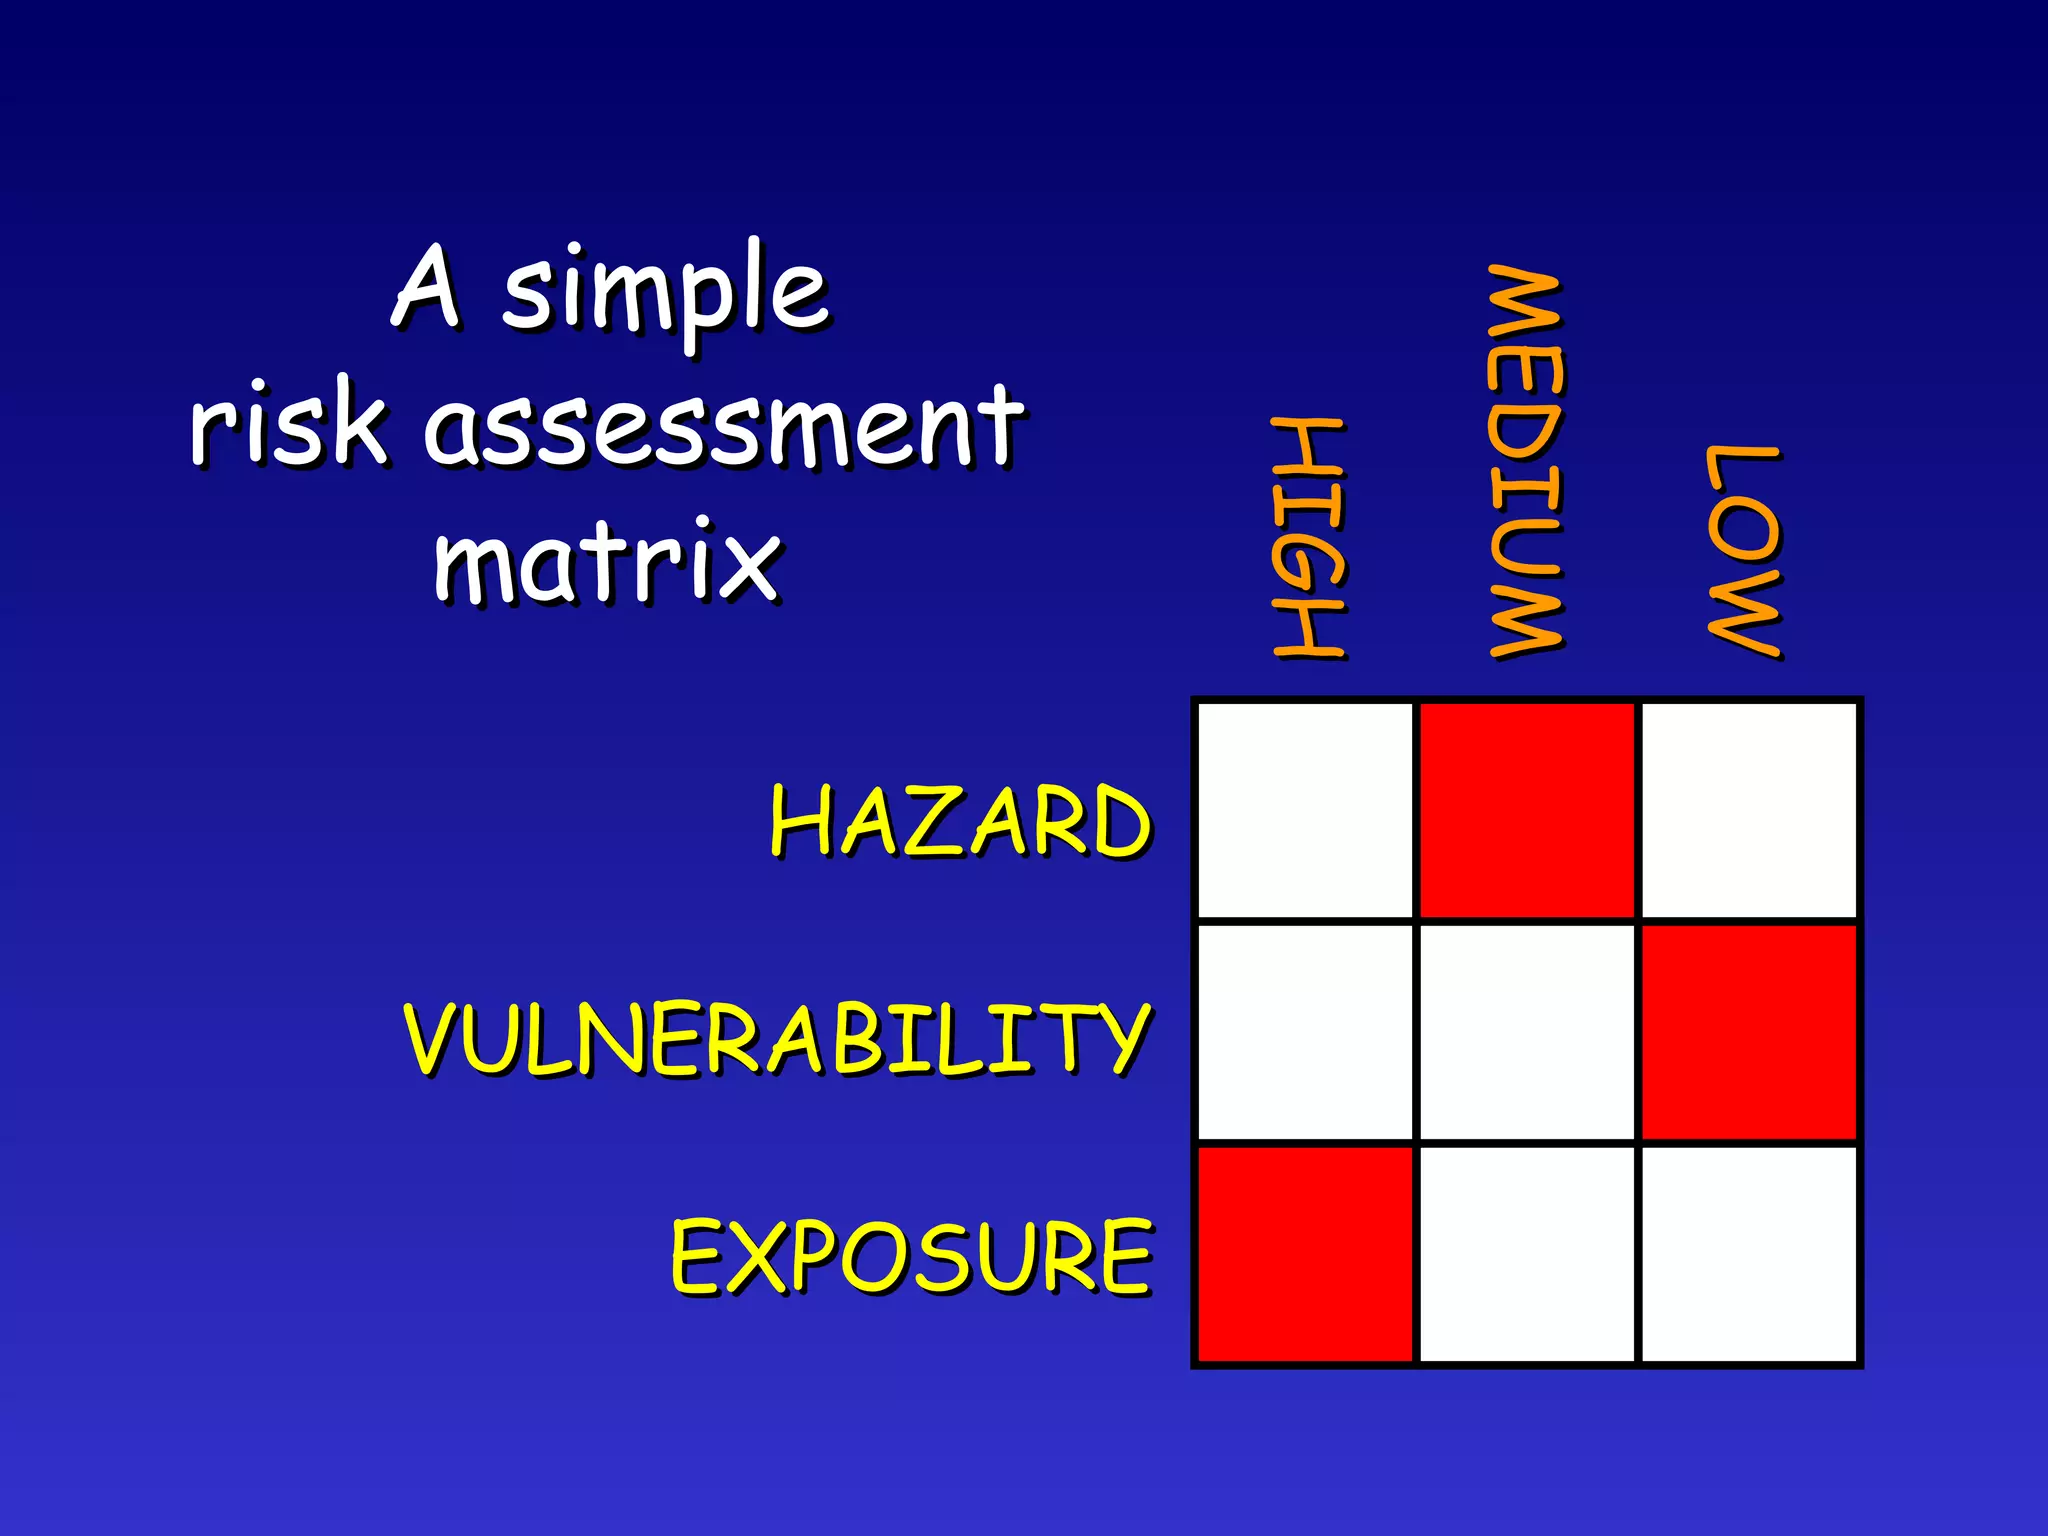
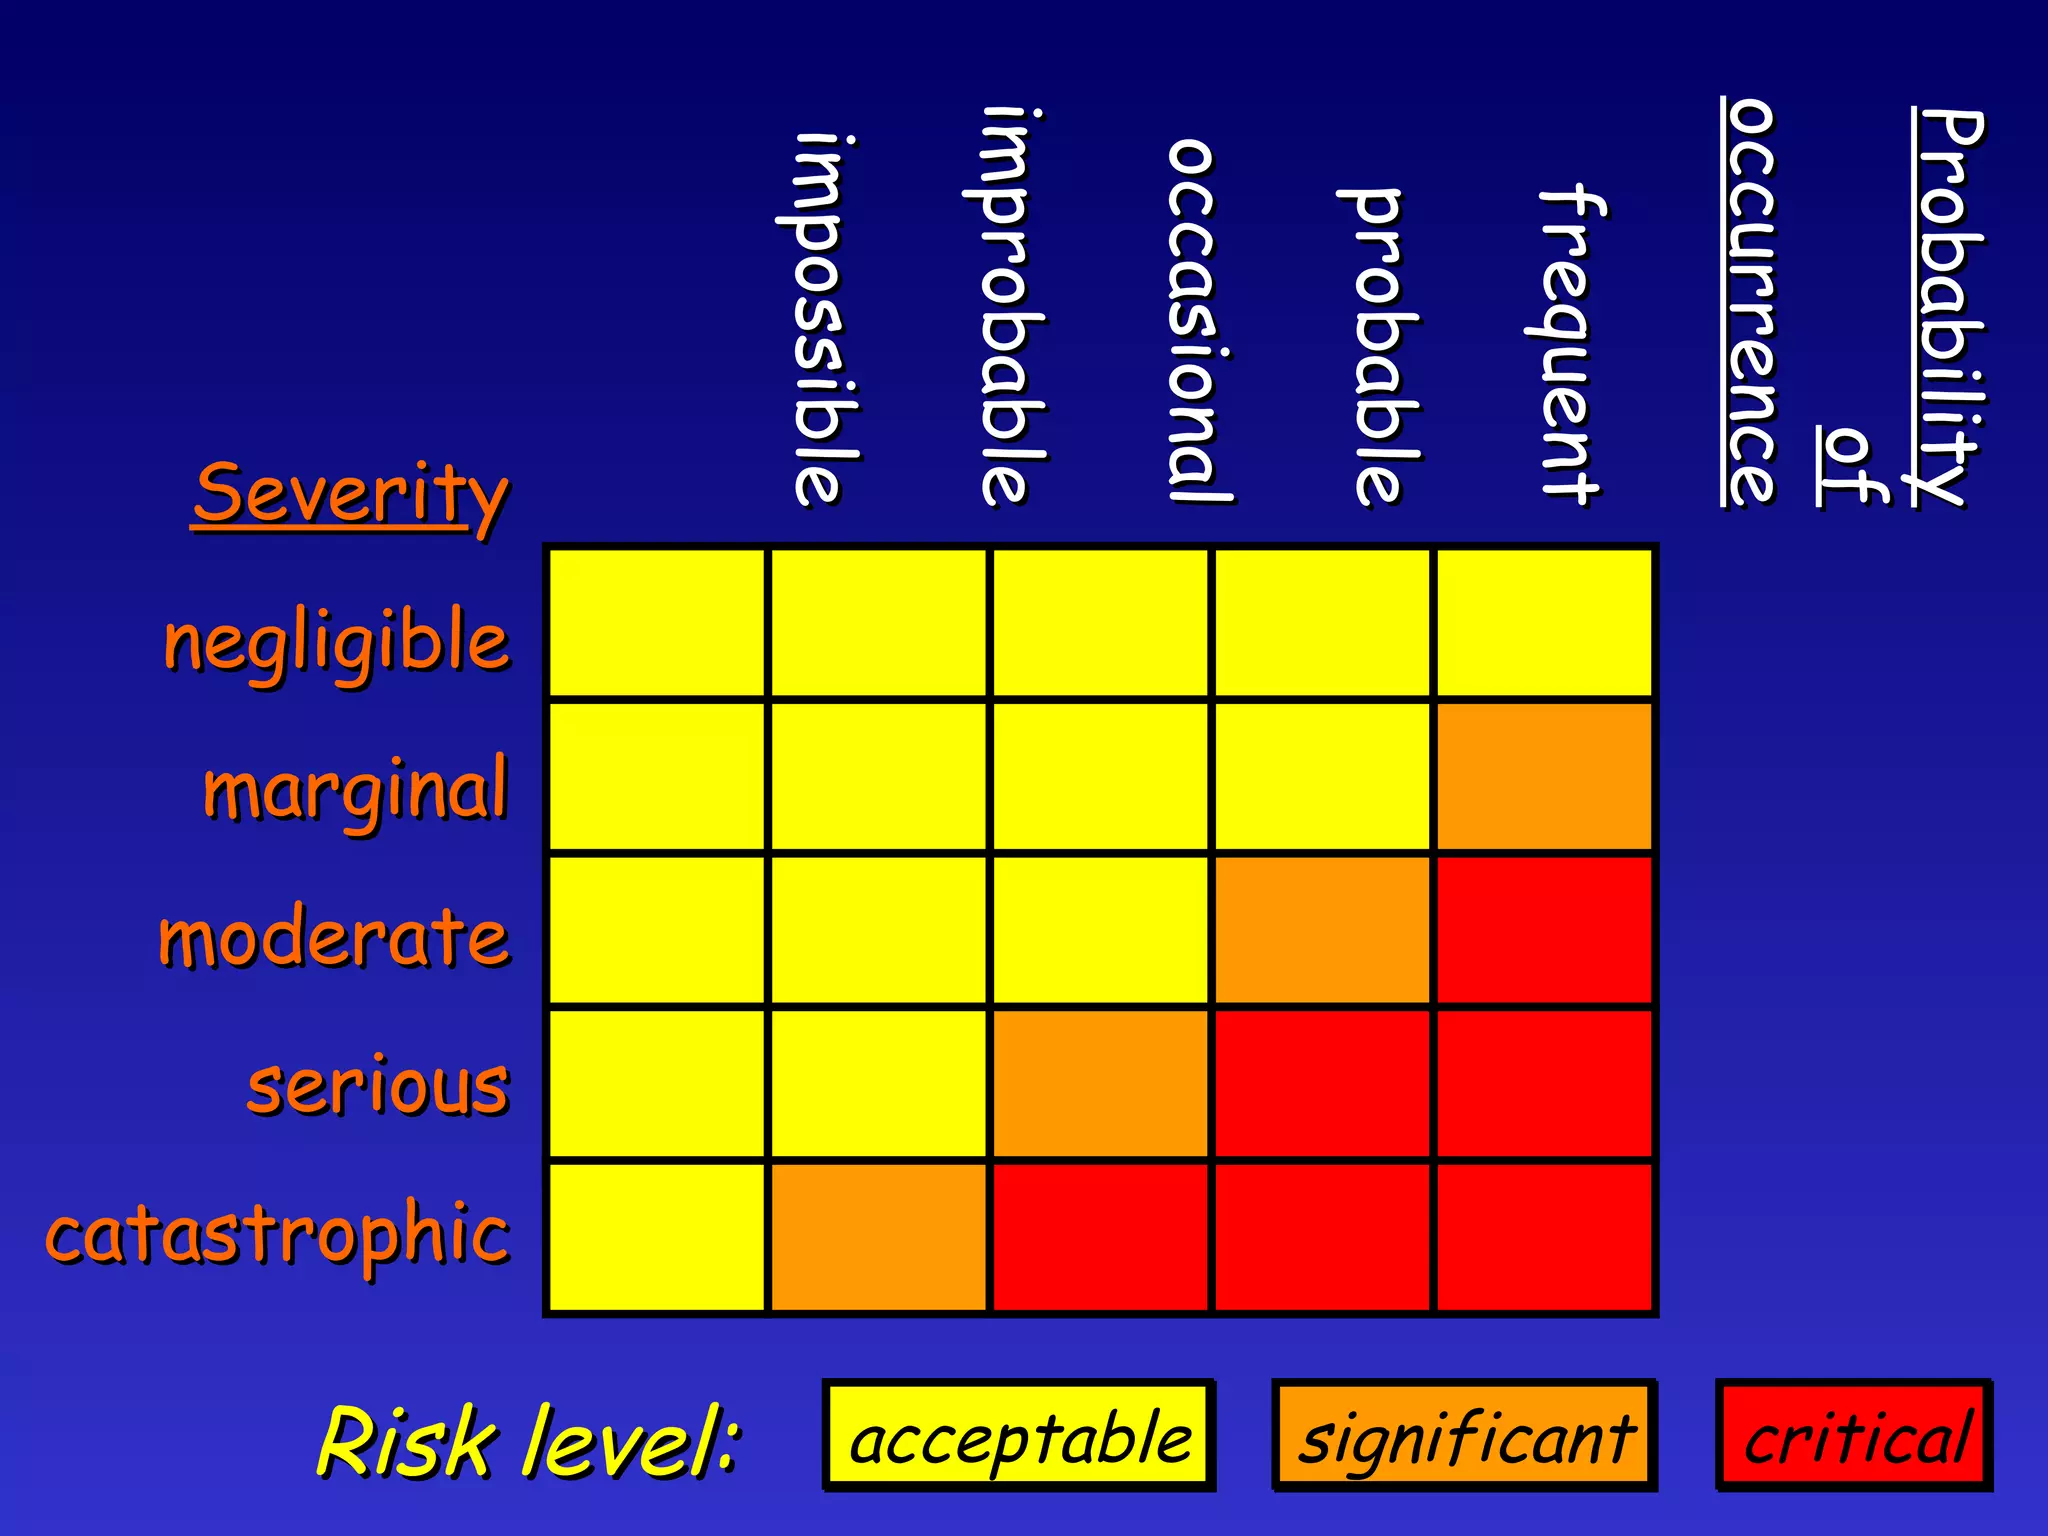
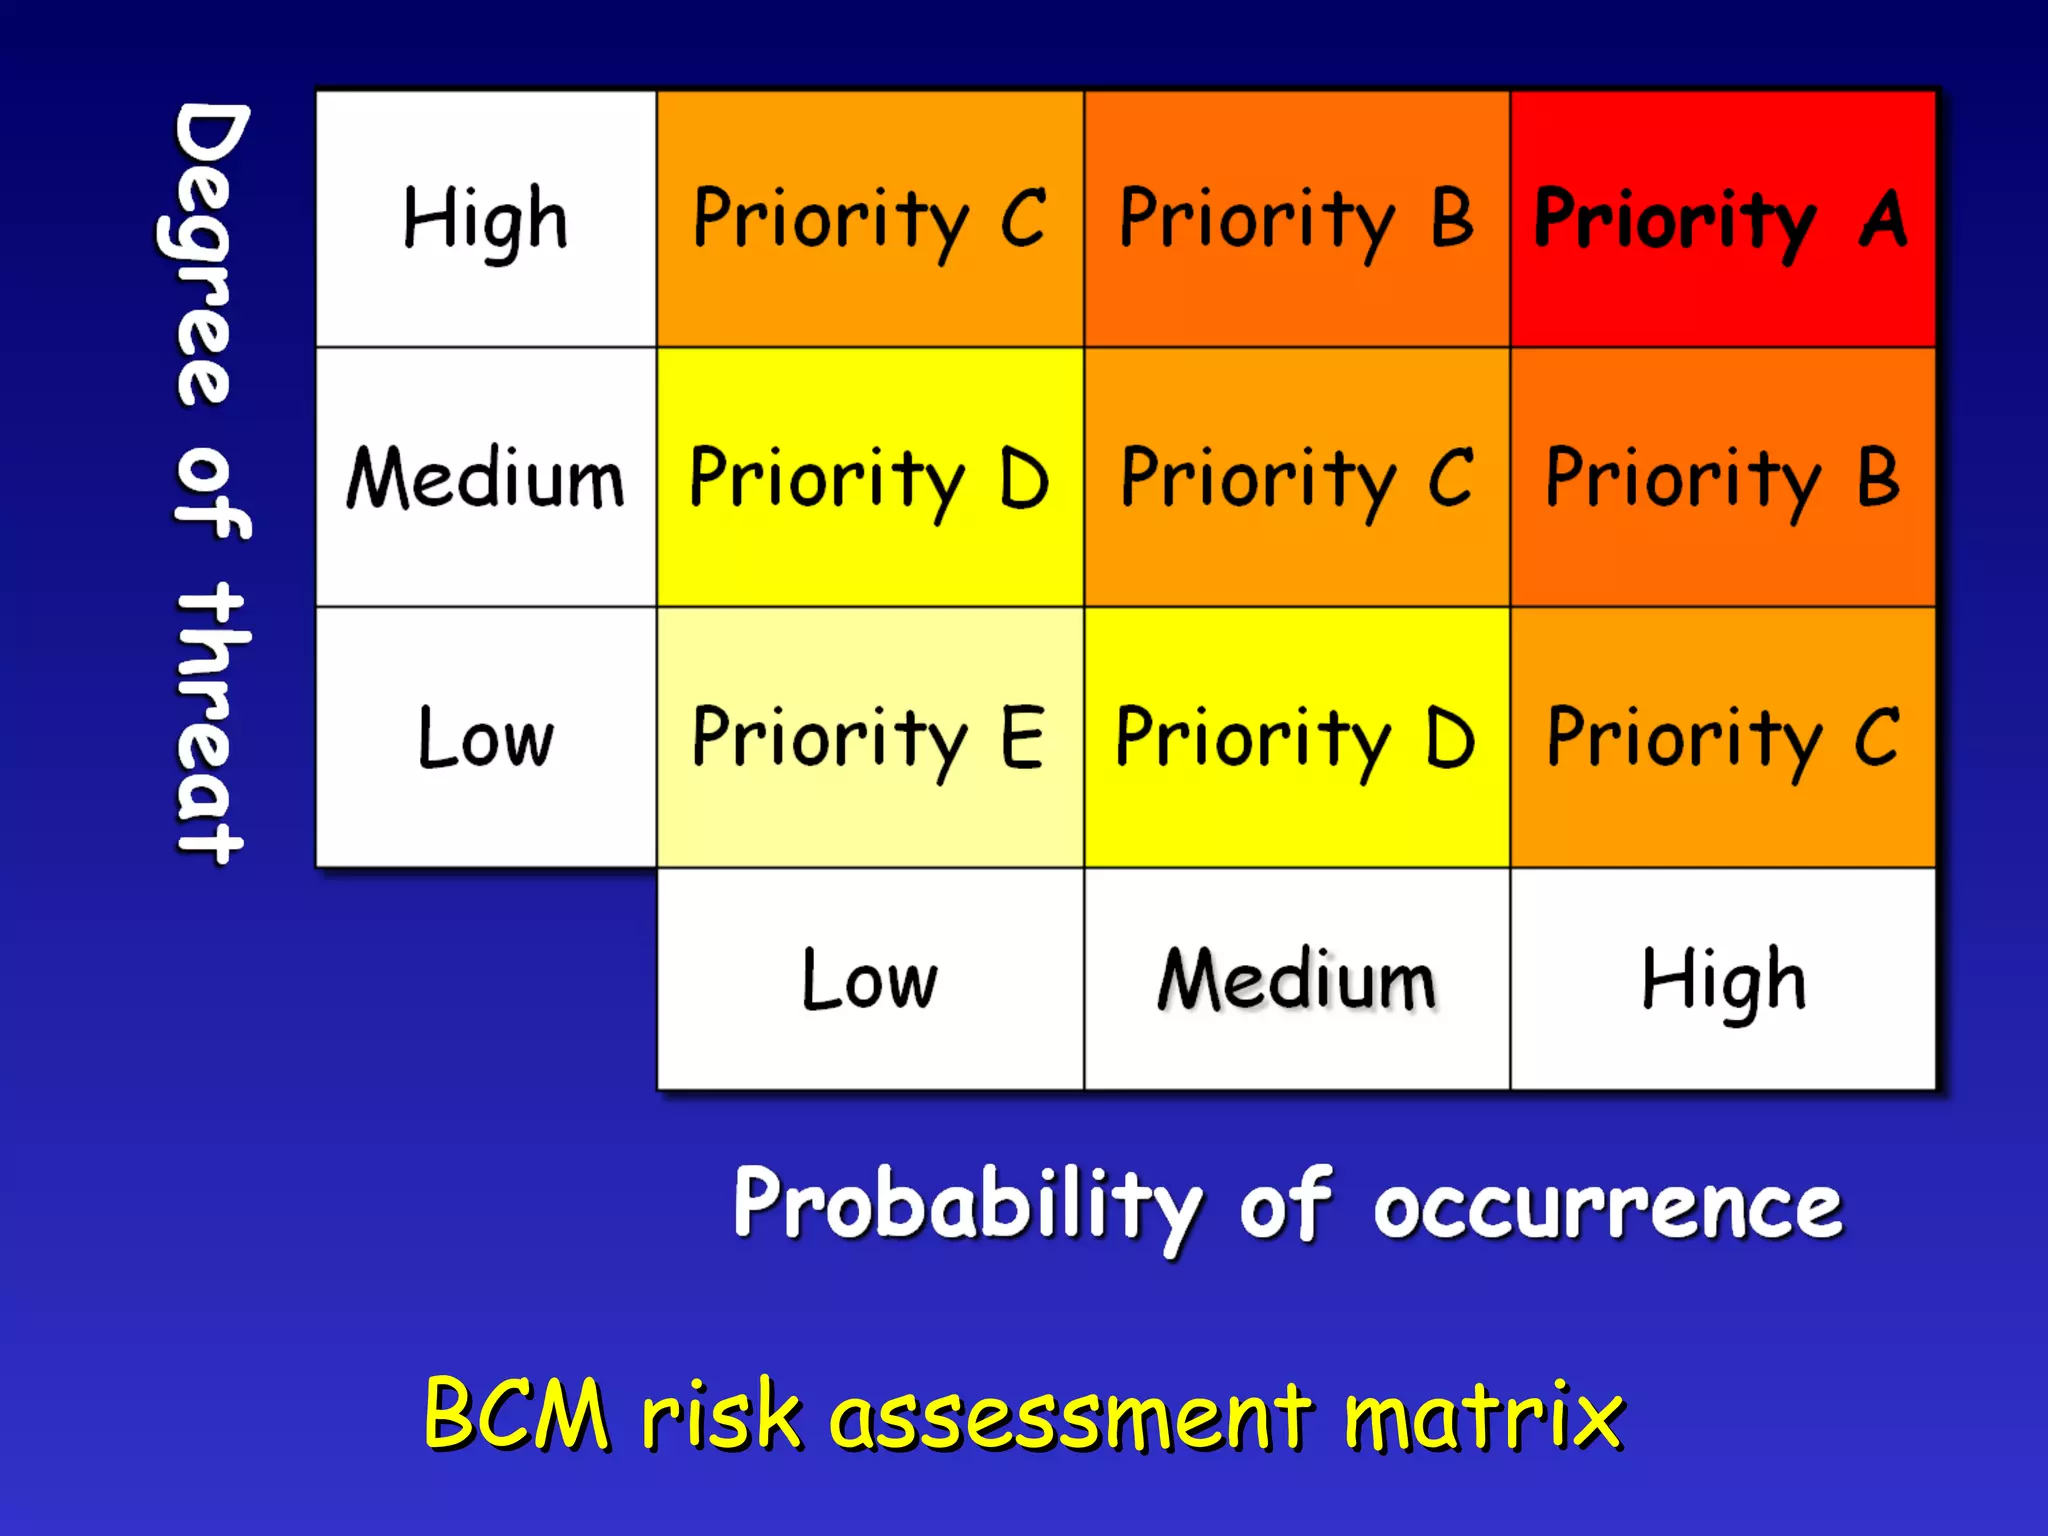
The document discusses various topics related to risk assessment and reduction. It notes that disaster losses have been increasing significantly in recent decades. Some key points made include: hazard x vulnerability = risk; risk is determined by the probability of an event and its consequences; vulnerability depends on factors like exposure, resilience, and coping capacity; and perceptions of risk can differ from actual measured risks.


