Download to read offline


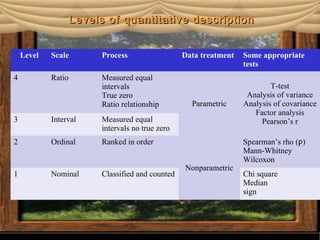


This document discusses different types of data and levels of quantitative description. It describes parametric data, which assumes a normal distribution, and nonparametric data, which does not assume a normal distribution. It outlines four levels of quantitative description from nominal to ratio scales. Descriptive analysis limits conclusions to the observed group, while inferential analysis involves sampling to draw conclusions about populations. Statistics are measures of sample characteristics that can estimate population parameters.