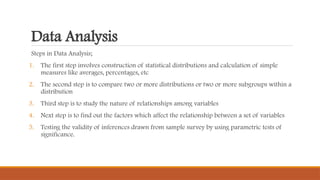
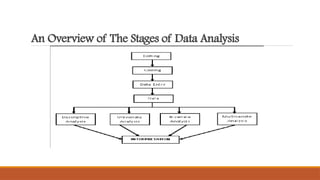
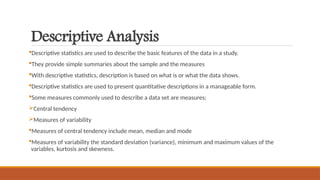
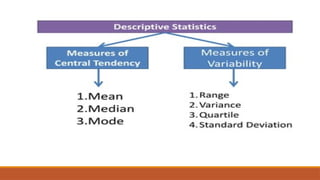
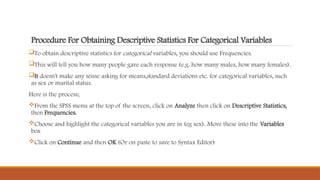
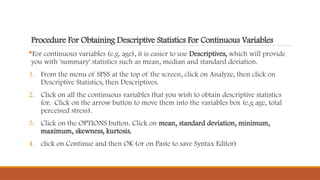
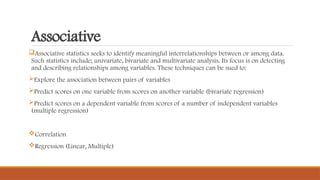
Monitoring and Evaluation II
DME 2203
Data Analysis
Kassan Kaselema
The Catholic University Of Malawi
Data Analysis
Steps in Data Analysis;
1. The first step involves construction of statistical distributions and calculation of simple
measures like averages, percentages, etc
2. The second step is to compare two or more distributions or two or more subgroups within a
distribution
3. Third step is to study the nature of relationships among variables
4. Next step is to find out the factors which affect the relationship between a set of variables
5. Testing the validity of inferences drawn from sample survey by using parametric tests of
significance.
An Overview of The Stages of Data Analysis
Descriptive Analysis
Descriptive statistics are used to describe the basic features of the data in a study.
They provide simple summaries about the sample and the measures
With descriptive statistics, description is based on what is or what the data shows.
Descriptive statistics are used to present quantitative descriptions in a manageable form.
Some measures commonly used to describe a data set are measures;
Central tendency
Measures of variability
Measures of central tendency include mean, median and mode
Measures of variability the standard deviation (variance), minimum and maximum values of the
variables, kurtosis and skewness.
Procedure For Obtaining Descriptive Statistics For Categorical Variables
To obtain descriptive statistics for categorical variables, you should use Frequencies.
This will tell you how many people gave each response (e.g. how many males, how many females).
It doesn't make any sense asking for means,standard deviations etc. for categorical variables, such
as sex or marital status.
Here is the process;
From the SPSS menu at the top of the screen, click on Analyze then click on Descriptive Statistics,
then Frequencies.
Choose and highlight the categorical variables you are in (eg sex). Move these into the Variables
box
Click on Continue and then OK (Or on paste to save to Syntax Editor)
Procedure For Obtaining Descriptive Statistics For Continuous Variables
For continuous variables (e.g. age), it is easier to use Descriptives, which will provide
you with 'summary' statistics such as mean, median and standard deviation.
1. From the menu of SPSS at the top of the screen, click on Analyze, then click on
Descriptive Statistics, then Descriptives.
2. Click on all the continuous variables that you wish to obtain descriptive statistics
for. Click on the arrow button to move them into the variables box (e.g age, total
perceived stress).
3. Click on the OPTIONS button. Click on mean, standard deviation, minimum,
maximum, skewness, kurtosis.
4. click on Continue and then OK (or on Paste to save Syntax Editor)
Associative
Associative statistics seeks to identify meaningful interrelationships between or among data.
Such statistics include; univariate, bivariate and multivariate analysis. Its focus is on detecting
and describing relationships among variables. These techniques can be sued to:
Explore the association between pairs of variables
Predict scores on one variable from scores on another variable (bivariate regression)
Predict scores on a dependent variable from scores of a number of independent variables
(multiple regression)
Correlation
Regression (Linear, Multiple)
CORRELATION
Correlation is used when you wish to describe the strength and direction of the
relationship between two variables.
It can also be used when one of the variables is dichotomous-that is, it has only two
values (e.g sex: males/females).
Partial correlation is used when you wish to explore the relationship between two
variables while statistically controlling for a third variable.
This is useful when you suspect that the relationship between your two variables of
interest may be influenced, or confounded by the impact of third variable.
Partial correlation statistically removes the influence of third variable, giving a
cleaner picture of the actual relationship between two variables.
Procedure in SPSS
CLICK ON;
Analyse
Correlate
Bivariate
Select your variables and move them into the box marked as variables
Check that the Pearson box and the 2 tail box have a cross in them
Then click OK
REGRESSION
Multiple regression is not just one technique but a family of techniques that can be used to explore
the relationship between one continuous dependent variable and a number of independent
variables or predictors.
Multiple regression is based on correlation, but allows a more sophisticated exploration of the
interrelationship among a set of variables.
It can tell how a set of variables is able to predict a particular outcome.
TYPES;
1) Linear –between two variables (1 independent variable, 1 dependent variable)
2) Multiple- between more than two variables (2 or more independent variables, 1 dependent
variable)
Procedure;
Analyze, then click on
Regression, then on
Linear
Click on your continuous dependent variable and move it into the dependent box
Click on your independent variables and move them into the independent box
For method, make sure Enter is selected (this will give you standard multiple
regression)
Click on OK
INFERENTIAL
Inferential statistics are used to draw conclusions abut a population by examining the sample.
POPULATION
Sample
inferential statistics is a technique used to draw conclusions about a
population by testing the data taken from the sample of that population.
It is the process of how generalization from sample to population can be
made. It is assumed that the characteristics of a sample is similar to the
population’s characteristics.
It includes testing hypothesis and deriving estimates
It focuses on making statements about the population
Process of Inferential Analysis
Raw Data  it comprises of all the data collected from the sample.
 Depending on the sample size, this data can be large or small set of
measurements
Sample
statistics
 It summarizes the raw data gathered from the sample of
population.
 These are the descriptive statistics (e.g measure of central
tendency)
Inferential
statistics
• These statistics then generate conclusions about the
population based on the sample statistics
Important Definitions
Probability is the mathematical possibility that a certain event will take place. They can range from
0 to 1.00
Parameters describe the characteristics of a sample of population; age, gender, income
Statistics describe the characteristics of a sample on same types of variables
Sampling distribution is used to make inferences based on the assumptions of random sampling
Sampling error: inferential statistics takes sampling error into account. It is the degree to which a
sample differs on a key variable from the population.
Confidence level: the number of times out of 100 that the true value will fall within the confidence
interval
Confidence interval: a calculated range for the true value, based on the relative sizes of the sample
and the population.
Sampling error describes the difference between sample statistics and population parameters

KASSAN KASELEMA. LESSON IV. D. DATA ANALYSIS

  • 1.
    Monitoring and EvaluationII DME 2203 Data Analysis Kassan Kaselema The Catholic University Of Malawi
  • 2.
    Data Analysis Steps inData Analysis; 1. The first step involves construction of statistical distributions and calculation of simple measures like averages, percentages, etc 2. The second step is to compare two or more distributions or two or more subgroups within a distribution 3. Third step is to study the nature of relationships among variables 4. Next step is to find out the factors which affect the relationship between a set of variables 5. Testing the validity of inferences drawn from sample survey by using parametric tests of significance.
  • 3.
    An Overview ofThe Stages of Data Analysis
  • 4.
    Descriptive Analysis Descriptive statisticsare used to describe the basic features of the data in a study. They provide simple summaries about the sample and the measures With descriptive statistics, description is based on what is or what the data shows. Descriptive statistics are used to present quantitative descriptions in a manageable form. Some measures commonly used to describe a data set are measures; Central tendency Measures of variability Measures of central tendency include mean, median and mode Measures of variability the standard deviation (variance), minimum and maximum values of the variables, kurtosis and skewness.
  • 6.
    Procedure For ObtainingDescriptive Statistics For Categorical Variables To obtain descriptive statistics for categorical variables, you should use Frequencies. This will tell you how many people gave each response (e.g. how many males, how many females). It doesn't make any sense asking for means,standard deviations etc. for categorical variables, such as sex or marital status. Here is the process; From the SPSS menu at the top of the screen, click on Analyze then click on Descriptive Statistics, then Frequencies. Choose and highlight the categorical variables you are in (eg sex). Move these into the Variables box Click on Continue and then OK (Or on paste to save to Syntax Editor)
  • 7.
    Procedure For ObtainingDescriptive Statistics For Continuous Variables For continuous variables (e.g. age), it is easier to use Descriptives, which will provide you with 'summary' statistics such as mean, median and standard deviation. 1. From the menu of SPSS at the top of the screen, click on Analyze, then click on Descriptive Statistics, then Descriptives. 2. Click on all the continuous variables that you wish to obtain descriptive statistics for. Click on the arrow button to move them into the variables box (e.g age, total perceived stress). 3. Click on the OPTIONS button. Click on mean, standard deviation, minimum, maximum, skewness, kurtosis. 4. click on Continue and then OK (or on Paste to save Syntax Editor)
  • 8.
    Associative Associative statistics seeksto identify meaningful interrelationships between or among data. Such statistics include; univariate, bivariate and multivariate analysis. Its focus is on detecting and describing relationships among variables. These techniques can be sued to: Explore the association between pairs of variables Predict scores on one variable from scores on another variable (bivariate regression) Predict scores on a dependent variable from scores of a number of independent variables (multiple regression) Correlation Regression (Linear, Multiple)
  • 9.
    CORRELATION Correlation is usedwhen you wish to describe the strength and direction of the relationship between two variables. It can also be used when one of the variables is dichotomous-that is, it has only two values (e.g sex: males/females). Partial correlation is used when you wish to explore the relationship between two variables while statistically controlling for a third variable. This is useful when you suspect that the relationship between your two variables of interest may be influenced, or confounded by the impact of third variable. Partial correlation statistically removes the influence of third variable, giving a cleaner picture of the actual relationship between two variables.
  • 10.
    Procedure in SPSS CLICKON; Analyse Correlate Bivariate Select your variables and move them into the box marked as variables Check that the Pearson box and the 2 tail box have a cross in them Then click OK
  • 11.
    REGRESSION Multiple regression isnot just one technique but a family of techniques that can be used to explore the relationship between one continuous dependent variable and a number of independent variables or predictors. Multiple regression is based on correlation, but allows a more sophisticated exploration of the interrelationship among a set of variables. It can tell how a set of variables is able to predict a particular outcome. TYPES; 1) Linear –between two variables (1 independent variable, 1 dependent variable) 2) Multiple- between more than two variables (2 or more independent variables, 1 dependent variable)
  • 12.
    Procedure; Analyze, then clickon Regression, then on Linear Click on your continuous dependent variable and move it into the dependent box Click on your independent variables and move them into the independent box For method, make sure Enter is selected (this will give you standard multiple regression) Click on OK
  • 13.
    INFERENTIAL Inferential statistics areused to draw conclusions abut a population by examining the sample. POPULATION Sample
  • 14.
    inferential statistics isa technique used to draw conclusions about a population by testing the data taken from the sample of that population. It is the process of how generalization from sample to population can be made. It is assumed that the characteristics of a sample is similar to the population’s characteristics. It includes testing hypothesis and deriving estimates It focuses on making statements about the population
  • 15.
    Process of InferentialAnalysis Raw Data  it comprises of all the data collected from the sample.  Depending on the sample size, this data can be large or small set of measurements Sample statistics  It summarizes the raw data gathered from the sample of population.  These are the descriptive statistics (e.g measure of central tendency) Inferential statistics • These statistics then generate conclusions about the population based on the sample statistics
  • 16.
    Important Definitions Probability isthe mathematical possibility that a certain event will take place. They can range from 0 to 1.00 Parameters describe the characteristics of a sample of population; age, gender, income Statistics describe the characteristics of a sample on same types of variables Sampling distribution is used to make inferences based on the assumptions of random sampling Sampling error: inferential statistics takes sampling error into account. It is the degree to which a sample differs on a key variable from the population. Confidence level: the number of times out of 100 that the true value will fall within the confidence interval Confidence interval: a calculated range for the true value, based on the relative sizes of the sample and the population. Sampling error describes the difference between sample statistics and population parameters