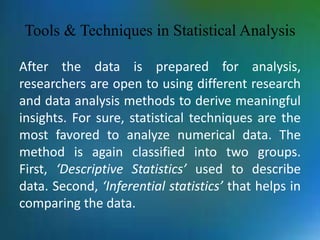
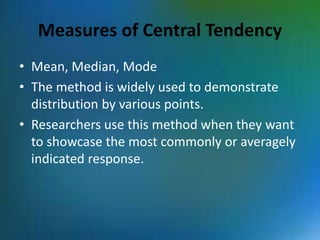
Statistical Analysis
Dr. D. Heena Cowsar
Assistant Professor of Commerce
Bon Secours College for Women
Thanjavur
heena.raffi@gmail.com
Tools & Techniques in Statistical Analysis
After the data is prepared for analysis,
researchers are open to using different research
and data analysis methods to derive meaningful
insights. For sure, statistical techniques are the
most favored to analyze numerical data. The
method is again classified into two groups.
First, ‘Descriptive Statistics’ used to describe
data. Second, ‘Inferential statistics’ that helps in
comparing the data.
Descriptive statistics
• This method is used to describe the basic features of
versatile types of data in research. It presents the data in
such a meaningful way that pattern in the data starts
making sense. Nevertheless, the descriptive analysis does
not go beyond making conclusions. The conclusions are
again based on the hypothesis researchers have
formulated so far. Here are a few major types of
descriptive analysis methods.
Measures of Frequency
• Count, Percent, Frequency
• It is used to denote home often a particular event occurs.
• Researchers use it when they want to showcase how
often a response is given.
Measures of Central Tendency
• Mean, Median, Mode
• The method is widely used to demonstrate
distribution by various points.
• Researchers use this method when they want
to showcase the most commonly or averagely
indicated response.
Measures of Dispersion or Variations
• Range, Variance, Standard deviation
• Here the field equals high/low points.
• Variance standard deviation = difference between
the observed score and mean
• It is used to identify the spread of scores by
stating intervals.
• Researchers use this method to showcase data
spread out. It helps them identify the depth until
which the data is spread out that it directly
affects the mean.
Measures of Position
• Percentile ranks, Quartile ranks
• It relies on standardized scores helping
researchers to identify the relationship
between different scores.
• It is often used when researchers want to
compare scores with the average count.
Inferential statistics
• Inferential statistics are used to make
predictions about a larger population after
research and data analysis of the representing
population’s collected sample. For example,
you can ask some odd 100 audiences at a
movie theater if they like the movie they are
watching. Researchers then use inferential
statistics on the collected sample to reason
that about 80-90% of people like the movie.
significant areas of inferential statistics.
• Estimating parameters: It takes statistics from
the sample research data and demonstrates
something about the population parameter.
• Hypothesis test: It’s about sampling research
data to answer the survey research questions.
For example, researchers might be interested to
understand if the new shade of lipstick recently
launched is good or not, or if the multivitamin
capsules help children to perform better at
games.
Tools under inferential Data analysis
• Correlation: When researchers are not
conducting experimental research wherein the
researchers are interested to understand the
relationship between two or more variables, they opt
for Correlational research methods.
• Cross-tabulation: Also called contingency
tables, cross-tabulation is used to analyze the
relationship between multiple variables. Suppose
provided data has age and gender categories
presented in rows and columns. A two-dimensional
cross-tabulation helps for seamless data analysis and
research by showing the number of males and
females in each age category.
Cont..
• Regression analysis: For understanding the strong
relationship between two variables, researchers do
not look beyond the primary and commonly
used regression analysis method, which is also a type
of predictive analysis used. In this method, you have
an essential factor called the dependent variable. You
also have multiple independent variables in
regression analysis. You undertake efforts to find out
the impact of independent variables on the
dependent variable. The values of both independent
and dependent variables are assumed as being
ascertained in an error-free random manner.
Cont..
• Analysis of variance: The statistical procedure
is used for testing the degree to which two or
more vary or differ in an experiment. A
considerable degree of variation means
research findings were significant. In many
contexts, ANOVA testing and variance
analysis are similar.
4. Hypothesis testing
• In statistical analysis, hypothesis testing, also
known as “T Testing”, is a key to testing the two
sets of random variables within the data set.
• This method is all about testing if a certain
argument or conclusion is true for the data set.
It allows for comparing the data against various
hypotheses and assumptions. It can also assist in
forecasting how decisions made could affect the
business.
Cont…
• In statistics, a hypothesis test determines some
quantity under a given assumption. The result of the
test interprets whether the assumption holds or
whether the assumption has been violated. This
assumption is referred to as the null hypothesis, or
hypothesis 0. Any other hypothesis that would be in
violation of hypothesis 0 is called the first hypothesis,
or hypothesis 1.
• When you conduct hypothesis testing, the results of
the test are significant to statistics if the results are
proof that it couldn’t have happened by a random
occurrence or chance.
References
• https://www.simplypsychology.org/type_I_an
d_type_II_errors.html
• https://medium.com/cracking-the-data-
science-interview/the-10-statistical-
techniques-data-scientists-need-to-master-
1ef6dbd531f7

Methods of Statistical Analysis & Interpretation of Data..pptx

  • 1.
    Statistical Analysis Dr. D.Heena Cowsar Assistant Professor of Commerce Bon Secours College for Women Thanjavur heena.raffi@gmail.com
  • 2.
    Tools & Techniquesin Statistical Analysis After the data is prepared for analysis, researchers are open to using different research and data analysis methods to derive meaningful insights. For sure, statistical techniques are the most favored to analyze numerical data. The method is again classified into two groups. First, ‘Descriptive Statistics’ used to describe data. Second, ‘Inferential statistics’ that helps in comparing the data.
  • 3.
    Descriptive statistics • Thismethod is used to describe the basic features of versatile types of data in research. It presents the data in such a meaningful way that pattern in the data starts making sense. Nevertheless, the descriptive analysis does not go beyond making conclusions. The conclusions are again based on the hypothesis researchers have formulated so far. Here are a few major types of descriptive analysis methods. Measures of Frequency • Count, Percent, Frequency • It is used to denote home often a particular event occurs. • Researchers use it when they want to showcase how often a response is given.
  • 4.
    Measures of CentralTendency • Mean, Median, Mode • The method is widely used to demonstrate distribution by various points. • Researchers use this method when they want to showcase the most commonly or averagely indicated response.
  • 5.
    Measures of Dispersionor Variations • Range, Variance, Standard deviation • Here the field equals high/low points. • Variance standard deviation = difference between the observed score and mean • It is used to identify the spread of scores by stating intervals. • Researchers use this method to showcase data spread out. It helps them identify the depth until which the data is spread out that it directly affects the mean.
  • 6.
    Measures of Position •Percentile ranks, Quartile ranks • It relies on standardized scores helping researchers to identify the relationship between different scores. • It is often used when researchers want to compare scores with the average count.
  • 7.
    Inferential statistics • Inferentialstatistics are used to make predictions about a larger population after research and data analysis of the representing population’s collected sample. For example, you can ask some odd 100 audiences at a movie theater if they like the movie they are watching. Researchers then use inferential statistics on the collected sample to reason that about 80-90% of people like the movie.
  • 8.
    significant areas ofinferential statistics. • Estimating parameters: It takes statistics from the sample research data and demonstrates something about the population parameter. • Hypothesis test: It’s about sampling research data to answer the survey research questions. For example, researchers might be interested to understand if the new shade of lipstick recently launched is good or not, or if the multivitamin capsules help children to perform better at games.
  • 9.
    Tools under inferentialData analysis • Correlation: When researchers are not conducting experimental research wherein the researchers are interested to understand the relationship between two or more variables, they opt for Correlational research methods. • Cross-tabulation: Also called contingency tables, cross-tabulation is used to analyze the relationship between multiple variables. Suppose provided data has age and gender categories presented in rows and columns. A two-dimensional cross-tabulation helps for seamless data analysis and research by showing the number of males and females in each age category.
  • 10.
    Cont.. • Regression analysis:For understanding the strong relationship between two variables, researchers do not look beyond the primary and commonly used regression analysis method, which is also a type of predictive analysis used. In this method, you have an essential factor called the dependent variable. You also have multiple independent variables in regression analysis. You undertake efforts to find out the impact of independent variables on the dependent variable. The values of both independent and dependent variables are assumed as being ascertained in an error-free random manner.
  • 11.
    Cont.. • Analysis ofvariance: The statistical procedure is used for testing the degree to which two or more vary or differ in an experiment. A considerable degree of variation means research findings were significant. In many contexts, ANOVA testing and variance analysis are similar.
  • 12.
    4. Hypothesis testing •In statistical analysis, hypothesis testing, also known as “T Testing”, is a key to testing the two sets of random variables within the data set. • This method is all about testing if a certain argument or conclusion is true for the data set. It allows for comparing the data against various hypotheses and assumptions. It can also assist in forecasting how decisions made could affect the business.
  • 13.
    Cont… • In statistics,a hypothesis test determines some quantity under a given assumption. The result of the test interprets whether the assumption holds or whether the assumption has been violated. This assumption is referred to as the null hypothesis, or hypothesis 0. Any other hypothesis that would be in violation of hypothesis 0 is called the first hypothesis, or hypothesis 1. • When you conduct hypothesis testing, the results of the test are significant to statistics if the results are proof that it couldn’t have happened by a random occurrence or chance.
  • 14.