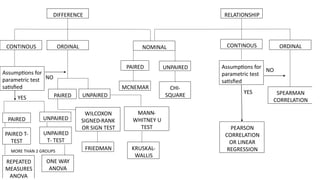
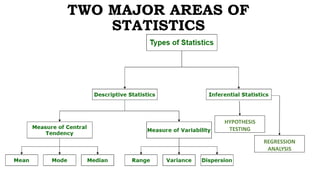
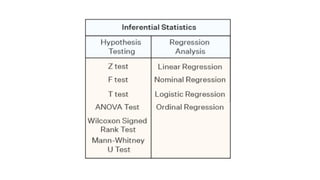
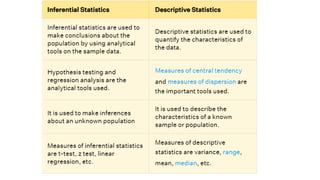
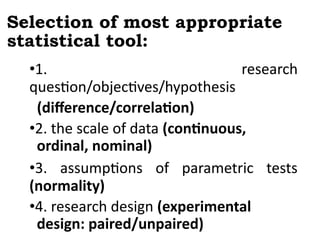
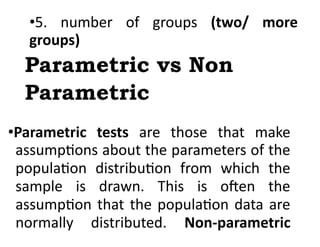
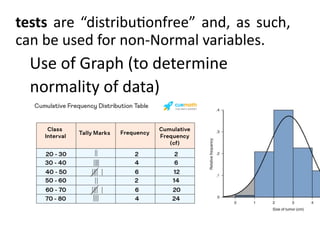
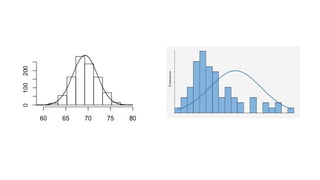
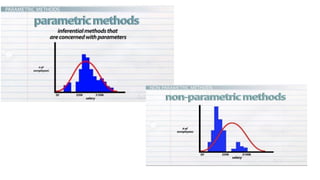
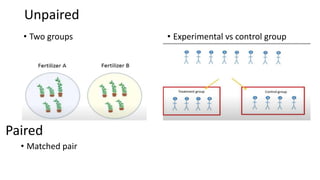
Analysis
Planning Data
CHOOSING A STATISTICAL TOOL
•Data are measurements or observations that
are collected as a source of information
•The frequency (f) of a particular value is the
number of times the value occurs in the data.
•Percentage “Per cent” means “out of every
100”. Percentage figures are derived by dividing
one quantity by another with the latter
rebased to 100.
•Mean is the average of the given numbers and is
calculated by dividing the sum of given numbers by
the total number of numbers.
•A standard deviation (or σ) is a measure of how
dispersed the data is in relation to the mean. Low,
or small, standard deviation indicates data are
clustered tightly around the mean, and high, or
large, standard deviation indicates data are more
spread out.
•Tables are defined by rows and columns
containing text or numerical data.
•Figures are defined as any visual element
that is not a table. Line graphs, pie charts,
photographs, sketches, schematics are all
types of figures
•Parametric tests are those that make assumptions about
the parameters of the population distribution from
which the sample is drawn. This is often the assumption
that the population data are normally distributed.
•Nonparametric tests are methods of statistical analysis
that do not require a distribution to meet the required
assumptions to be analyzed (especially if the data is not
normally distributed). Due to this reason, they are
sometimes referred to as distribution-free tests.
•Correlation is a statistical measure (expressed as a number)
that describes the size and direction of a relationship
between two or more variables. A correlation between
variables, however, does not automatically mean that the
change in one variable is the cause of the change in the
values of the other variable.
• Regression a statistical technique that relates a dependent
variable to one or more independent (explanatory)
variables. A regression model is able to show whether
changes observed in the dependent variable are associated
with changes in one or more of the explanatory variables.
CORRELATION
SPEARMAN
REGRESSION
OR LINEAR
CORRELATION
PEARSON
NO
YES
satisfied
parametric test
Assumptions for
SQUARE
-
CHI
MCNEMAR
PAIRED UNPAIRED
WALLIS
-
KRUSKAL
TEST
WHITNEY U
-
MANN
FRIEDMAN
OR SIGN TEST
RANK
-
SIGNED
WILCOXON
UNPAIRED
PAIRED
MORE THAN 2 GROUPS
ANOVA
ONE WAY
ANOVA
MEASURES
REPEATED
TEST
-
T
UNPAIRED
TEST
-
PAIRED T
UNPAIRED
PAIRED
NO
YES
satisfied
parametric test
Assumptions for
ORDINAL
CONTINOUS
NOMINAL
ORDINAL
CONTINOUS
RELATIONSHIP
DIFFERENCE
TWO MAJOR AREAS OF
STATISTICS
ANALYSIS
REGRESSION
TESTING
HYPOTHESIS
•Descriptive Statistical Technique provides a summary
of the ordered or sequenced data from your research
sample. Examples of these tools are frequency
distribution, measure of central tendencies (mean,
median, mode), and standard deviation.
•Inferential Statistics is used when the research study
focuses on finding predictions; testing hypothesis;
and finding interpretations, generalizations, and
conclusions.
Types of Descriptive Statistics
• Descriptive statistics summarize a given data set, which can be either a
representation of the entire population or a sample of a population.
• Descriptive statistics consists of basic categories of measures: measures
of central tendency and measures of variability (or spread)
• Measures of central tendency describe the center of the data set (mean,
median, mode).
• Measures of variability/dispersion describe the dispersion of the data
set (range, variance, standard deviation).
• Measures of central tendency focus on the average or middle values of
data sets, whereas measures of variability focus on the dispersion of
data.
Types of Inferential Statistics
Inferential statistics is a branch of statistics that makes
the use of various analytical tools to draw inferences about
the population data from sample data. Inferential statistics
help to draw conclusions about the population while
descriptive statistics summarizes the features of the data set.
There are two main types of inferential statistics hypothesis
testing and regression analysis. The samples chosen in
inferential statistics need to be representative of the entire
population.
• Inferential statistics helps to develop a good understanding
of the population data by analyzing the samples obtained
from it.
• It helps in making generalizations about the population by
using various analytical tests and tools.
• In order to pick out random samples that will represent the
population accurately many sampling techniques are used.
Some of the important methods are simple random
sampling, stratified sampling, cluster sampling, and
systematic sampling techniques.
• The goal of inferential statistics is to make generalizations
about a population. In inferential statistics, a statistic is
taken from the sample data (e.g., the sample mean) that
used to make inferences about the population parameter
(e.g., the population mean).
Selection of most appropriate
statistical tool:
•1. research
question/objectives/hypothesis
(difference/correlation)
•2. the scale of data (continuous,
ordinal, nominal)
•3. assumptions of parametric tests
(normality)
•4. research design (experimental
design: paired/unpaired)
•5. number of groups (two/ more
groups)
Parametric vs Non
Parametric
•Parametric tests are those that make
assumptions about the parameters of the
population distribution from which the
sample is drawn. This is often the
assumption that the population data are
normally distributed. Non-parametric
tests are “distributionfree” and, as such,
can be used for non-Normal variables.
Use of Graph (to determine
normality of data)
Unpaired
• Two groups • Experimental vs control group
Paired
• Matched pair
Paired
• Before and after
Paired study design
Essential Ways to Choose the Right
Statistical Test
1. Research Question
• The decision for a statistical test depends on the research question that
needs to be answered. Additionally, the research questions will help you
formulate the data structure and research design.
2. Formulation of Null Hypothesis
• After defining the research question, you could develop a null hypothesis.
A null hypothesis suggests that no statistical significance exists in the
expected observations.
3. The Number of Variables to Be Analyzed
• Statistical tests and procedures are divided according to the number of
variables that are designed to analyze. Therefore, while choosing the test ,
you must consider how many variables you want to analyze.
6. Type of Data
•It is important to define whether your data is continuous,
categorical, or binary. In the case of continuous data, you
must also check if the data are normally distributed or
skewed, to further define which statistical test to consider
(parametric or non parametric) 7. Paired and Unpaired
Study Designs
•A paired design includes comparison studies where the two
population means are compared when the two samples
depend on each other. In an unpaired or independent
study design, the results of the two samples are grouped
and then compared.
Planning-Data-Analysis-CHOOSING-STATISTICAL-TOOL.docx

Planning-Data-Analysis-CHOOSING-STATISTICAL-TOOL.docx

  • 1.
  • 2.
  • 3.
    •Data are measurementsor observations that are collected as a source of information •The frequency (f) of a particular value is the number of times the value occurs in the data. •Percentage “Per cent” means “out of every 100”. Percentage figures are derived by dividing one quantity by another with the latter rebased to 100.
  • 4.
    •Mean is theaverage of the given numbers and is calculated by dividing the sum of given numbers by the total number of numbers. •A standard deviation (or σ) is a measure of how dispersed the data is in relation to the mean. Low, or small, standard deviation indicates data are clustered tightly around the mean, and high, or large, standard deviation indicates data are more spread out.
  • 5.
    •Tables are definedby rows and columns containing text or numerical data. •Figures are defined as any visual element that is not a table. Line graphs, pie charts, photographs, sketches, schematics are all types of figures •Parametric tests are those that make assumptions about the parameters of the population distribution from which the sample is drawn. This is often the assumption that the population data are normally distributed.
  • 6.
    •Nonparametric tests aremethods of statistical analysis that do not require a distribution to meet the required assumptions to be analyzed (especially if the data is not normally distributed). Due to this reason, they are sometimes referred to as distribution-free tests. •Correlation is a statistical measure (expressed as a number) that describes the size and direction of a relationship between two or more variables. A correlation between variables, however, does not automatically mean that the change in one variable is the cause of the change in the values of the other variable.
  • 7.
    • Regression astatistical technique that relates a dependent variable to one or more independent (explanatory) variables. A regression model is able to show whether changes observed in the dependent variable are associated with changes in one or more of the explanatory variables.
  • 8.
    CORRELATION SPEARMAN REGRESSION OR LINEAR CORRELATION PEARSON NO YES satisfied parametric test Assumptionsfor SQUARE - CHI MCNEMAR PAIRED UNPAIRED WALLIS - KRUSKAL TEST WHITNEY U - MANN FRIEDMAN OR SIGN TEST RANK - SIGNED WILCOXON UNPAIRED PAIRED MORE THAN 2 GROUPS ANOVA ONE WAY ANOVA MEASURES REPEATED TEST - T UNPAIRED TEST - PAIRED T UNPAIRED PAIRED NO YES satisfied parametric test Assumptions for ORDINAL CONTINOUS NOMINAL ORDINAL CONTINOUS RELATIONSHIP DIFFERENCE
  • 9.
    TWO MAJOR AREASOF STATISTICS ANALYSIS REGRESSION TESTING HYPOTHESIS
  • 10.
    •Descriptive Statistical Techniqueprovides a summary of the ordered or sequenced data from your research sample. Examples of these tools are frequency distribution, measure of central tendencies (mean, median, mode), and standard deviation. •Inferential Statistics is used when the research study focuses on finding predictions; testing hypothesis; and finding interpretations, generalizations, and conclusions.
  • 11.
    Types of DescriptiveStatistics • Descriptive statistics summarize a given data set, which can be either a representation of the entire population or a sample of a population. • Descriptive statistics consists of basic categories of measures: measures of central tendency and measures of variability (or spread) • Measures of central tendency describe the center of the data set (mean, median, mode). • Measures of variability/dispersion describe the dispersion of the data set (range, variance, standard deviation). • Measures of central tendency focus on the average or middle values of data sets, whereas measures of variability focus on the dispersion of data.
  • 12.
    Types of InferentialStatistics Inferential statistics is a branch of statistics that makes the use of various analytical tools to draw inferences about the population data from sample data. Inferential statistics help to draw conclusions about the population while descriptive statistics summarizes the features of the data set. There are two main types of inferential statistics hypothesis testing and regression analysis. The samples chosen in inferential statistics need to be representative of the entire population. • Inferential statistics helps to develop a good understanding of the population data by analyzing the samples obtained from it.
  • 13.
    • It helpsin making generalizations about the population by using various analytical tests and tools. • In order to pick out random samples that will represent the population accurately many sampling techniques are used. Some of the important methods are simple random sampling, stratified sampling, cluster sampling, and systematic sampling techniques. • The goal of inferential statistics is to make generalizations about a population. In inferential statistics, a statistic is taken from the sample data (e.g., the sample mean) that used to make inferences about the population parameter (e.g., the population mean).
  • 16.
    Selection of mostappropriate statistical tool: •1. research question/objectives/hypothesis (difference/correlation) •2. the scale of data (continuous, ordinal, nominal) •3. assumptions of parametric tests (normality) •4. research design (experimental design: paired/unpaired)
  • 17.
    •5. number ofgroups (two/ more groups) Parametric vs Non Parametric •Parametric tests are those that make assumptions about the parameters of the population distribution from which the sample is drawn. This is often the assumption that the population data are normally distributed. Non-parametric
  • 18.
    tests are “distributionfree”and, as such, can be used for non-Normal variables. Use of Graph (to determine normality of data)
  • 21.
    Unpaired • Two groups• Experimental vs control group Paired • Matched pair
  • 23.
  • 24.
    Paired study design EssentialWays to Choose the Right Statistical Test
  • 25.
    1. Research Question •The decision for a statistical test depends on the research question that needs to be answered. Additionally, the research questions will help you formulate the data structure and research design. 2. Formulation of Null Hypothesis • After defining the research question, you could develop a null hypothesis. A null hypothesis suggests that no statistical significance exists in the expected observations. 3. The Number of Variables to Be Analyzed • Statistical tests and procedures are divided according to the number of variables that are designed to analyze. Therefore, while choosing the test , you must consider how many variables you want to analyze.
  • 26.
    6. Type ofData •It is important to define whether your data is continuous, categorical, or binary. In the case of continuous data, you must also check if the data are normally distributed or skewed, to further define which statistical test to consider (parametric or non parametric) 7. Paired and Unpaired Study Designs •A paired design includes comparison studies where the two population means are compared when the two samples depend on each other. In an unpaired or independent
  • 27.
    study design, theresults of the two samples are grouped and then compared.