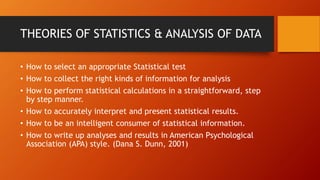
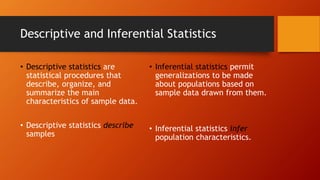
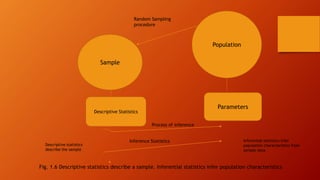
SlideShare a Scribd company logo
1 of 32
STATISTICS AND DATA ANALYSIS
AS TOOLS FOR RESEARCHERS
INTRODUCTION
By Desmond Ayim-Aboagye, PhD
THEORIES OF STATISTICS & ANALYSIS OF DATA
• How to select an appropriate Statistical test
• How to collect the right kinds of information for analysis
• How to perform statistical calculations in a straightforward, step
by step manner.
• How to accurately interpret and present statistical results.
• How to be an intelligent consumer of statistical information.
• How to write up analyses and results in American Psychological
Association (APA) style. (Dana S. Dunn, 2001)
A Statistic
• A statistic is some piece of information that is presented in
numerical form. For example, a nation’s 5% unemployment rate is
a statistic, and so is the average number of words per minute read
by a group of second-grades or the reported high temperature on
july day in June.
Data Analysis
• Data analysis refers to the systematic examination of a collection
of observations. The examination can answer a question, search
for a pattern, or otherwise make sense out of the observations.
Statistic and Data Analysis
• Statistic and data analysis are complementary, but not equivalent
terms.
• Example: Quantitative and Qualitative
• Quantitative relationships are numerical.
• Qualitative relationships are based on descriptions or organizing
themes, not numbers.
A Variable
• A variable is any factor that can be measured or have a different
value. Such factors can vary from person to person, place to
place, experimental situation to experimental situation.
• Example:
• a. Hair color can be a variable (blonde, brunette, redhead)
• b. The day of the week
• c. Weight
A Constant
• A constant is usually a number whose value does not change.
• Example 𝜋 (pronounce “pie”) which equals 3.1416
• It can also refer to a characteristic pertaining to a person or
environment that does not change.
Variables and Constant
• Variables take on different
values
• Constants do not change
Statistics and Data Analysis
• Statistics and data analysis highlight possible solutions or answers
to questions, not absolute or definitive conclusions.
Statistics and Mathematics
• Statistics is not equal to mathematics (Statistics ≠ Mathematics)
• Statistics is the science of data, not mathematics.
• “The field of statistics is concerned with making sense out of
empirical data , particularly when those data contain some
element of uncertainty so that we do not know the true state of
affairs, how, say a set of variables affect one another” (Dana,
2001)
EMPIRICAL
• Empirical refers to anything derived from experiences or
experiment.
Statistic, Data Analysis, & Scientific Method
• Researchers in the behavioral sciences use statistics to analyze
data collected within the framework of the scientific method.
• The Scientific method: The scientific method guides research by
identifying a problem, formulating a hypothesis, and collecting
empirical data to test the hypothesis.
A Hypothesis
• A hypothesis is a testable question or prediction, one usually
designed to explain some phenomenon.
• Examples:
• A. There is an association between the color of the skin and the
continent where a person comes from.
• B. Individuals who hails from broken homes tend to be criminals.
• C. Children who watch violent films grow up to become aggressive
individuals.
A Theory
• A theory is a collection of related facts, often derived from
hypotheses and the scientific method, forming a coherent
explanation for a larger phenomenon.
• Examples:
• A. The Theory of Aggression
• B. The Theory of Cognitive Dissonance (Leon Festinger)
• C. The life Cycle Theory (Erik Eriksson)
• D. Operant Condition (Pavlov)
INDUCTIVE AND DEDUCTIVE REASONING
• Inductive: Genralizing from one or more observations in the course
of developing a more general explanation.
• Observations are used to generate theories.
• Induction data lead to theory
• Psychology, economics, education, sociology, and anthropology
often rely on inductive reasoning (Dana, 2001: p.10 f.)
Deductive Reasoning/method
• Deductive reasoning is characterized by the use of existing
theories to develop conclusions, called deductions, about how
some unexamined phenomenon is likely to operate.
• Theory is used to search for confirming observations (hypotheses).
• Deduction: Theory leads to data
THEORY (Generalizations)
Inductive reasoning
Deductive reasoningxxx Observations
xxxx
POPULATIONS AND SAMPLES
SAMPLING PROCEDURES
A Population
• A population is a complete set of data possessing some observable
characteristic, or a theoretical set of potential observations.
A Sample
• A sample is a smaller unit or subset bearing the same
characteristic or characteristics of the population of interest.
Population
Sample
Figure 1.2. Samples are drawn from Population (Dana, 2001)
Adequate sample describe populations
accurately.
A Population Parameter
• A population parameter is a value that summarizes some
important, measurable characteristic of a population. Although
population parameters are estimated from statistics, they are
constants.
• Parameters are estimated but they do not change.
A Sample Statistic
• A sample statistic is a summary value based upon some measurable
characteristic of a sample.
• The value of sample statistics can vary from sample to sample.
• Statistics are calculated from sample data, and they change from sample
to sample.
• “Although sample statistics are apt to change from sample to sample, a
parameter, such as a population average, will not change.” (Dana, 2001;
p. 14)
SAMPLE RANDOM SAMPLING
• Sampling random sampling is a process whereby a subset is drawn
from a population in such a way that each member of the
population has the same opportunity of being selected for
inclusion in the subset as all the others.
xxxxxxxxxx
xxxxxxxxxx
xxxxxxxxxx
x
Sample 1
Sample 2
Sample 3
Sample
statistic 1
Sample
statistic 2
Sample statistic 3
Population parameters
are constants
Sample statistics for different samples can vary: 1 ≠ 2, 1 ≠ 3, 2 ≠ 3.
Figure 1.3. Different samples can yield different sample statistics (Dana, 2001)
sampling
sampling
sampling
Population
Sample
Sample statistics
Parameters
Process of inference
Random sampling procedure
Figure 1.4. Random sampling and the process of inference (Dana, 2001)
Descriptive and Inferential Statistics
Descriptive Statistics
Descriptive and Inferential Statistics
• Descriptive statistics are
statistical procedures that
describe, organize, and
summarize the main
characteristics of sample data.
• Descriptive statistics describe
samples
• Inferential statistics permit
generalizations to be made
about populations based on
sample data drawn from them.
• Inferential statistics infer
population characteristics.
Population
Sample
Parameters
Descriptive Statistics
Process of inference
Inference Statistics
Random Sampling
procedure
Descriptive statistics
describe the sample
Inferential statistics infer
population characteristics from
sample data
Fig. 1.6 Descriptive statistics describe a sample. Inferential statistics infer population characteristics
Discontinuous and Continuous Variables
• A discontinuous variable is countable,
and it has gaps between each number
where no intermediate values can occur
(discrete variables)
• Examples:
• Participants response e.g 1 = yes, 2 = no,
3 = other
• Description, eg 1 = first year, 2 =
sophomore, 3 = junior, 4 = senior, 5 =
other
• A continuous variable can take on any
numerical value on a scale, and there
exists an infinite number of values
between any two numbers on a scale.
• Examples:
• GPA 4.0 = A, 3.67 = B+ etc
True limit
• True limits are a range of values within which a true value for
some variable is contained.
• True limits are calculated by taking the value of a continuous
variable and then adding and subtracting one half of the unit of
measurement from it.
• True limits are sometimes called real limits.
• True limit delineate a range of values where a true value of some
variable is presumably located.
• Lower true limit– Upper true limit
Figure 1.7 True limits and different levels of precision for hypothetical weight (Dana,
2001)
Bathroo
m scale
weight 157
158 159
160
Observed weight
157.5 158.5
True limits

More Related Content

What's hot

Relevance of statistics sgd-slideshare
Relevance of statistics sgd-slideshareRelevance of statistics sgd-slideshare
Relevance of statistics sgd-slideshareSanjeev Deshmukh
 
Statistics basics by slsmls
Statistics basics by slsmlsStatistics basics by slsmls
Statistics basics by slsmlsRavi Kumudesh
 
Common statistical tools used in research and their uses
Common statistical tools used in research and their usesCommon statistical tools used in research and their uses
Common statistical tools used in research and their usesNorhac Kali
 
Introduction to biostatistic
Introduction to biostatisticIntroduction to biostatistic
Introduction to biostatisticJoshua Anish
 
Epidemiolgy and biostatistics notes
Epidemiolgy and biostatistics notesEpidemiolgy and biostatistics notes
Epidemiolgy and biostatistics notesCharles Ntwale
 
Meaning and Importance of Statistics
Meaning and Importance of StatisticsMeaning and Importance of Statistics
Meaning and Importance of StatisticsFlipped Channel
 
Inferential statictis ready go
Inferential statictis ready goInferential statictis ready go
Inferential statictis ready goMmedsc Hahm
 
Characteristics of statistics
Characteristics of statistics Characteristics of statistics
Characteristics of statistics Sarfraz Ahmad
 
Biostatistics and Statistical Bioinformatics
Biostatistics and Statistical BioinformaticsBiostatistics and Statistical Bioinformatics
Biostatistics and Statistical BioinformaticsSetia Pramana
 
Introduction to Statistics
Introduction to StatisticsIntroduction to Statistics
Introduction to Statisticsteena1991
 
Introduction to biostatistics
Introduction to biostatisticsIntroduction to biostatistics
Introduction to biostatisticsAli Al Mousawi
 
Meaning of statistics
Meaning of statisticsMeaning of statistics
Meaning of statisticsSarfraz Ahmad
 
Analysing qualitative data from information organizations
Analysing qualitative data from information organizationsAnalysing qualitative data from information organizations
Analysing qualitative data from information organizationsAleeza Ahmad
 
Chapter 1 introduction to statistics
Chapter 1 introduction to statisticsChapter 1 introduction to statistics
Chapter 1 introduction to statisticsJohn Carlo Catacutan
 
Power, Effect Sizes, Confidence Intervals, & Academic Integrity
Power, Effect Sizes, Confidence Intervals, & Academic IntegrityPower, Effect Sizes, Confidence Intervals, & Academic Integrity
Power, Effect Sizes, Confidence Intervals, & Academic IntegrityJames Neill
 

What's hot (20)

Relevance of statistics sgd-slideshare
Relevance of statistics sgd-slideshareRelevance of statistics sgd-slideshare
Relevance of statistics sgd-slideshare
 
Statistics basics by slsmls
Statistics basics by slsmlsStatistics basics by slsmls
Statistics basics by slsmls
 
Common statistical tools used in research and their uses
Common statistical tools used in research and their usesCommon statistical tools used in research and their uses
Common statistical tools used in research and their uses
 
Problems statistics 1
Problems statistics 1Problems statistics 1
Problems statistics 1
 
Introduction to biostatistic
Introduction to biostatisticIntroduction to biostatistic
Introduction to biostatistic
 
Epidemiolgy and biostatistics notes
Epidemiolgy and biostatistics notesEpidemiolgy and biostatistics notes
Epidemiolgy and biostatistics notes
 
Meaning and Importance of Statistics
Meaning and Importance of StatisticsMeaning and Importance of Statistics
Meaning and Importance of Statistics
 
Inferential statictis ready go
Inferential statictis ready goInferential statictis ready go
Inferential statictis ready go
 
Characteristics of statistics
Characteristics of statistics Characteristics of statistics
Characteristics of statistics
 
Lo1 Research & Statistics
Lo1 Research & StatisticsLo1 Research & Statistics
Lo1 Research & Statistics
 
Biostatistics and Statistical Bioinformatics
Biostatistics and Statistical BioinformaticsBiostatistics and Statistical Bioinformatics
Biostatistics and Statistical Bioinformatics
 
Introduction to Statistics
Introduction to StatisticsIntroduction to Statistics
Introduction to Statistics
 
Introduction to biostatistics
Introduction to biostatisticsIntroduction to biostatistics
Introduction to biostatistics
 
Meaning of statistics
Meaning of statisticsMeaning of statistics
Meaning of statistics
 
Research methods and biostatistics
Research methods and biostatisticsResearch methods and biostatistics
Research methods and biostatistics
 
Analysing qualitative data from information organizations
Analysing qualitative data from information organizationsAnalysing qualitative data from information organizations
Analysing qualitative data from information organizations
 
Chapter 1 introduction to statistics
Chapter 1 introduction to statisticsChapter 1 introduction to statistics
Chapter 1 introduction to statistics
 
Power, Effect Sizes, Confidence Intervals, & Academic Integrity
Power, Effect Sizes, Confidence Intervals, & Academic IntegrityPower, Effect Sizes, Confidence Intervals, & Academic Integrity
Power, Effect Sizes, Confidence Intervals, & Academic Integrity
 
Biostatistics ppt
Biostatistics  pptBiostatistics  ppt
Biostatistics ppt
 
Biostatistics
BiostatisticsBiostatistics
Biostatistics
 

Similar to Statistics and data analysis

introduction to statistical theory
introduction to statistical theoryintroduction to statistical theory
introduction to statistical theoryUnsa Shakir
 
IDS-Unit-II. bachelor of computer applicatio notes
IDS-Unit-II. bachelor of computer applicatio notesIDS-Unit-II. bachelor of computer applicatio notes
IDS-Unit-II. bachelor of computer applicatio notesAnkurTiwari813070
 
Statistics of engineer’s with basic concepts in statistics
Statistics of engineer’s with basic concepts in statisticsStatistics of engineer’s with basic concepts in statistics
Statistics of engineer’s with basic concepts in statisticsJava267874
 
Chapter-one.pptx
Chapter-one.pptxChapter-one.pptx
Chapter-one.pptxAbebeNega
 
Common Statistical Terms - Biostatistics - Ravinandan A P.pdf
Common Statistical Terms - Biostatistics - Ravinandan A P.pdfCommon Statistical Terms - Biostatistics - Ravinandan A P.pdf
Common Statistical Terms - Biostatistics - Ravinandan A P.pdfRavinandan A P
 
INTRODUCTION TO STATISTICS.pptx
INTRODUCTION TO STATISTICS.pptxINTRODUCTION TO STATISTICS.pptx
INTRODUCTION TO STATISTICS.pptxAvilosErgelaKram
 
Intro_BiostatPG.ppt
Intro_BiostatPG.pptIntro_BiostatPG.ppt
Intro_BiostatPG.pptvictor431494
 
Research Methodology.pptx
Research Methodology.pptxResearch Methodology.pptx
Research Methodology.pptxImranJewel2
 
COM 201_Inferential Statistics_18032022.pptx
COM 201_Inferential Statistics_18032022.pptxCOM 201_Inferential Statistics_18032022.pptx
COM 201_Inferential Statistics_18032022.pptxAkinsolaAyomidotun
 
Stastistics in Physical Education - SMK.pptx
Stastistics in Physical Education - SMK.pptxStastistics in Physical Education - SMK.pptx
Stastistics in Physical Education - SMK.pptxshatrunjaykote
 
Statistics for Data Analytics
Statistics for Data AnalyticsStatistics for Data Analytics
Statistics for Data AnalyticsSSaudia
 
Research and Data Analysi-1.pptx
Research and Data Analysi-1.pptxResearch and Data Analysi-1.pptx
Research and Data Analysi-1.pptxMaryamManzoor25
 
Lect 1_Biostat.pdf
Lect 1_Biostat.pdfLect 1_Biostat.pdf
Lect 1_Biostat.pdfBirhanTesema
 

Similar to Statistics and data analysis (20)

introduction to statistical theory
introduction to statistical theoryintroduction to statistical theory
introduction to statistical theory
 
stat.pptx
stat.pptxstat.pptx
stat.pptx
 
IDS-Unit-II. bachelor of computer applicatio notes
IDS-Unit-II. bachelor of computer applicatio notesIDS-Unit-II. bachelor of computer applicatio notes
IDS-Unit-II. bachelor of computer applicatio notes
 
Statistics of engineer’s with basic concepts in statistics
Statistics of engineer’s with basic concepts in statisticsStatistics of engineer’s with basic concepts in statistics
Statistics of engineer’s with basic concepts in statistics
 
Chapter-one.pptx
Chapter-one.pptxChapter-one.pptx
Chapter-one.pptx
 
Common Statistical Terms - Biostatistics - Ravinandan A P.pdf
Common Statistical Terms - Biostatistics - Ravinandan A P.pdfCommon Statistical Terms - Biostatistics - Ravinandan A P.pdf
Common Statistical Terms - Biostatistics - Ravinandan A P.pdf
 
CHAPONE edited Stat.pptx
CHAPONE edited Stat.pptxCHAPONE edited Stat.pptx
CHAPONE edited Stat.pptx
 
INTRODUCTION TO STATISTICS.pptx
INTRODUCTION TO STATISTICS.pptxINTRODUCTION TO STATISTICS.pptx
INTRODUCTION TO STATISTICS.pptx
 
SAMPLING Theory.ppt
SAMPLING Theory.pptSAMPLING Theory.ppt
SAMPLING Theory.ppt
 
Intro_BiostatPG.ppt
Intro_BiostatPG.pptIntro_BiostatPG.ppt
Intro_BiostatPG.ppt
 
Research Methodology.pptx
Research Methodology.pptxResearch Methodology.pptx
Research Methodology.pptx
 
COM 201_Inferential Statistics_18032022.pptx
COM 201_Inferential Statistics_18032022.pptxCOM 201_Inferential Statistics_18032022.pptx
COM 201_Inferential Statistics_18032022.pptx
 
Stastistics in Physical Education - SMK.pptx
Stastistics in Physical Education - SMK.pptxStastistics in Physical Education - SMK.pptx
Stastistics in Physical Education - SMK.pptx
 
STATISTICS-E.pdf
STATISTICS-E.pdfSTATISTICS-E.pdf
STATISTICS-E.pdf
 
Biostatistics
Biostatistics Biostatistics
Biostatistics
 
Statistics for Data Analytics
Statistics for Data AnalyticsStatistics for Data Analytics
Statistics for Data Analytics
 
Research and Data Analysi-1.pptx
Research and Data Analysi-1.pptxResearch and Data Analysi-1.pptx
Research and Data Analysi-1.pptx
 
Statistics
StatisticsStatistics
Statistics
 
Lect 1_Biostat.pdf
Lect 1_Biostat.pdfLect 1_Biostat.pdf
Lect 1_Biostat.pdf
 
Introduction.pdf
Introduction.pdfIntroduction.pdf
Introduction.pdf
 

More from Regent University

EYEWITNESS TESTIMONY.ppt criminal psychol
EYEWITNESS TESTIMONY.ppt criminal psycholEYEWITNESS TESTIMONY.ppt criminal psychol
EYEWITNESS TESTIMONY.ppt criminal psycholRegent University
 
Interviewing Suspects in Criminal Cases.ppt
Interviewing Suspects in Criminal Cases.pptInterviewing Suspects in Criminal Cases.ppt
Interviewing Suspects in Criminal Cases.pptRegent University
 
DETECTING DECEPTION.ppt psychology crimi
DETECTING DECEPTION.ppt psychology crimiDETECTING DECEPTION.ppt psychology crimi
DETECTING DECEPTION.ppt psychology crimiRegent University
 
MedicalResearcher.edited.docx in Sweden,
MedicalResearcher.edited.docx in Sweden,MedicalResearcher.edited.docx in Sweden,
MedicalResearcher.edited.docx in Sweden,Regent University
 
Policing.ppt criminal psychology in introduction
Policing.ppt criminal psychology in introductionPolicing.ppt criminal psychology in introduction
Policing.ppt criminal psychology in introductionRegent University
 
Offender Profiling and Linking Crime.ppt
Offender Profiling and Linking Crime.pptOffender Profiling and Linking Crime.ppt
Offender Profiling and Linking Crime.pptRegent University
 
Definitions and Historical Background.ppt
Definitions and Historical Background.pptDefinitions and Historical Background.ppt
Definitions and Historical Background.pptRegent University
 
Zero State Theorem of Medical Science.ppt
Zero State Theorem of Medical Science.pptZero State Theorem of Medical Science.ppt
Zero State Theorem of Medical Science.pptRegent University
 
Swedish Prisons Presentation1.ppt
Swedish Prisons Presentation1.pptSwedish Prisons Presentation1.ppt
Swedish Prisons Presentation1.pptRegent University
 
Three Fundamental Theorems in Medicine
Three Fundamental Theorems in MedicineThree Fundamental Theorems in Medicine
Three Fundamental Theorems in MedicineRegent University
 
Ancient Egyptians,Ancient Persians
Ancient Egyptians,Ancient Persians Ancient Egyptians,Ancient Persians
Ancient Egyptians,Ancient Persians Regent University
 
Historical Data on Prof. Desmond Ayim-Aboagye
Historical Data on Prof. Desmond Ayim-AboagyeHistorical Data on Prof. Desmond Ayim-Aboagye
Historical Data on Prof. Desmond Ayim-AboagyeRegent University
 
Biography of desmond ayim aboagye cur
Biography of desmond ayim aboagye curBiography of desmond ayim aboagye cur
Biography of desmond ayim aboagye curRegent University
 
Biography of desmond ayim aboagye
Biography of desmond ayim aboagyeBiography of desmond ayim aboagye
Biography of desmond ayim aboagyeRegent University
 
Biography of desmond ayim aboagye
Biography of desmond ayim aboagyeBiography of desmond ayim aboagye
Biography of desmond ayim aboagyeRegent University
 
Biography of desmond ayim aboagye
Biography of desmond ayim aboagyeBiography of desmond ayim aboagye
Biography of desmond ayim aboagyeRegent University
 
Professor ayim aboagye's profile
Professor ayim aboagye's profileProfessor ayim aboagye's profile
Professor ayim aboagye's profileRegent University
 
Biography of desmond ayim aboagye
Biography of desmond ayim aboagyeBiography of desmond ayim aboagye
Biography of desmond ayim aboagyeRegent University
 

More from Regent University (20)

EYEWITNESS TESTIMONY.ppt criminal psychol
EYEWITNESS TESTIMONY.ppt criminal psycholEYEWITNESS TESTIMONY.ppt criminal psychol
EYEWITNESS TESTIMONY.ppt criminal psychol
 
Interviewing Suspects in Criminal Cases.ppt
Interviewing Suspects in Criminal Cases.pptInterviewing Suspects in Criminal Cases.ppt
Interviewing Suspects in Criminal Cases.ppt
 
DETECTING DECEPTION.ppt psychology crimi
DETECTING DECEPTION.ppt psychology crimiDETECTING DECEPTION.ppt psychology crimi
DETECTING DECEPTION.ppt psychology crimi
 
MedicalResearcher.edited.docx in Sweden,
MedicalResearcher.edited.docx in Sweden,MedicalResearcher.edited.docx in Sweden,
MedicalResearcher.edited.docx in Sweden,
 
Policing.ppt criminal psychology in introduction
Policing.ppt criminal psychology in introductionPolicing.ppt criminal psychology in introduction
Policing.ppt criminal psychology in introduction
 
Offender Profiling and Linking Crime.ppt
Offender Profiling and Linking Crime.pptOffender Profiling and Linking Crime.ppt
Offender Profiling and Linking Crime.ppt
 
Definitions and Historical Background.ppt
Definitions and Historical Background.pptDefinitions and Historical Background.ppt
Definitions and Historical Background.ppt
 
Zero State Theorem of Medical Science.ppt
Zero State Theorem of Medical Science.pptZero State Theorem of Medical Science.ppt
Zero State Theorem of Medical Science.ppt
 
Swedish Prisons Presentation1.ppt
Swedish Prisons Presentation1.pptSwedish Prisons Presentation1.ppt
Swedish Prisons Presentation1.ppt
 
What about the 80% (Farmers)
What about the 80% (Farmers)What about the 80% (Farmers)
What about the 80% (Farmers)
 
Theorems in Medicine
Theorems in MedicineTheorems in Medicine
Theorems in Medicine
 
Three Fundamental Theorems in Medicine
Three Fundamental Theorems in MedicineThree Fundamental Theorems in Medicine
Three Fundamental Theorems in Medicine
 
Ancient Egyptians,Ancient Persians
Ancient Egyptians,Ancient Persians Ancient Egyptians,Ancient Persians
Ancient Egyptians,Ancient Persians
 
Historical Data on Prof. Desmond Ayim-Aboagye
Historical Data on Prof. Desmond Ayim-AboagyeHistorical Data on Prof. Desmond Ayim-Aboagye
Historical Data on Prof. Desmond Ayim-Aboagye
 
Biography of desmond ayim aboagye cur
Biography of desmond ayim aboagye curBiography of desmond ayim aboagye cur
Biography of desmond ayim aboagye cur
 
Biography of desmond ayim aboagye
Biography of desmond ayim aboagyeBiography of desmond ayim aboagye
Biography of desmond ayim aboagye
 
Biography of desmond ayim aboagye
Biography of desmond ayim aboagyeBiography of desmond ayim aboagye
Biography of desmond ayim aboagye
 
Biography of desmond ayim aboagye
Biography of desmond ayim aboagyeBiography of desmond ayim aboagye
Biography of desmond ayim aboagye
 
Professor ayim aboagye's profile
Professor ayim aboagye's profileProfessor ayim aboagye's profile
Professor ayim aboagye's profile
 
Biography of desmond ayim aboagye
Biography of desmond ayim aboagyeBiography of desmond ayim aboagye
Biography of desmond ayim aboagye
 

Recently uploaded

Russian Escort Service in Delhi 11k Hotel Foreigner Russian Call Girls in Delhi
Russian Escort Service in Delhi 11k Hotel Foreigner Russian Call Girls in DelhiRussian Escort Service in Delhi 11k Hotel Foreigner Russian Call Girls in Delhi
Russian Escort Service in Delhi 11k Hotel Foreigner Russian Call Girls in Delhikauryashika82
 
The basics of sentences session 2pptx copy.pptx
The basics of sentences session 2pptx copy.pptxThe basics of sentences session 2pptx copy.pptx
The basics of sentences session 2pptx copy.pptxheathfieldcps1
 
Grant Readiness 101 TechSoup and Remy Consulting
Grant Readiness 101 TechSoup and Remy ConsultingGrant Readiness 101 TechSoup and Remy Consulting
Grant Readiness 101 TechSoup and Remy ConsultingTechSoup
 
Making and Justifying Mathematical Decisions.pdf
Making and Justifying Mathematical Decisions.pdfMaking and Justifying Mathematical Decisions.pdf
Making and Justifying Mathematical Decisions.pdfChris Hunter
 
Key note speaker Neum_Admir Softic_ENG.pdf
Key note speaker Neum_Admir Softic_ENG.pdfKey note speaker Neum_Admir Softic_ENG.pdf
Key note speaker Neum_Admir Softic_ENG.pdfAdmir Softic
 
Z Score,T Score, Percential Rank and Box Plot Graph
Z Score,T Score, Percential Rank and Box Plot GraphZ Score,T Score, Percential Rank and Box Plot Graph
Z Score,T Score, Percential Rank and Box Plot GraphThiyagu K
 
Sociology 101 Demonstration of Learning Exhibit
Sociology 101 Demonstration of Learning ExhibitSociology 101 Demonstration of Learning Exhibit
Sociology 101 Demonstration of Learning Exhibitjbellavia9
 
Beyond the EU: DORA and NIS 2 Directive's Global Impact
Beyond the EU: DORA and NIS 2 Directive's Global ImpactBeyond the EU: DORA and NIS 2 Directive's Global Impact
Beyond the EU: DORA and NIS 2 Directive's Global ImpactPECB
 
PROCESS RECORDING FORMAT.docx
PROCESS      RECORDING        FORMAT.docxPROCESS      RECORDING        FORMAT.docx
PROCESS RECORDING FORMAT.docxPoojaSen20
 
Advanced Views - Calendar View in Odoo 17
Advanced Views - Calendar View in Odoo 17Advanced Views - Calendar View in Odoo 17
Advanced Views - Calendar View in Odoo 17Celine George
 
Seal of Good Local Governance (SGLG) 2024Final.pptx
Seal of Good Local Governance (SGLG) 2024Final.pptxSeal of Good Local Governance (SGLG) 2024Final.pptx
Seal of Good Local Governance (SGLG) 2024Final.pptxnegromaestrong
 
ComPTIA Overview | Comptia Security+ Book SY0-701
ComPTIA Overview | Comptia Security+ Book SY0-701ComPTIA Overview | Comptia Security+ Book SY0-701
ComPTIA Overview | Comptia Security+ Book SY0-701bronxfugly43
 
Introduction to Nonprofit Accounting: The Basics
Introduction to Nonprofit Accounting: The BasicsIntroduction to Nonprofit Accounting: The Basics
Introduction to Nonprofit Accounting: The BasicsTechSoup
 
Explore beautiful and ugly buildings. Mathematics helps us create beautiful d...
Explore beautiful and ugly buildings. Mathematics helps us create beautiful d...Explore beautiful and ugly buildings. Mathematics helps us create beautiful d...
Explore beautiful and ugly buildings. Mathematics helps us create beautiful d...christianmathematics
 
Mixin Classes in Odoo 17 How to Extend Models Using Mixin Classes
Mixin Classes in Odoo 17  How to Extend Models Using Mixin ClassesMixin Classes in Odoo 17  How to Extend Models Using Mixin Classes
Mixin Classes in Odoo 17 How to Extend Models Using Mixin ClassesCeline George
 
Micro-Scholarship, What it is, How can it help me.pdf
Micro-Scholarship, What it is, How can it help me.pdfMicro-Scholarship, What it is, How can it help me.pdf
Micro-Scholarship, What it is, How can it help me.pdfPoh-Sun Goh
 
2024-NATIONAL-LEARNING-CAMP-AND-OTHER.pptx
2024-NATIONAL-LEARNING-CAMP-AND-OTHER.pptx2024-NATIONAL-LEARNING-CAMP-AND-OTHER.pptx
2024-NATIONAL-LEARNING-CAMP-AND-OTHER.pptxMaritesTamaniVerdade
 

Recently uploaded (20)

Mehran University Newsletter Vol-X, Issue-I, 2024
Mehran University Newsletter Vol-X, Issue-I, 2024Mehran University Newsletter Vol-X, Issue-I, 2024
Mehran University Newsletter Vol-X, Issue-I, 2024
 
Russian Escort Service in Delhi 11k Hotel Foreigner Russian Call Girls in Delhi
Russian Escort Service in Delhi 11k Hotel Foreigner Russian Call Girls in DelhiRussian Escort Service in Delhi 11k Hotel Foreigner Russian Call Girls in Delhi
Russian Escort Service in Delhi 11k Hotel Foreigner Russian Call Girls in Delhi
 
The basics of sentences session 2pptx copy.pptx
The basics of sentences session 2pptx copy.pptxThe basics of sentences session 2pptx copy.pptx
The basics of sentences session 2pptx copy.pptx
 
Asian American Pacific Islander Month DDSD 2024.pptx
Asian American Pacific Islander Month DDSD 2024.pptxAsian American Pacific Islander Month DDSD 2024.pptx
Asian American Pacific Islander Month DDSD 2024.pptx
 
Grant Readiness 101 TechSoup and Remy Consulting
Grant Readiness 101 TechSoup and Remy ConsultingGrant Readiness 101 TechSoup and Remy Consulting
Grant Readiness 101 TechSoup and Remy Consulting
 
Making and Justifying Mathematical Decisions.pdf
Making and Justifying Mathematical Decisions.pdfMaking and Justifying Mathematical Decisions.pdf
Making and Justifying Mathematical Decisions.pdf
 
Key note speaker Neum_Admir Softic_ENG.pdf
Key note speaker Neum_Admir Softic_ENG.pdfKey note speaker Neum_Admir Softic_ENG.pdf
Key note speaker Neum_Admir Softic_ENG.pdf
 
Z Score,T Score, Percential Rank and Box Plot Graph
Z Score,T Score, Percential Rank and Box Plot GraphZ Score,T Score, Percential Rank and Box Plot Graph
Z Score,T Score, Percential Rank and Box Plot Graph
 
Sociology 101 Demonstration of Learning Exhibit
Sociology 101 Demonstration of Learning ExhibitSociology 101 Demonstration of Learning Exhibit
Sociology 101 Demonstration of Learning Exhibit
 
Beyond the EU: DORA and NIS 2 Directive's Global Impact
Beyond the EU: DORA and NIS 2 Directive's Global ImpactBeyond the EU: DORA and NIS 2 Directive's Global Impact
Beyond the EU: DORA and NIS 2 Directive's Global Impact
 
PROCESS RECORDING FORMAT.docx
PROCESS      RECORDING        FORMAT.docxPROCESS      RECORDING        FORMAT.docx
PROCESS RECORDING FORMAT.docx
 
Advanced Views - Calendar View in Odoo 17
Advanced Views - Calendar View in Odoo 17Advanced Views - Calendar View in Odoo 17
Advanced Views - Calendar View in Odoo 17
 
Seal of Good Local Governance (SGLG) 2024Final.pptx
Seal of Good Local Governance (SGLG) 2024Final.pptxSeal of Good Local Governance (SGLG) 2024Final.pptx
Seal of Good Local Governance (SGLG) 2024Final.pptx
 
ComPTIA Overview | Comptia Security+ Book SY0-701
ComPTIA Overview | Comptia Security+ Book SY0-701ComPTIA Overview | Comptia Security+ Book SY0-701
ComPTIA Overview | Comptia Security+ Book SY0-701
 
Introduction to Nonprofit Accounting: The Basics
Introduction to Nonprofit Accounting: The BasicsIntroduction to Nonprofit Accounting: The Basics
Introduction to Nonprofit Accounting: The Basics
 
Explore beautiful and ugly buildings. Mathematics helps us create beautiful d...
Explore beautiful and ugly buildings. Mathematics helps us create beautiful d...Explore beautiful and ugly buildings. Mathematics helps us create beautiful d...
Explore beautiful and ugly buildings. Mathematics helps us create beautiful d...
 
INDIA QUIZ 2024 RLAC DELHI UNIVERSITY.pptx
INDIA QUIZ 2024 RLAC DELHI UNIVERSITY.pptxINDIA QUIZ 2024 RLAC DELHI UNIVERSITY.pptx
INDIA QUIZ 2024 RLAC DELHI UNIVERSITY.pptx
 
Mixin Classes in Odoo 17 How to Extend Models Using Mixin Classes
Mixin Classes in Odoo 17  How to Extend Models Using Mixin ClassesMixin Classes in Odoo 17  How to Extend Models Using Mixin Classes
Mixin Classes in Odoo 17 How to Extend Models Using Mixin Classes
 
Micro-Scholarship, What it is, How can it help me.pdf
Micro-Scholarship, What it is, How can it help me.pdfMicro-Scholarship, What it is, How can it help me.pdf
Micro-Scholarship, What it is, How can it help me.pdf
 
2024-NATIONAL-LEARNING-CAMP-AND-OTHER.pptx
2024-NATIONAL-LEARNING-CAMP-AND-OTHER.pptx2024-NATIONAL-LEARNING-CAMP-AND-OTHER.pptx
2024-NATIONAL-LEARNING-CAMP-AND-OTHER.pptx
 

Statistics and data analysis

  • 1. STATISTICS AND DATA ANALYSIS AS TOOLS FOR RESEARCHERS INTRODUCTION By Desmond Ayim-Aboagye, PhD
  • 2. THEORIES OF STATISTICS & ANALYSIS OF DATA • How to select an appropriate Statistical test • How to collect the right kinds of information for analysis • How to perform statistical calculations in a straightforward, step by step manner. • How to accurately interpret and present statistical results. • How to be an intelligent consumer of statistical information. • How to write up analyses and results in American Psychological Association (APA) style. (Dana S. Dunn, 2001)
  • 3. A Statistic • A statistic is some piece of information that is presented in numerical form. For example, a nation’s 5% unemployment rate is a statistic, and so is the average number of words per minute read by a group of second-grades or the reported high temperature on july day in June.
  • 4. Data Analysis • Data analysis refers to the systematic examination of a collection of observations. The examination can answer a question, search for a pattern, or otherwise make sense out of the observations.
  • 5. Statistic and Data Analysis • Statistic and data analysis are complementary, but not equivalent terms. • Example: Quantitative and Qualitative • Quantitative relationships are numerical. • Qualitative relationships are based on descriptions or organizing themes, not numbers.
  • 6. A Variable • A variable is any factor that can be measured or have a different value. Such factors can vary from person to person, place to place, experimental situation to experimental situation. • Example: • a. Hair color can be a variable (blonde, brunette, redhead) • b. The day of the week • c. Weight
  • 7. A Constant • A constant is usually a number whose value does not change. • Example 𝜋 (pronounce “pie”) which equals 3.1416 • It can also refer to a characteristic pertaining to a person or environment that does not change.
  • 8. Variables and Constant • Variables take on different values • Constants do not change
  • 9. Statistics and Data Analysis • Statistics and data analysis highlight possible solutions or answers to questions, not absolute or definitive conclusions.
  • 10. Statistics and Mathematics • Statistics is not equal to mathematics (Statistics ≠ Mathematics) • Statistics is the science of data, not mathematics. • “The field of statistics is concerned with making sense out of empirical data , particularly when those data contain some element of uncertainty so that we do not know the true state of affairs, how, say a set of variables affect one another” (Dana, 2001)
  • 11. EMPIRICAL • Empirical refers to anything derived from experiences or experiment.
  • 12. Statistic, Data Analysis, & Scientific Method • Researchers in the behavioral sciences use statistics to analyze data collected within the framework of the scientific method. • The Scientific method: The scientific method guides research by identifying a problem, formulating a hypothesis, and collecting empirical data to test the hypothesis.
  • 13. A Hypothesis • A hypothesis is a testable question or prediction, one usually designed to explain some phenomenon. • Examples: • A. There is an association between the color of the skin and the continent where a person comes from. • B. Individuals who hails from broken homes tend to be criminals. • C. Children who watch violent films grow up to become aggressive individuals.
  • 14. A Theory • A theory is a collection of related facts, often derived from hypotheses and the scientific method, forming a coherent explanation for a larger phenomenon. • Examples: • A. The Theory of Aggression • B. The Theory of Cognitive Dissonance (Leon Festinger) • C. The life Cycle Theory (Erik Eriksson) • D. Operant Condition (Pavlov)
  • 15. INDUCTIVE AND DEDUCTIVE REASONING • Inductive: Genralizing from one or more observations in the course of developing a more general explanation. • Observations are used to generate theories. • Induction data lead to theory • Psychology, economics, education, sociology, and anthropology often rely on inductive reasoning (Dana, 2001: p.10 f.)
  • 16. Deductive Reasoning/method • Deductive reasoning is characterized by the use of existing theories to develop conclusions, called deductions, about how some unexamined phenomenon is likely to operate. • Theory is used to search for confirming observations (hypotheses). • Deduction: Theory leads to data
  • 19. A Population • A population is a complete set of data possessing some observable characteristic, or a theoretical set of potential observations.
  • 20. A Sample • A sample is a smaller unit or subset bearing the same characteristic or characteristics of the population of interest.
  • 21. Population Sample Figure 1.2. Samples are drawn from Population (Dana, 2001) Adequate sample describe populations accurately.
  • 22. A Population Parameter • A population parameter is a value that summarizes some important, measurable characteristic of a population. Although population parameters are estimated from statistics, they are constants. • Parameters are estimated but they do not change.
  • 23. A Sample Statistic • A sample statistic is a summary value based upon some measurable characteristic of a sample. • The value of sample statistics can vary from sample to sample. • Statistics are calculated from sample data, and they change from sample to sample. • “Although sample statistics are apt to change from sample to sample, a parameter, such as a population average, will not change.” (Dana, 2001; p. 14)
  • 24. SAMPLE RANDOM SAMPLING • Sampling random sampling is a process whereby a subset is drawn from a population in such a way that each member of the population has the same opportunity of being selected for inclusion in the subset as all the others.
  • 25. xxxxxxxxxx xxxxxxxxxx xxxxxxxxxx x Sample 1 Sample 2 Sample 3 Sample statistic 1 Sample statistic 2 Sample statistic 3 Population parameters are constants Sample statistics for different samples can vary: 1 ≠ 2, 1 ≠ 3, 2 ≠ 3. Figure 1.3. Different samples can yield different sample statistics (Dana, 2001) sampling sampling sampling
  • 26. Population Sample Sample statistics Parameters Process of inference Random sampling procedure Figure 1.4. Random sampling and the process of inference (Dana, 2001)
  • 27. Descriptive and Inferential Statistics Descriptive Statistics
  • 28. Descriptive and Inferential Statistics • Descriptive statistics are statistical procedures that describe, organize, and summarize the main characteristics of sample data. • Descriptive statistics describe samples • Inferential statistics permit generalizations to be made about populations based on sample data drawn from them. • Inferential statistics infer population characteristics.
  • 29. Population Sample Parameters Descriptive Statistics Process of inference Inference Statistics Random Sampling procedure Descriptive statistics describe the sample Inferential statistics infer population characteristics from sample data Fig. 1.6 Descriptive statistics describe a sample. Inferential statistics infer population characteristics
  • 30. Discontinuous and Continuous Variables • A discontinuous variable is countable, and it has gaps between each number where no intermediate values can occur (discrete variables) • Examples: • Participants response e.g 1 = yes, 2 = no, 3 = other • Description, eg 1 = first year, 2 = sophomore, 3 = junior, 4 = senior, 5 = other • A continuous variable can take on any numerical value on a scale, and there exists an infinite number of values between any two numbers on a scale. • Examples: • GPA 4.0 = A, 3.67 = B+ etc
  • 31. True limit • True limits are a range of values within which a true value for some variable is contained. • True limits are calculated by taking the value of a continuous variable and then adding and subtracting one half of the unit of measurement from it. • True limits are sometimes called real limits. • True limit delineate a range of values where a true value of some variable is presumably located. • Lower true limit– Upper true limit
  • 32. Figure 1.7 True limits and different levels of precision for hypothetical weight (Dana, 2001) Bathroo m scale weight 157 158 159 160 Observed weight 157.5 158.5 True limits