Download to read offline


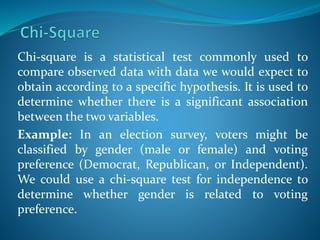
![Representative of the population
A good sample
Large in size [30+]
Represent all the parts
M1
M0
As M1 approaches M0, estimate is better
Population Parameter
Sample Statistic](https://image.slidesharecdn.com/empiricalresearch-200316114656/85/Empirical-research-Statistics-5-320.jpg)
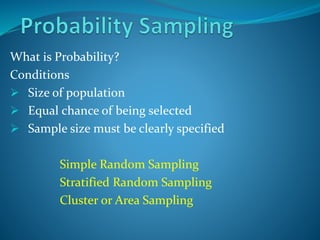


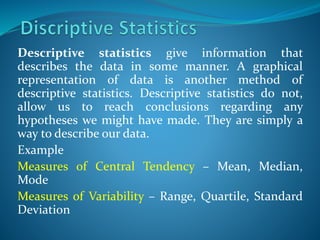


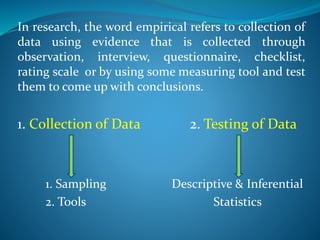
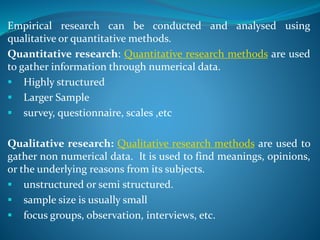
The document discusses empirical research methods, detailing data collection techniques like observation and questionnaires, and distinguishes between quantitative and qualitative research. It covers sampling techniques, descriptive and inferential statistics, and tests such as t-tests and chi-square for analyzing data relationships. The content emphasizes the importance of sample size and representativeness in drawing valid conclusions from research.


![BASIC CONCEPTS in STAT 1 [Autosaved].pptx](https://cdn.slidesharecdn.com/ss_thumbnails/basicconceptsinstat1autosaved-221027115944-55c11ebb-thumbnail.jpg?width=640&height=640&fit=bounds)


