This document provides an overview of common statistical tools including:
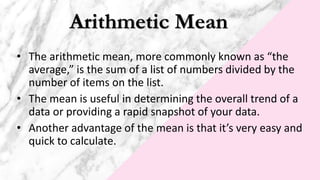
- The arithmetic mean, which is the sum of a list of numbers divided by the total number of items. It provides an overall trend of data.
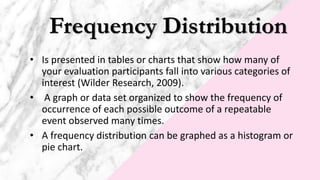
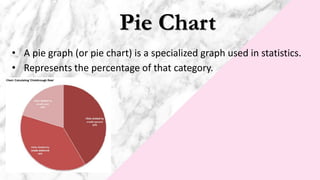
- Frequency distributions which show how many evaluations fall into various categories using tables, histograms or pie charts.
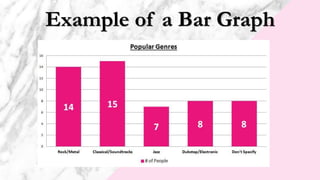
- Bar graphs which present categorical and numeric variables in class intervals through bars to show patterns.
- Standard deviation which measures how spread out numbers are from the mean. A low standard deviation means numbers align with the mean.
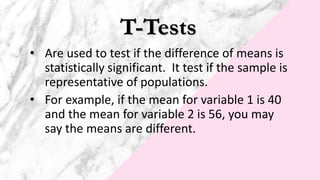
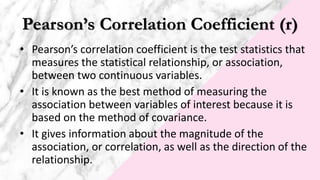
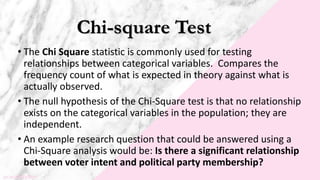
- T-tests and Pearson's correlation coefficient which measure relationships between variables, and the chi-square test which compares expected to observed categorical variable frequencies.