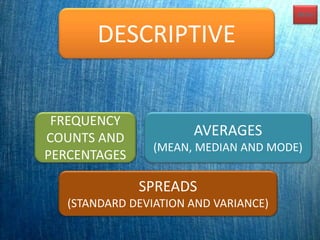
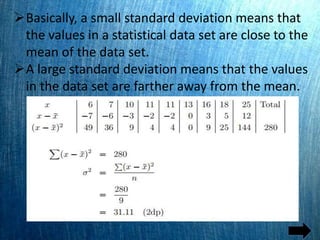
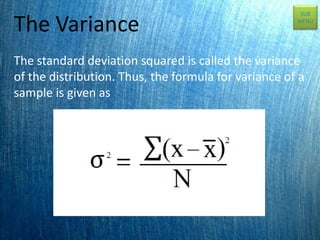
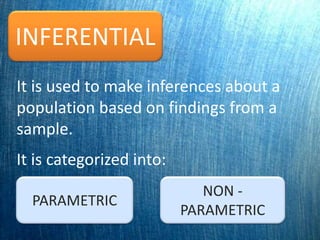
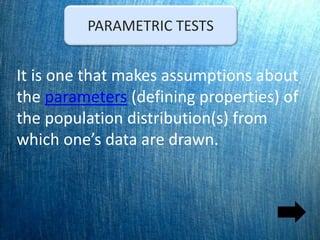
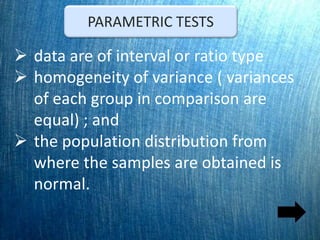
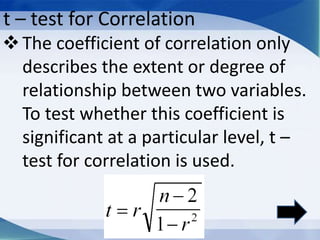
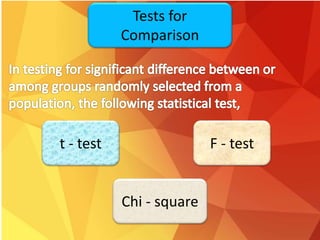
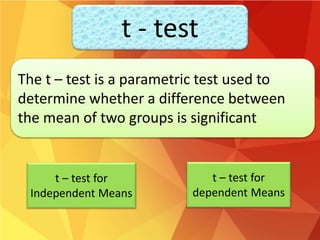
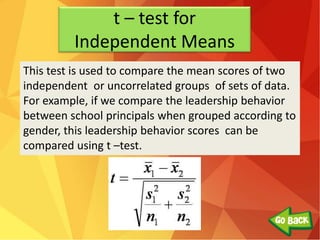
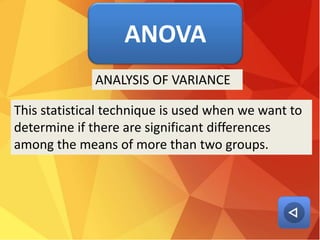
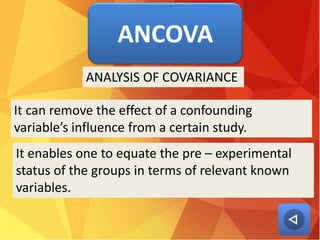
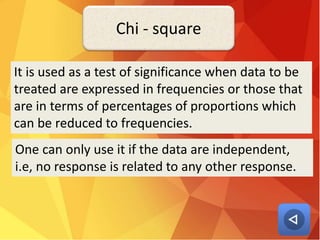
DATA PROCESSING
AND STATISTICAL
TREATMENT
DR . JAMES L. PAGLINAWAN
PROFESSOR
ADOLF OCHEA ODANI
MS MATH ED. STUDENT
LEVELS OF MEASUREMENT
Nominal
- Variables that are categorical and non numeric or where the
numbers have no sense of ordering.
Ordinal
- deals also with categorical variables like nominal level, but in this
level ordering is important.
Interval
- One unit differs by a certain amount of degree from another unit.
It does not possess an absolute zero.
Ratio Level
- The existence of the zero point is the only difference between ratio
and interval level of measurement.
INFERENTIAL
Profile questions and those that
involve mere counting and
tabulation are examples of
descriptive problems.
DESCRIPTIVE
FREQUENCY
COUNTS AND
PERCENTAGES
DESCRIPTIVE
AVERAGES
(MEAN, MEDIAN AND MODE)
SPREADS
(STANDARD DEVIATION AND VARIANCE)
MENU
FREQUENCY COUNTS AND
PERCENTAGES
 Statistical tools which are usually used to
answer profile questions and those that
involve mere counting
Results are presented using a frequency
table
YEAR LEVEL FREQUENCY PERCENTAGE
Freshman 150 27.27
Sophomore 142 25.82
Junior 133 24.18
Senior 125 22.73
Total 550 100.00
Table 10. Distribution of the respondents by year level
SUB
MENU
AVERAGES
(MEAN, MEDIAN AND MODE)
Measures that represent the typical
score in a distribution.
SUB
MENU
Which of the three average
measures of central tendency is the
best?
SPREADS
(STANDARD DEVIATION AND VARIANCE)
It is a number used to tell how measurements
for a group are spread out from the average
(mean) or expected value
Basically, a small standard deviation means that
the values in a statistical data set are close to the
mean of the data set.
A large standard deviation means that the values
in the data set are farther away from the mean.
The Variance
The standard deviation squared is called the variance
of the distribution. Thus, the formula for variance of a
sample is given as
SUB
MENU
INFERENTIAL
It is used to make inferences about a
population based on findings from a
sample.
It is categorized into:
PARAMETRIC
NON -
PARAMETRIC
PARAMETRIC TESTS
It is one that makes assumptions about
the parameters (defining properties) of
the population distribution(s) from
which one’s data are drawn.
 data are of interval or ratio type
 homogeneity of variance ( variances
of each group in comparison are
equal) ; and
 the population distribution from
where the samples are obtained is
normal.
PARAMETRIC TESTS
PARAMETRIC TESTS
Most frequently used parametric
tests are z – test, t – test, and F –
test.
A parameter is any summary number, like an
average or percentage, that describes the
entire population.
The main campus at Penn State University has a
population of approximately 42,000 students. A
research question is "what proportion of these
students smoke regularly?" A survey was administered
to a sample of 987 Penn State students. Forty-three
percent (43%) of the sampled students reported that
they smoked regularly. How confident can we be that
43% is close to the actual proportion of all Penn State
students who smoke?
• The population is all 42,000 students at Penn State
University.
• The parameter of interest is p, the proportion of
students at Penn State University who smoke regularly.
NON – PARAMETRIC TESTS
Non-parametric test is one that
makes no such assumptions
These tests are applied to both
nominal and ordinal data.
The chi – square test is the most
commonly used non – parametric
test.
CORRELATION
It is a measure of relationship between
two or more paired variables or two or
more sets of data.
The correlation coefficient which
represents the extent or degree of
relationship between two variables
may be positive, negative, or zero.
The subjects with high scores in one
variable also have high scores in the
other variable; or
The subjects with low scores in one
variable also have low scores in the
other variable.
POSITIVE CORRELATION
The subjects with high scores in one
variable have low scores in the other
variable; or
The subjects with low scores in one
variable have high scores in the
other variable.
NEGATIVE CORRELATION
When the relationship between two
sets of variables is a pure chance of
relationship, we say that there is no
correlation.
ZERO CORRELATION
INTERPRETING CORRELATION
PEARSON PRODUCT – MOMENT
CORRELATION COEFFICIENT
Pearson R is a measure of
relationship between two variables
that are usually of the interval type
of data.
Example:
Determining the relationship between students’
achievement in Math and their achievement in
Physics.
PEARSON PRODUCT – MOMENT
CORRELATION COEFFICIENT
FORMULA
SPEARMAN RANK – ORDER
CORRELATION COEFFICIENT
It is a measure of correlation
between two sets of ordinal data. It
is the most widely used among the
rank correlational techniques.
t – test for Correlation
The coefficient of correlation only
describes the extent or degree of
relationship between two variables.
To test whether this coefficient is
significant at a particular level, t –
test for correlation is used.
Tests for
Comparison
t - test F - test
Chi - square
The t – test is a parametric test used to
determine whether a difference between
the mean of two groups is significant
t – test for
Independent Means
t – test for
dependent Means
t - test
t – test for
Independent Means
This test is used to compare the mean scores of two
independent or uncorrelated groups of sets of data.
For example, if we compare the leadership behavior
between school principals when grouped according to
gender, this leadership behavior scores can be
compared using t –test.
t – test for Dependent
Means
The t – test for dependent means or correlated means
is used to compare the mean scores of the same
group before and after a treatment is given to see if
there is any observed gain, or when the research
design involves two matched groups.
F - test
ANOVA ANCOVA
ANOVA
This statistical technique is used when we want to
determine if there are significant differences
among the means of more than two groups.
ANALYSIS OF VARIANCE
ANCOVA
It can remove the effect of a confounding
variable’s influence from a certain study.
ANALYSIS OF COVARIANCE
It enables one to equate the pre – experimental
status of the groups in terms of relevant known
variables.
It is used as a test of significance when data to be
treated are expressed in frequencies or those that
are in terms of percentages of proportions which
can be reduced to frequencies.
Chi - square
One can only use it if the data are independent,
i.e, no response is related to any other response.
THANK YOU!

DATA PROCESSING AND STATISTICAL TREATMENT

  • 1.
  • 2.
    DR . JAMESL. PAGLINAWAN PROFESSOR ADOLF OCHEA ODANI MS MATH ED. STUDENT
  • 4.
    LEVELS OF MEASUREMENT Nominal -Variables that are categorical and non numeric or where the numbers have no sense of ordering. Ordinal - deals also with categorical variables like nominal level, but in this level ordering is important. Interval - One unit differs by a certain amount of degree from another unit. It does not possess an absolute zero. Ratio Level - The existence of the zero point is the only difference between ratio and interval level of measurement.
  • 5.
  • 6.
    Profile questions andthose that involve mere counting and tabulation are examples of descriptive problems. DESCRIPTIVE
  • 7.
    FREQUENCY COUNTS AND PERCENTAGES DESCRIPTIVE AVERAGES (MEAN, MEDIANAND MODE) SPREADS (STANDARD DEVIATION AND VARIANCE) MENU
  • 8.
    FREQUENCY COUNTS AND PERCENTAGES Statistical tools which are usually used to answer profile questions and those that involve mere counting Results are presented using a frequency table
  • 9.
    YEAR LEVEL FREQUENCYPERCENTAGE Freshman 150 27.27 Sophomore 142 25.82 Junior 133 24.18 Senior 125 22.73 Total 550 100.00 Table 10. Distribution of the respondents by year level SUB MENU
  • 10.
    AVERAGES (MEAN, MEDIAN ANDMODE) Measures that represent the typical score in a distribution.
  • 11.
    SUB MENU Which of thethree average measures of central tendency is the best?
  • 12.
    SPREADS (STANDARD DEVIATION ANDVARIANCE) It is a number used to tell how measurements for a group are spread out from the average (mean) or expected value
  • 13.
    Basically, a smallstandard deviation means that the values in a statistical data set are close to the mean of the data set. A large standard deviation means that the values in the data set are farther away from the mean.
  • 14.
    The Variance The standarddeviation squared is called the variance of the distribution. Thus, the formula for variance of a sample is given as SUB MENU
  • 15.
    INFERENTIAL It is usedto make inferences about a population based on findings from a sample. It is categorized into: PARAMETRIC NON - PARAMETRIC
  • 16.
    PARAMETRIC TESTS It isone that makes assumptions about the parameters (defining properties) of the population distribution(s) from which one’s data are drawn.
  • 17.
     data areof interval or ratio type  homogeneity of variance ( variances of each group in comparison are equal) ; and  the population distribution from where the samples are obtained is normal. PARAMETRIC TESTS
  • 18.
    PARAMETRIC TESTS Most frequentlyused parametric tests are z – test, t – test, and F – test.
  • 19.
    A parameter isany summary number, like an average or percentage, that describes the entire population.
  • 20.
    The main campusat Penn State University has a population of approximately 42,000 students. A research question is "what proportion of these students smoke regularly?" A survey was administered to a sample of 987 Penn State students. Forty-three percent (43%) of the sampled students reported that they smoked regularly. How confident can we be that 43% is close to the actual proportion of all Penn State students who smoke? • The population is all 42,000 students at Penn State University. • The parameter of interest is p, the proportion of students at Penn State University who smoke regularly.
  • 21.
    NON – PARAMETRICTESTS Non-parametric test is one that makes no such assumptions These tests are applied to both nominal and ordinal data. The chi – square test is the most commonly used non – parametric test.
  • 22.
  • 23.
    It is ameasure of relationship between two or more paired variables or two or more sets of data. The correlation coefficient which represents the extent or degree of relationship between two variables may be positive, negative, or zero.
  • 24.
    The subjects withhigh scores in one variable also have high scores in the other variable; or The subjects with low scores in one variable also have low scores in the other variable. POSITIVE CORRELATION
  • 25.
    The subjects withhigh scores in one variable have low scores in the other variable; or The subjects with low scores in one variable have high scores in the other variable. NEGATIVE CORRELATION
  • 26.
    When the relationshipbetween two sets of variables is a pure chance of relationship, we say that there is no correlation. ZERO CORRELATION
  • 27.
  • 28.
    PEARSON PRODUCT –MOMENT CORRELATION COEFFICIENT Pearson R is a measure of relationship between two variables that are usually of the interval type of data. Example: Determining the relationship between students’ achievement in Math and their achievement in Physics.
  • 29.
    PEARSON PRODUCT –MOMENT CORRELATION COEFFICIENT FORMULA
  • 30.
    SPEARMAN RANK –ORDER CORRELATION COEFFICIENT It is a measure of correlation between two sets of ordinal data. It is the most widely used among the rank correlational techniques.
  • 31.
    t – testfor Correlation The coefficient of correlation only describes the extent or degree of relationship between two variables. To test whether this coefficient is significant at a particular level, t – test for correlation is used.
  • 32.
    Tests for Comparison t -test F - test Chi - square
  • 33.
    The t –test is a parametric test used to determine whether a difference between the mean of two groups is significant t – test for Independent Means t – test for dependent Means t - test
  • 34.
    t – testfor Independent Means This test is used to compare the mean scores of two independent or uncorrelated groups of sets of data. For example, if we compare the leadership behavior between school principals when grouped according to gender, this leadership behavior scores can be compared using t –test.
  • 35.
    t – testfor Dependent Means The t – test for dependent means or correlated means is used to compare the mean scores of the same group before and after a treatment is given to see if there is any observed gain, or when the research design involves two matched groups.
  • 36.
  • 37.
    ANOVA This statistical techniqueis used when we want to determine if there are significant differences among the means of more than two groups. ANALYSIS OF VARIANCE
  • 38.
    ANCOVA It can removethe effect of a confounding variable’s influence from a certain study. ANALYSIS OF COVARIANCE It enables one to equate the pre – experimental status of the groups in terms of relevant known variables.
  • 39.
    It is usedas a test of significance when data to be treated are expressed in frequencies or those that are in terms of percentages of proportions which can be reduced to frequencies. Chi - square One can only use it if the data are independent, i.e, no response is related to any other response.
  • 40.