
Downloaded 36 times
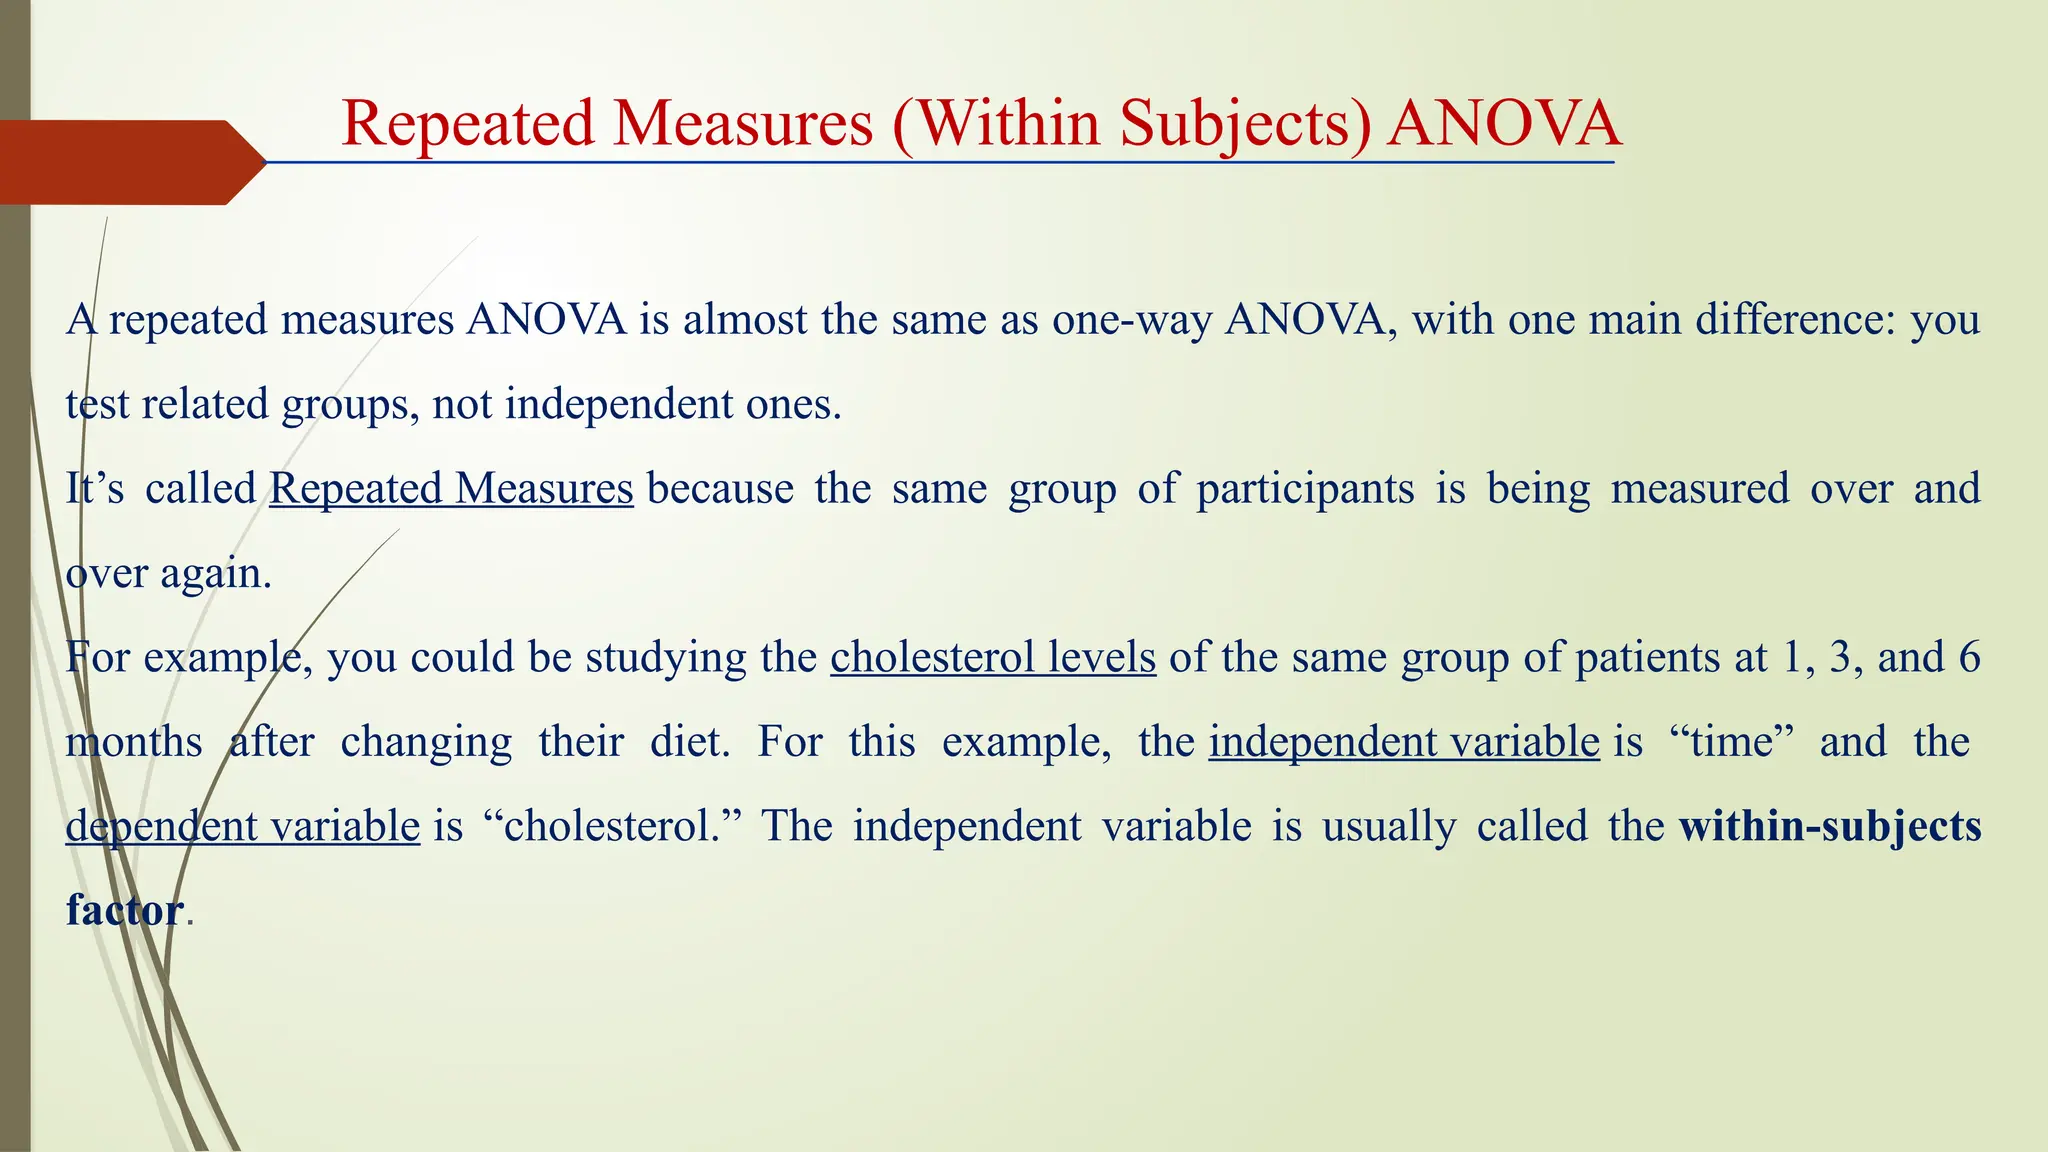
![Independent sample T-test
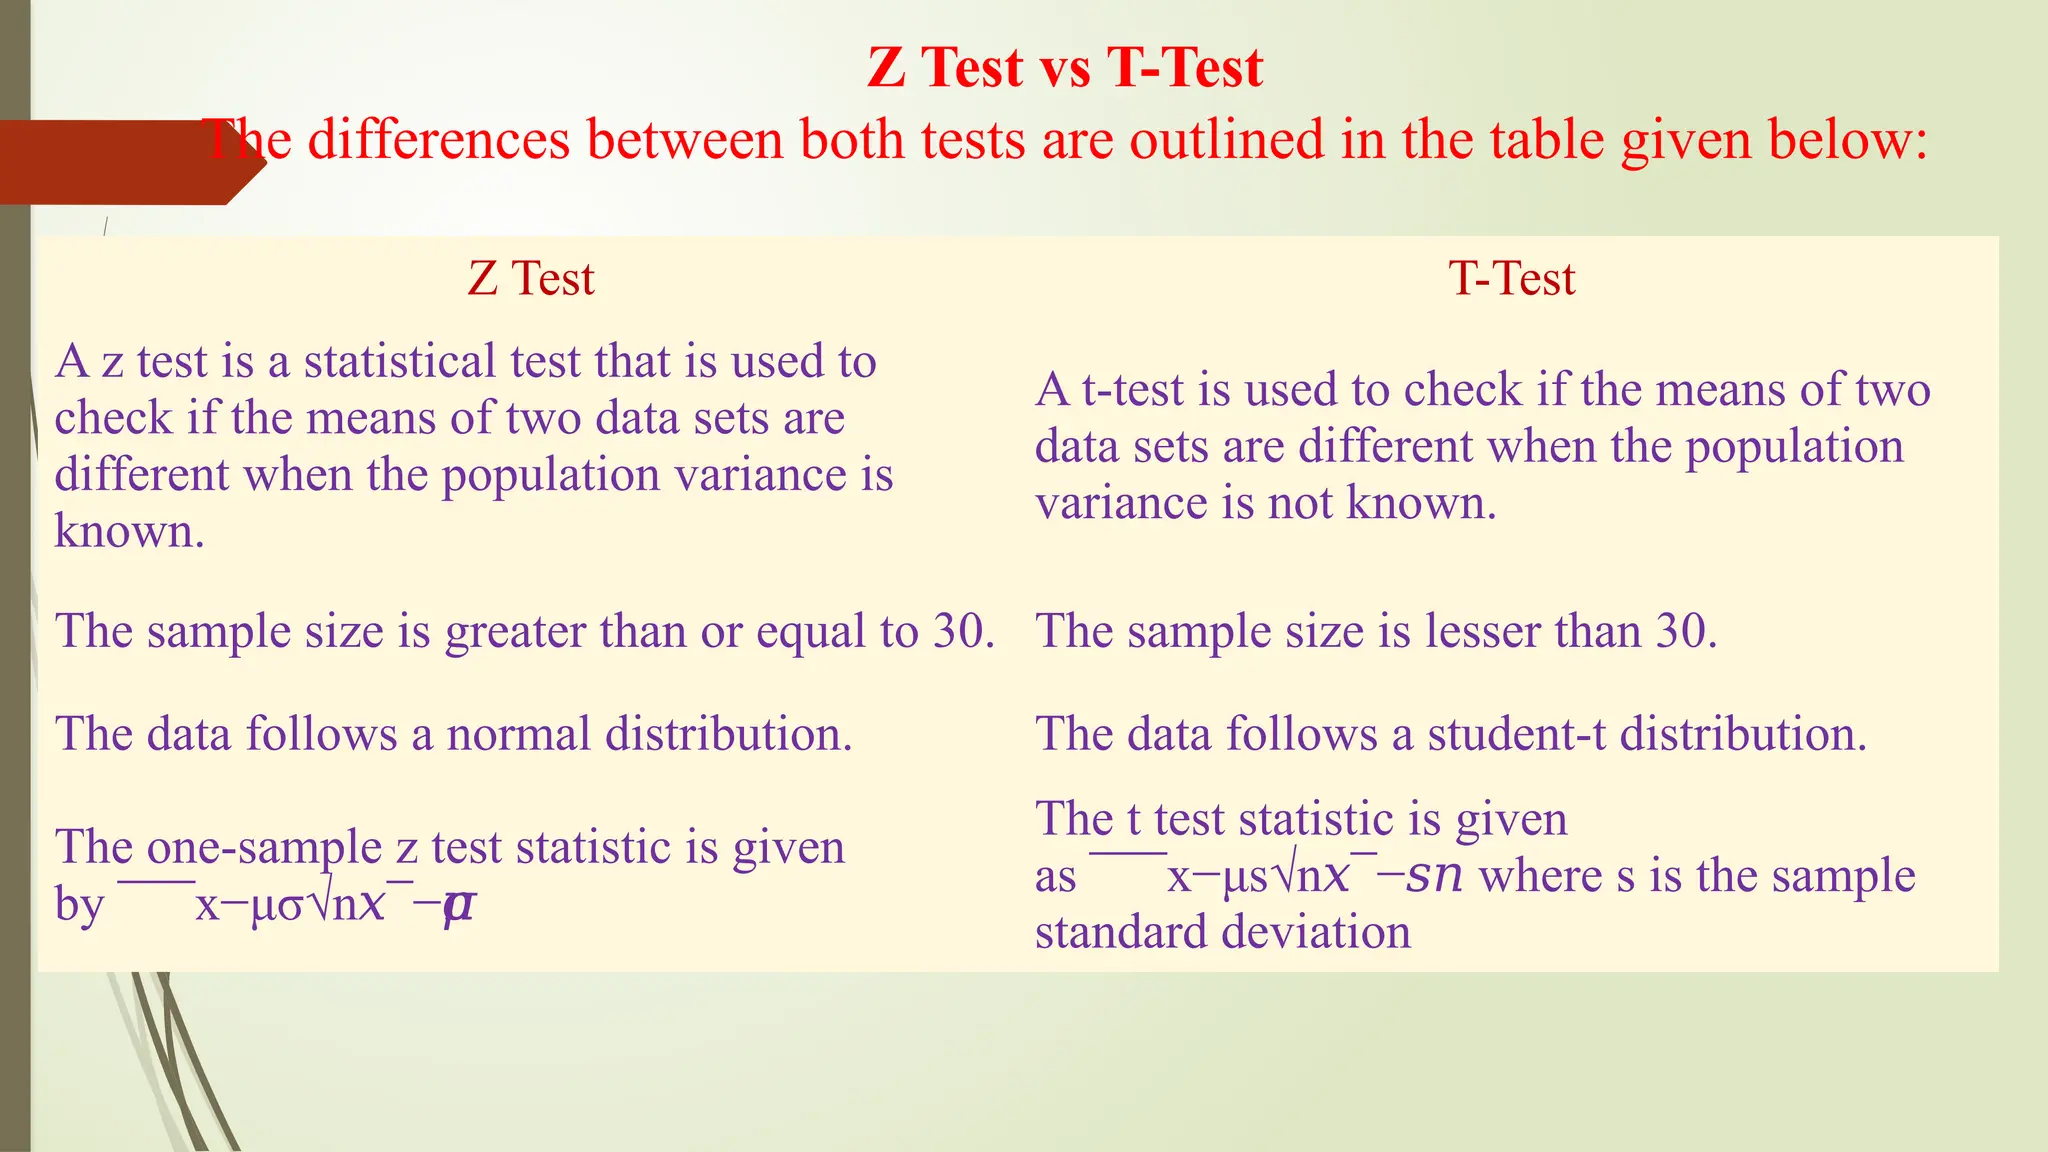
An Independent sample t-test, commonly known as an unpaired sample t-test is used to find out if the
differences found between two groups is actually significant or just a random occurrence.
We can use this when:
•the population mean or standard deviation is unknown. (information about the population is unknown)
•the two samples are separate/independent. For eg. boys and girls (the two are independent of each
other)
Paired Two-sample T-test
Paired sample t-test, commonly known as dependent sample t-test is used to find out if the difference in
the mean of two samples is 0. The test is done on dependent samples, usually focusing on a particular
group of people or things. In this, each entity is measured twice, resulting in a pair of observations.
We can use this when:
Two similar (twin like) samples are given. [Eg, Scores obtained in English and Math (both subjects)]
The dependent variable (data) is continuous.
The observations are independent of one another.
The dependent variable is approximately normally distributed](https://image.slidesharecdn.com/dataanalysis1-240918161324-5cd102b3/75/Data-Analysis-Prof-Dr-Niraj-Kumar-SGRRU-20-2048.jpg)


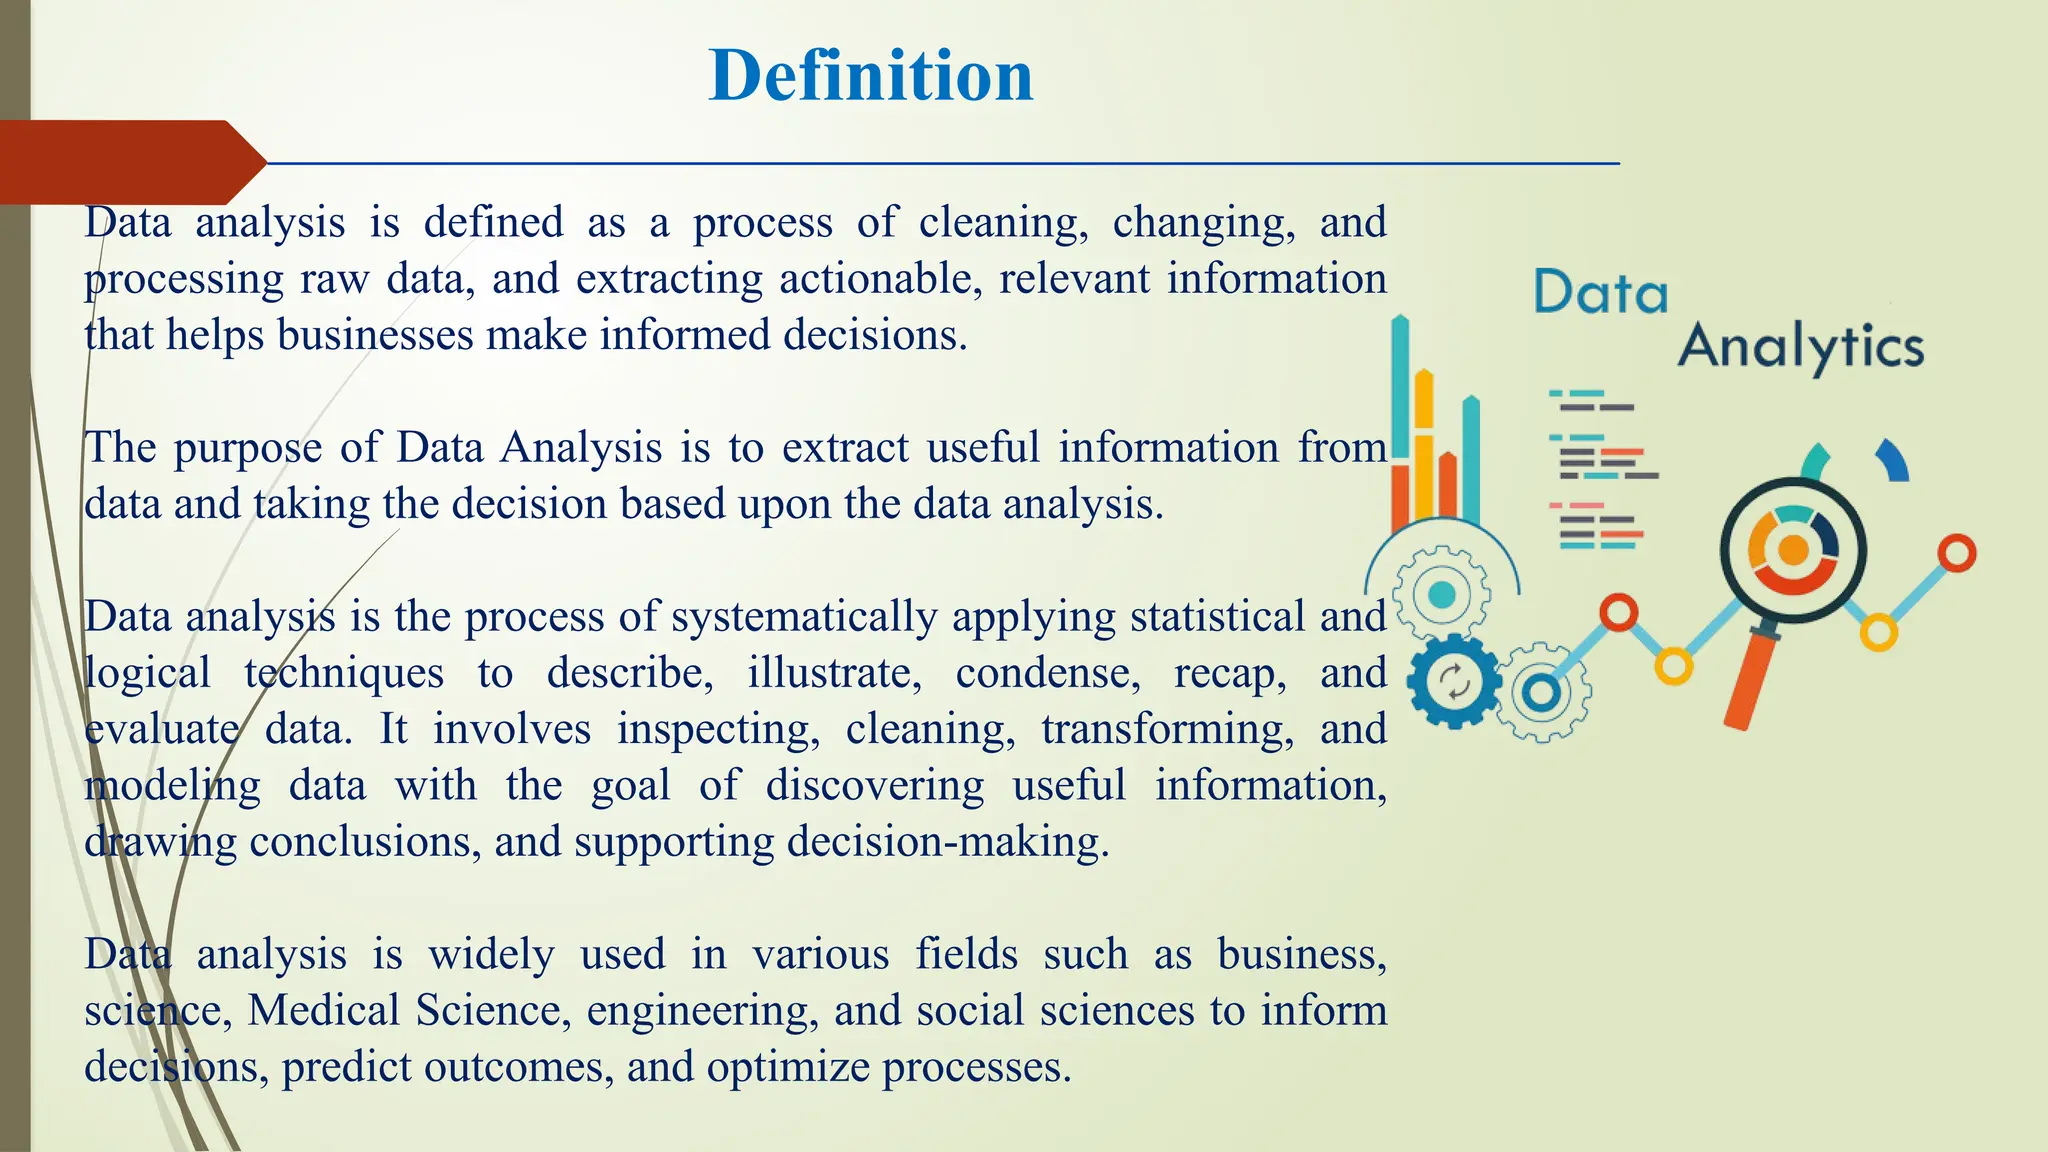
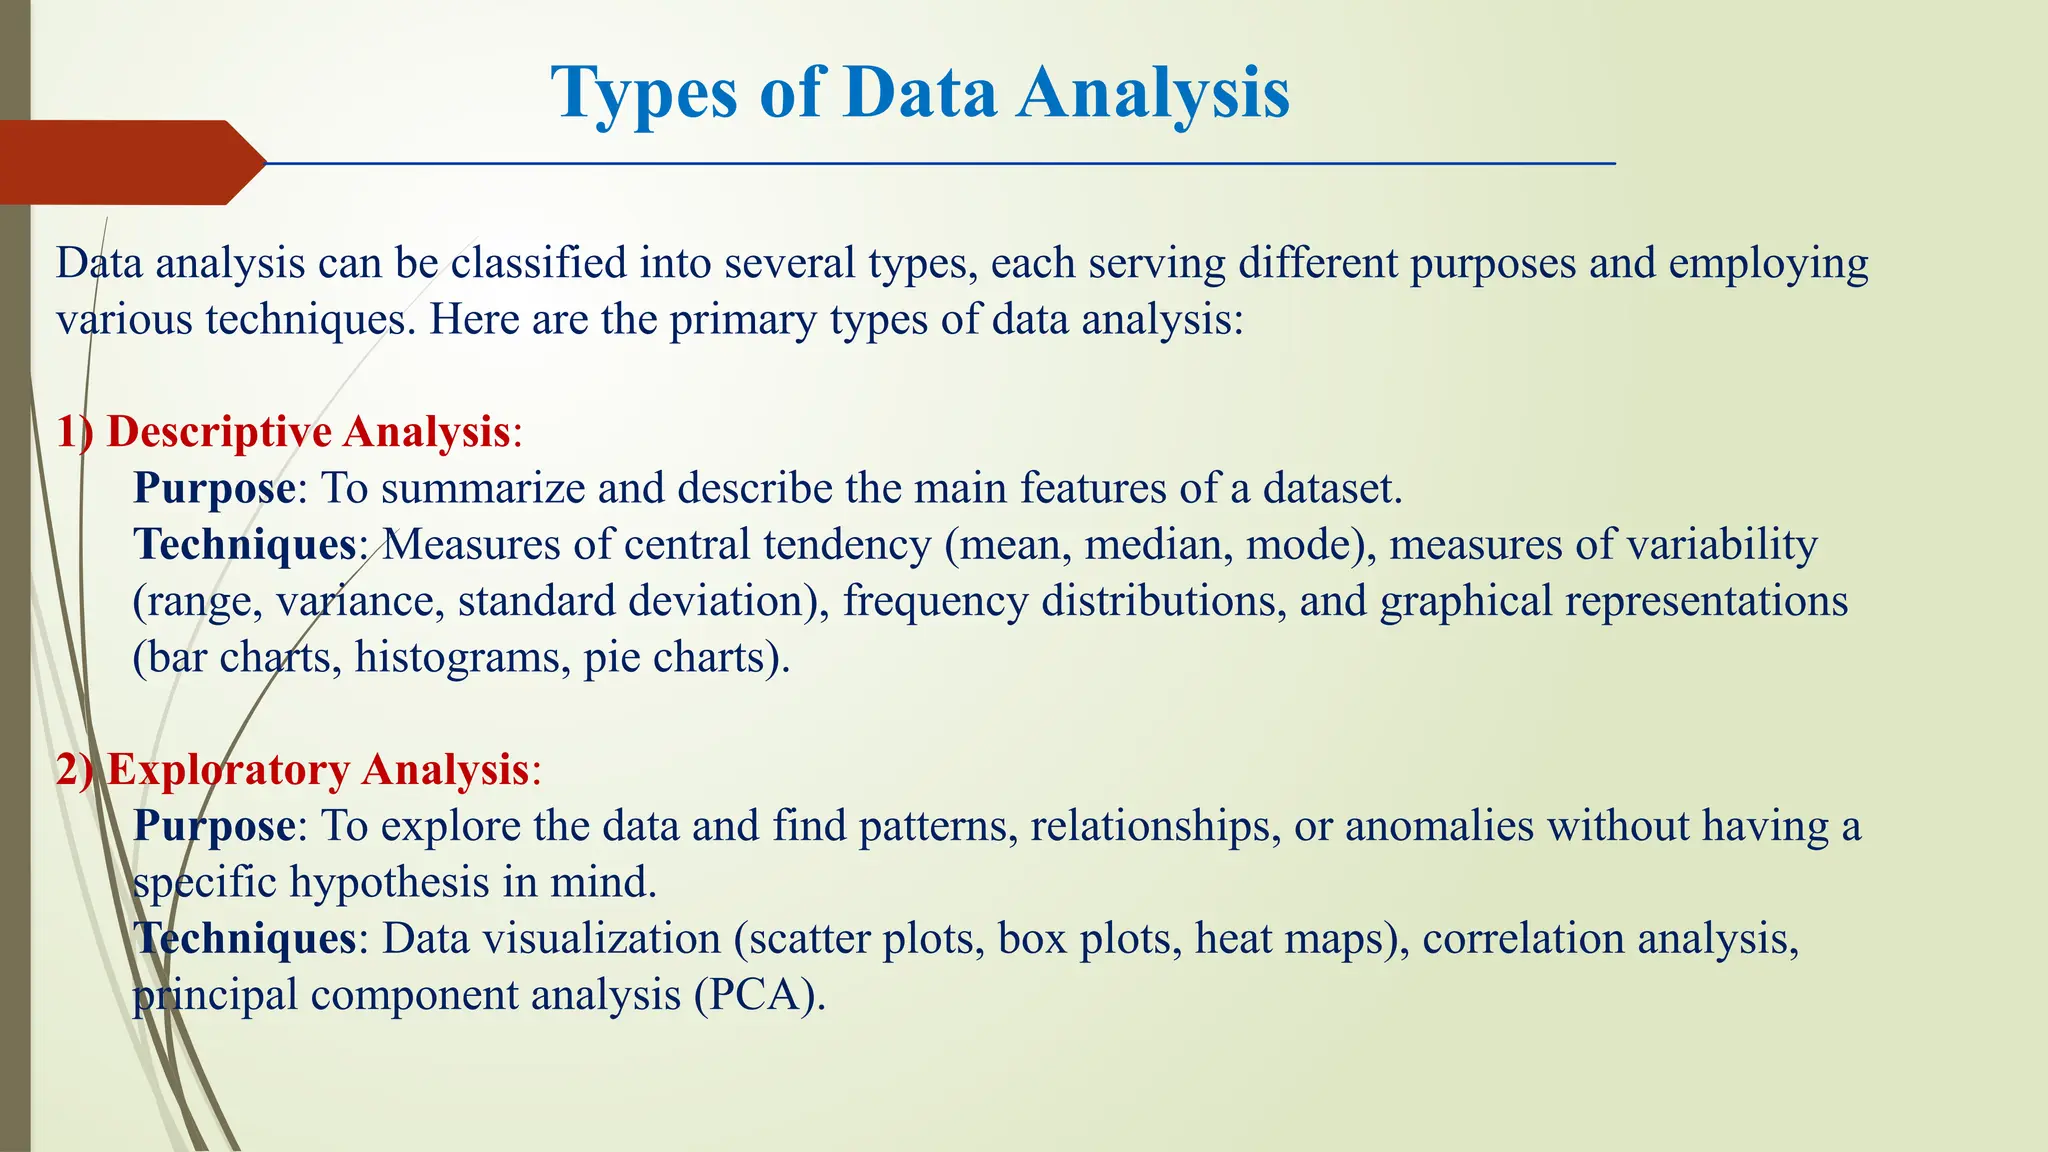
The document provides an overview of data analysis, defining it as a process that involves cleaning and processing raw data to extract actionable insights for decision-making. It categorizes various types of data analysis, such as descriptive, exploratory, inferential, predictive, prescriptive, diagnostic, and qualitative analysis, detailing methods and statistical tests like t-tests and chi-squared tests. Additionally, it discusses the significance of these methods in practical applications across different fields, emphasizing the importance of properly analyzing data to support effective decision-making.


![[DSC Europe 25] Marija Vlajkovic & Andrea Radonjanin - Integration of AI tool...](https://cdn.slidesharecdn.com/ss_thumbnails/qf1jrglttoc3bm8s3aop-final-integration-of-ai-tools-251208151905-394f3a6a-thumbnail.jpg?width=640&height=640&fit=bounds)


![[DSC Europe 25] Petar Zivanov - AI meets documents From chatbots to AI-powere...](https://cdn.slidesharecdn.com/ss_thumbnails/xer2bb6nrdc8pdpev0pc-8-251204082258-7c2fa4a1-thumbnail.jpg?width=640&height=640&fit=bounds)


![[DSC Europe 25] Max Talanov - Non digital NNs.pptx](https://cdn.slidesharecdn.com/ss_thumbnails/wif8tr3gtua74qvtopke-non-digital-nns-251205090438-26b0eea6-thumbnail.jpg?width=640&height=640&fit=bounds)


![[DSC Europe 25] Boris Perkovic - Lost in performance.pptx](https://cdn.slidesharecdn.com/ss_thumbnails/uq5hrp7vsuahqkxzifux-1-251204082258-fd2ee09d-thumbnail.jpg?width=640&height=640&fit=bounds)
![[DSC Europe 25] Goran Obradovic - The Rise of Sovereign AI: Building the Regi...](https://cdn.slidesharecdn.com/ss_thumbnails/7nw2xxixrxqdxvrb5wca-6-251205085714-ab09a2ac-thumbnail.jpg?width=640&height=640&fit=bounds)