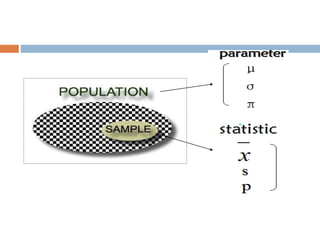
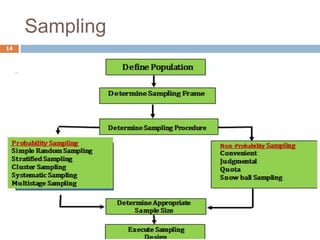
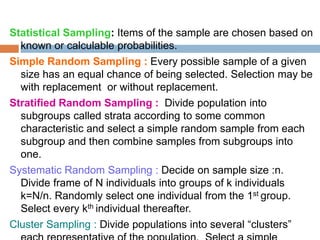
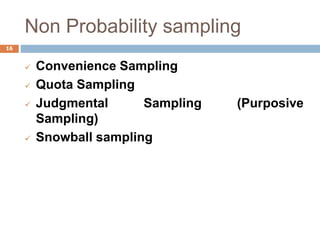
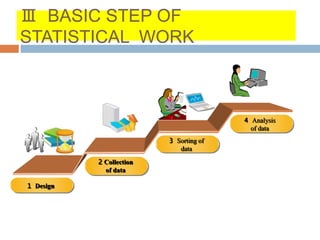
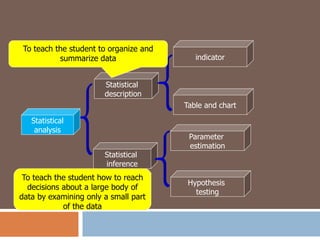
This document provides an introduction to biostatistics. It defines biostatistics as the application of statistical tools and concepts to data from biological sciences and medicine. The two main branches of statistics are described as descriptive statistics, which involves organizing and summarizing sample data, and inferential statistics, which involves generalizing from samples to populations. Several key statistical concepts are also defined, including populations, samples, variables, data types, levels of measurement, and common sampling methods. The objectives are to demonstrate knowledge of these fundamental statistical terms and concepts.

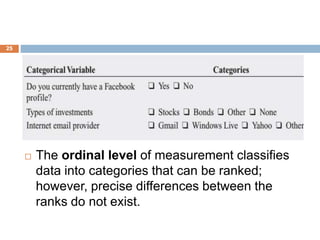
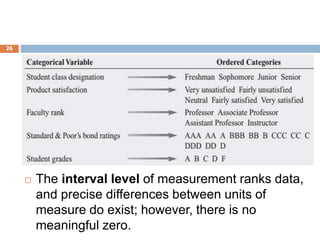
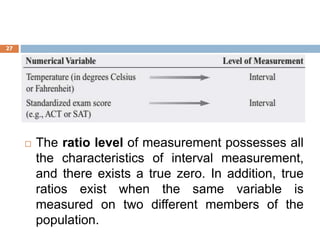


![PERI-PROSTHETIC FRACTURE NAIL-PLATE CONSTRUCT [NPC].pptx](https://cdn.slidesharecdn.com/ss_thumbnails/drarunkumardrmohamedashrafperiprostheticfrasturenail-plateconstructnpc-260209164459-7e9d15a1-thumbnail.jpg?width=640&height=640&fit=bounds)


